BLOG
End‑to‑End Go‑To‑Market Strategy in India: How Anaxee Delivers 100 % Market Coverage with Digital Runners
The Definitive GTM Playbook for India
1. Why India Needs a Different Kind of GTM
Ask any sales head what keeps them up at night and you’ll hear the same pain points: fragmented retail, unpredictable distributor commitment and glaring coverage gaps between urban, tier‑3 and rural outlets. India has 15 million retail shops but fewer than a million are fully serviced by organized distribution. Traditional “appoint‑a‑dealer‐and‑pray” tactics no longer cut it.
Core problem: brands run blind. They don’t know how many relevant outlets actually exist or why a supposedly active territory is selling only half its potential. Without data, there is no precision.
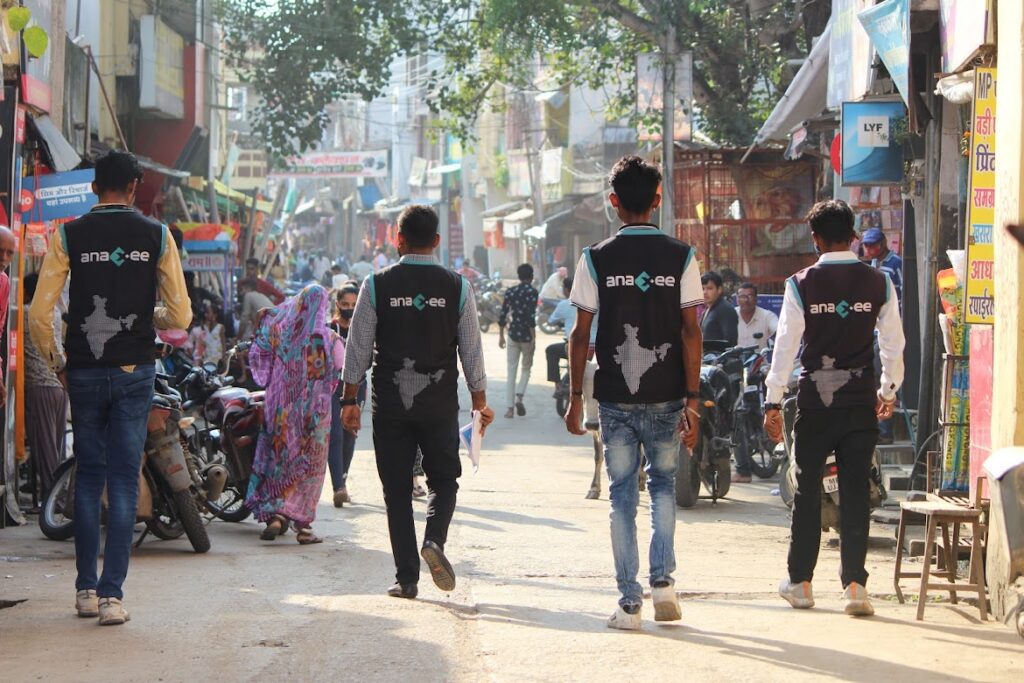
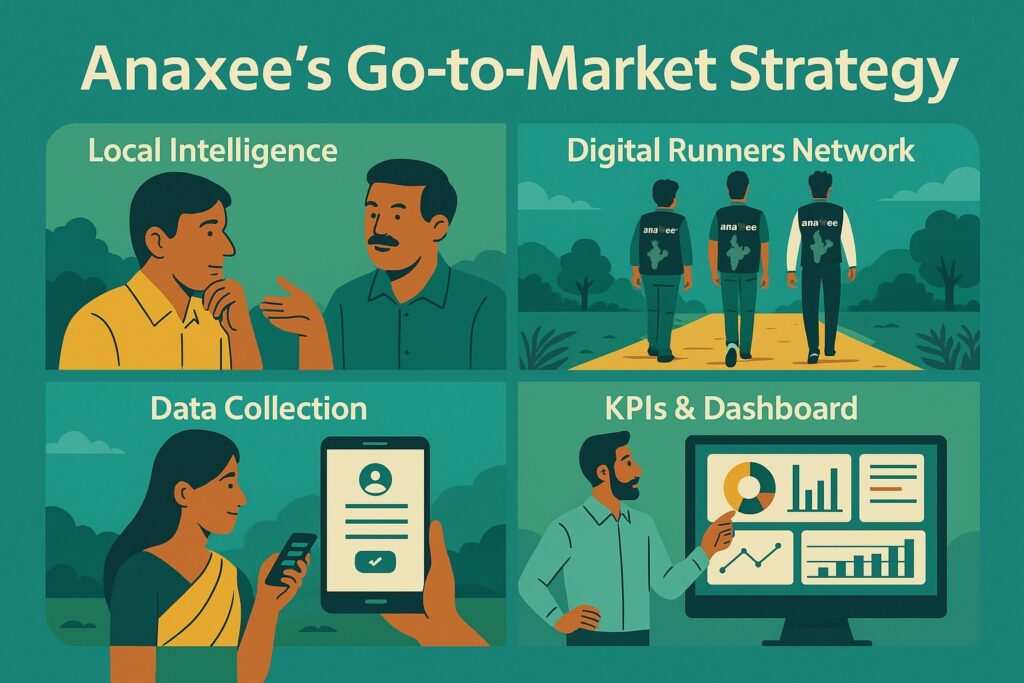
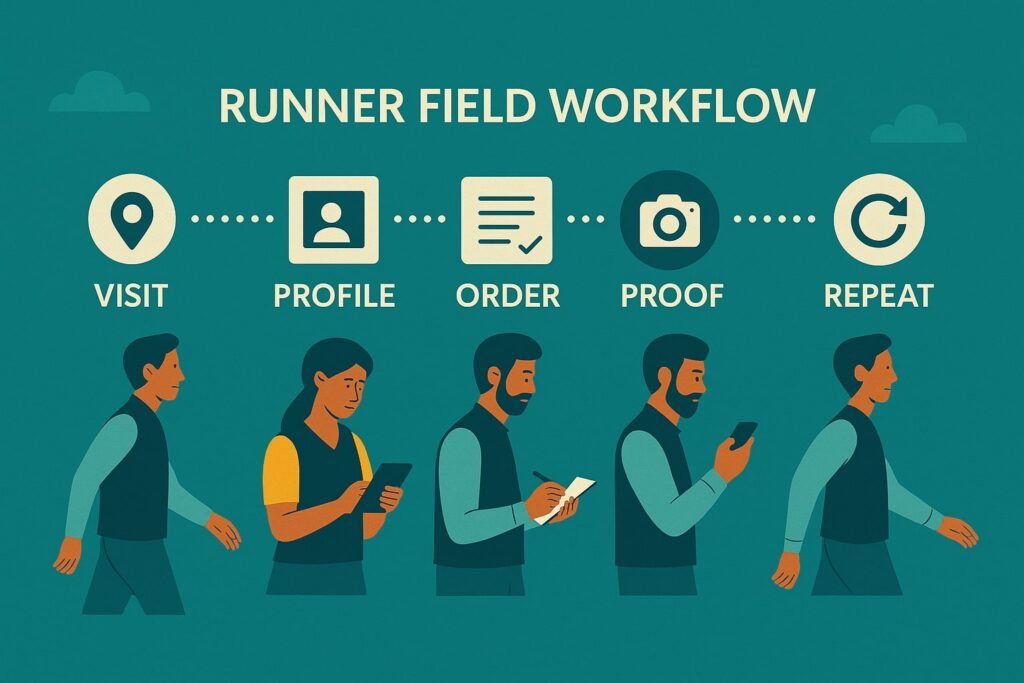
Anaxee’s answer is a ground‑truth‑first model built on three sequential levers—Market Mapping → Retailer Profiling (KYR) → Order Taking—executed by a pan‑India on‑demand workforce called Digital Runners.
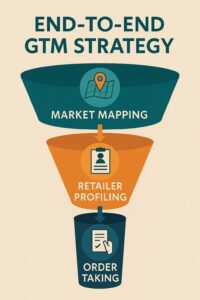
2. The Three‑Lever Framework Explained
| Lever | Purpose | Key Output | Typical Fails Without It |
| Market Mapping | Build a census of every target outlet in a district | Geo‑tagged universe with shop type, GPS & photos | Guess‑based sales targets, hidden white space |
| Retailer Profiling (KYR) | Capture what each shop sells, buys & needs | Structured data on stockists, credit issues, volumes | No clue why distributor push fizzles out |
| Order Taking | Convert insight into paid orders | In‑app order synced to distributor & brand CRM | Irregular primary sales, month‑end fire‑fighting |
Only when all three layers stack do brands unlock predictable growth.
3. Lever 1 – Market Mapping: Turning the Lights On
Imagine entering a dark warehouse with a torch. Mapping is that torch:
-
Define universe – agree SKU families and retail formats (kiranas, chemists, agri‑input, hardware…).
-
Deploy Digital Runners – each Runner carries an app that geo‑tags the shop front, captures frontage photo and auto‑transcribes address.
-
Classify – AI inside the app labels store type and potential A/B/C class so territory managers can sequence focus.
Case Snapshot: In Eastern Uttar Pradesh, a durables brand believed it had “covered” Gorakhpur. Mapping showed only 140 of 404 relevant outlets carried even one SKU. Within six weeks of visibility the gap halved.
Why CFOs care: mapping costs < ₹15 per outlet, yet prevents crores in wasted trade schemes sprayed at the wrong retailers.
4. Lever 2 – Retailer Profiling: Knowing Every Shop’s DNA
With universe locked, Runners revisit each outlet to run a KYR form that asks:
-Current brands and SKUs
-Buying source & credit days
-Monthly offtake volume
-Service pain‑points
-Owner’s brand affinity score (a simple 1–5 star slider)
Data flows real‑time to a dashboard that slices opportunity by SKU gap, distributor influence and credit risk.
Patterns jump out:
-22 % of hardware stores stocked the client’s competitor only because of 15‑day faster service.
-40 % of C‑class rural outlets could up‑trade if small packs were introduced.
These are fact‑based triggers for marketing, finance and product teams.
5. Lever 3 – Order Taking: From Insight to Cash
Profiling converts to revenue only when every rep visit ends with a digital order.
How it works
-
Runner opens the shop’s profile; app auto‑suggests missing SKUs.
-
Owner confirms quantities; digital signature locks order.
-
System pushes PO to assigned distributor; both brand and Runner track fulfilment.
-
Runner collects feedback on next visit → closed‑loop learning.
One Gorakhpur outlet said “maybe later” three times. The fourth visit—armed with KYR intel on credit pain‑points—landed a ₹5 000 trial order, doubled to ₹10 000 within 30 days.
On‑demand model: Runners are paid per productive visit, so brands avoid heavy fixed FOS payroll yet get the rigour of daily call‑cycles.
6. Technology Spine
-GPS + time stamps – eliminates fake visits.
-Photo proof – verifies merchandising execution.
-AI audit – flags blurry photos, wrong SKU display.
-API hooks – integrate with SAP, Dynamics or any ERP so existing dashboards light up automatically.
-Distributor portal – mini‑CRM for smaller partners who lack sophisticated systems.
7. Phased Roll‑Out for Rapid ROI
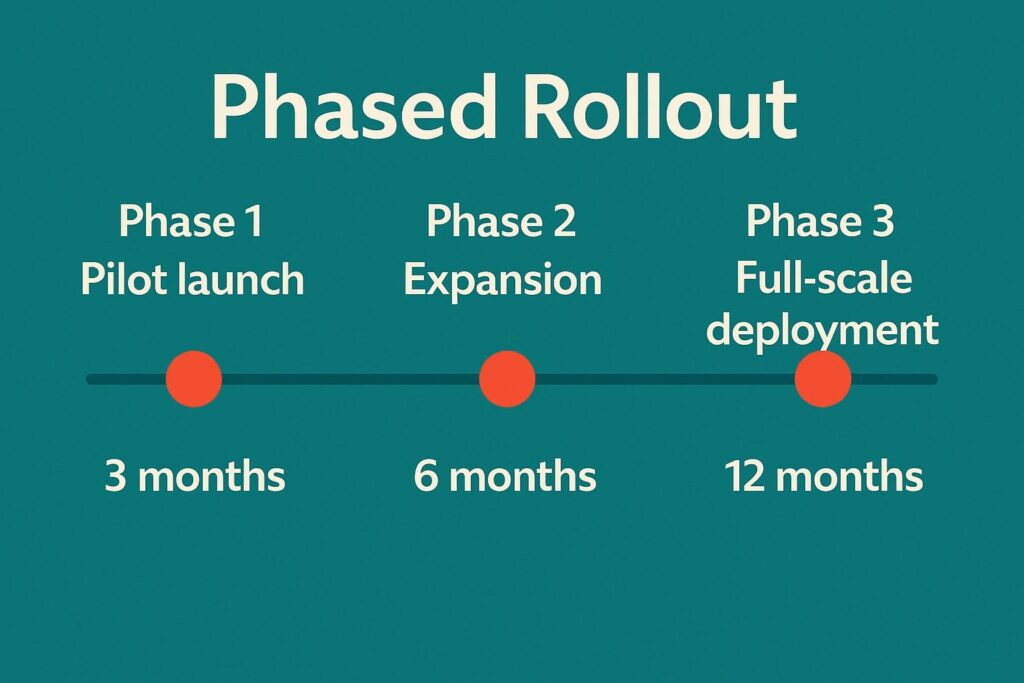
| Phase | Focus Districts | % of Universe | Timeframe | Goal |
| P1 – Quick‑Win | Top‑volume 5‑7 districts | 30–35 % | Month 1–2 | Early cash lift, proof for sales team |
| P2 – Momentum | Next 10–12 high‑potential districts | 25–30 % | Month 3–5 | Build distributor conviction |
| P3 – Moat | Remaining tail districts + rural clusters | 35–40 % | Month 6–9 | Full coverage; defend share |
A phased map avoids budget dilution and creates motivational success stories for the field force.
8. KPIs That Actually Matter
-
Coverage Ratio – outlets buying ≥1 SKU ÷ total mapped outlets (target 70 % in 12 months).
-
SKU Depth – average SKUs per outlet (target 4+ in durables; 6+ in FMCG).
-
Average Order Value (AOV) – ₹/order via app; measure MoM lift.
-
Distributor Fulfilment Lead Time – ≤72 h for 95 % of orders.
-
Cost per Activated Outlet – total spend ÷ first‑order outlets; benchmark against trade‑scheme burn.
Dashboards refresh every 24 hours, preventing end‑quarter shocks.
9. Building a Distributor‑First Culture
Brands often fear tech will alienate channel partners. Anaxee flips that:
-Lead Generation – all mapped outlets funnel to nearest distributor.
-Demand Predictability – app orders level out the month so trucks run full week two, not just month‑end.
-Credit Control – KYR data warns of risky outlets, helping distributors reduce bad debt.
When distributors realise the system drives incremental sales (not bypass), adoption soars.
10. Common Pitfalls & Pro Tips
| Pitfall | Consequence | Fix |
| Skipping Mapping | Sales targets built on fiction | Map first, even if partial; data unlocks correct targets |
| One‑off Blitz, no revisit | Retailers lapse after promo | Automate call cycle alerts; minimum one touch / 30 days |
| Treating Rural late | Competitors lock loyalty first | Insert rural clusters into Phase 2, not tail end |
| Overselling Credit | Distributor cashflow strain | Link credit limits to AOV growth curves |
| Ignoring Training | Low‑touch categories fail to convert | Schedule quarterly demo clinics using Runner invites |
11. Beyond Sales: How Brands Re‑Use the Data
-Marketing ROI – map helps geo‑target billboards within 1 km of high‑potential clusters.
-New Product Launch – KYR flags unmet needs—e.g., battery brand launched solar‑inverter combo after 38 % retailers requested it.
-Supply Chain – aggregated orders guide warehouse location planning.
-Finance – outlet‑level cash‑cycle insight sharpens credit policies.
Data gathered once continues to pay dividends quarter after quarter.
12. Real‑World Outcomes
| Brand | Category | Before Anaxee | After 9 Months |
| Appliance Co. | Small kitchen appliances | Avg. 18 orders/month/distributor; <50 % outlets served |
42 orders/month, 79 % coverage, ₹1.6 Cr extra GM
|
| Footwear Brand | Affordable fashion | Rural sales 12 % of total |
Rural share 28 %, village recall +3 pts
|
| Agri‑input Maker | Fertiliser & micronutrients | Service complaints 15 % of orders |
Complaints down to 4 %; ₹/order +22 %
|
13. Implementation Roadmap (First 90 Days)
| Week | Milestone |
| 1 |
Kick‑off workshop, universe definition, SKU hierarchy locked
|
| 2–3 | Pilot mapping (2 districts) – validate data schema |
| 4–6 | Scale mapping to full Phase 1 |
| 7–8 | KYR profiling on 100 % Phase 1 outlets |
| 9 | Order‑taking sprint begins; distributors onboarded to portal |
| 10–12 | Weekly KPI reviews; refine call cycles; prepare Phase 2 |
14. Why the Digital Runner Model Wins
-Elastic Field Force – scale up or down by district without hiring freezes or layoffs.
-Uniform Execution Quality – one training module, one app; data audits police compliance.
-Cost Advantage – pay‑per‑productive‑visit model keeps CAC predictable.
-National Footprint – 11 000+ pincodes already covered, so expansion is weeks not months.
In essence, Runners bring the granularity of a company salesman with the flexibility of gig economics.
15. Frequently Asked Questions
Q1. Is this only for non‑FMCG?
No. FMCG giants use mapping too, but Anaxee’s model shines where traditional pull is weak—durables, agri‑inputs, fintech, pharma OTC and even EV charging networks.
Q2. What if my distributor refuses tech?
Distributors get free dashboards, lead allocation and faster sell‑out. Adoption rates exceed 90 % once they see incremental orders.
Q3. How many visits do Runners make before an outlet activates?
Average is 2.7 touches. High‑ticket durables take 3‑4; FMCG impulse SKUs convert in 1‑2.
Q4. Can I integrate my SAP?
Yes—REST APIs push orders and retailer IDs straight into any ERP or DMS.
Q5. Do I lose control of my brand?
No. You set price, credit and promo rules; Runners follow SOP scripted in the app.
16. Call to Action
Ready to plug predictable growth into your distribution? Book a 30‑minute demo to see live dashboards for your top target districts and calculate your potential Cost per Activated Outlet before you spend a rupee.
Connect with Anaxee at sales@anaxee-wp-aug25-wordpress.dock.anaxee.com