BLOG
GHG Accounting 101: Boundaries, Scope & Best Practices | Anaxee
Introduction to GHG Accounting: Boundaries & Scope
Greenhouse gas (GHG) accounting sounds technical—and, truth be told, it is a bit technical—but the basic idea is simple: we want to know how much climate‑warming gas an organisation is responsible for and what we can do to shrink that number. Whether you run a small factory in Indore or a multi‑site tech company with offices across India, a clear, consistent GHG inventory is the starting line of any credible climate programme.
In this guide we’ll walk through all the core building blocks—from the global standards and key definitions to the nitty‑gritty of emission factors and data templates—using plain language and plenty of real‑world examples. By the end you should feel confident setting the right boundaries, picking the right scope, and choosing calculation methods that fit your business reality.
1. What Is a GHG Inventory?
If you have ever kept a household budget, you already get the logic: list every source of income and expense, add it up, and see where the big numbers lie. A GHG inventory does the same for carbon—except instead of rupees we measure in tonnes of CO₂‑equivalent (tCO₂e).
Why it matters
✔️ Regulators in many countries, including India’s BRSR reporting, are nudging—or outright demanding—companies to disclose climate impacts.
✔️ Large customers push smaller suppliers to share carbon numbers before placing an order.
✔️ Investors watch the data to judge climate risk.
✔️ Internally, a first inventory often reveals surprising “hidden” hotspots that save real money once tackled.
A credible inventory must be complete, consistent, transparent, accurate, and re‑calculable. Those five words show up again and again in the standards, so keep them close.
2. The Standards: GHG Protocol and ISO 14064 / 14067
2.1 GHG Protocol
The Greenhouse Gas Protocol—developed by WRI and WBCSD—is the de‑facto global playbook. It is split into three main parts:
- Corporate Standard (organisational inventories)
- Project Protocol (specific projects like a solar farm)
- Scope 3 Standard (value‑chain emissions)
It lays out definitions for Scopes 1, 2, and 3, boundary setting, and reporting rules. Most assurance firms in India benchmark your report against this standard, even if you are also using ISO.
2.2 ISO 14064 (Parts 1, 2, 3)
ISO 14064 is a three‑part series:
| Part | Focus | Typical User |
| 1 | Organisational inventories | Companies, city governments |
| 2 | Projects | Carbon offset developers |
| 3 | Verification & validation | Auditors |
ISO wording is more formal than the GHG Protocol but broadly compatible. Many Indian companies reference both to satisfy international buyers.
2.3 ISO 14067
This is the product carbon footprint cousin—handy when you need a cradle‑to‑grave footprint for a single product line.
Tip: Think of ISO 14064‑1 as company‑wide accounts and ISO 14067 as a product P&L. The math overlaps but the audiences differ.
3. Organizational vs Operational Boundaries
Before crunching numbers, decide whose emissions you include and which activities count.
Organizational boundary deals with ownership and control. If your firm owns 60 percent of a joint venture, do you count 60 percent of that JV’s diesel use or the whole 100? This is where consolidation approaches (next section) come in.
Operational boundary slices emissions into Scope 1, Scope 2, and Scope 3. You might fully own a warehouse (organisational control) but report only Scope 1 diesel generator use and Scope 2 grid electricity, while leaving third‑party trucking in Scope 3.
Getting these two boundaries clear up‑front avoids double‑counting later on.
4. Consolidation Approaches
- Equity Share – Account for emissions in proportion to your economic stake. Own 30 % of a plant? Take 30 % of its CO₂.
- Control Approaches
- Financial Control – If you have the power to direct financial policies (even without full ownership), count 100 % of emissions.
- Operational Control – If you run day‑to‑day operations (e.g., dispatch schedules), you take 100 %.
Most multinationals prefer operational control; it lines up neatly with decision‑making power. SMEs with simple structures often use equity share for ease.
How to choose?
-Use financial control when your corporate accounts already consolidate that way—keeps auditors happy.
-Use operational control if sustainability teams drive equipment upgrades but finance sits elsewhere.
Document the reasoning once. Changing approaches mid‑stream creates headaches.
5. Scope 1, Scope 2, Scope 3 Explained
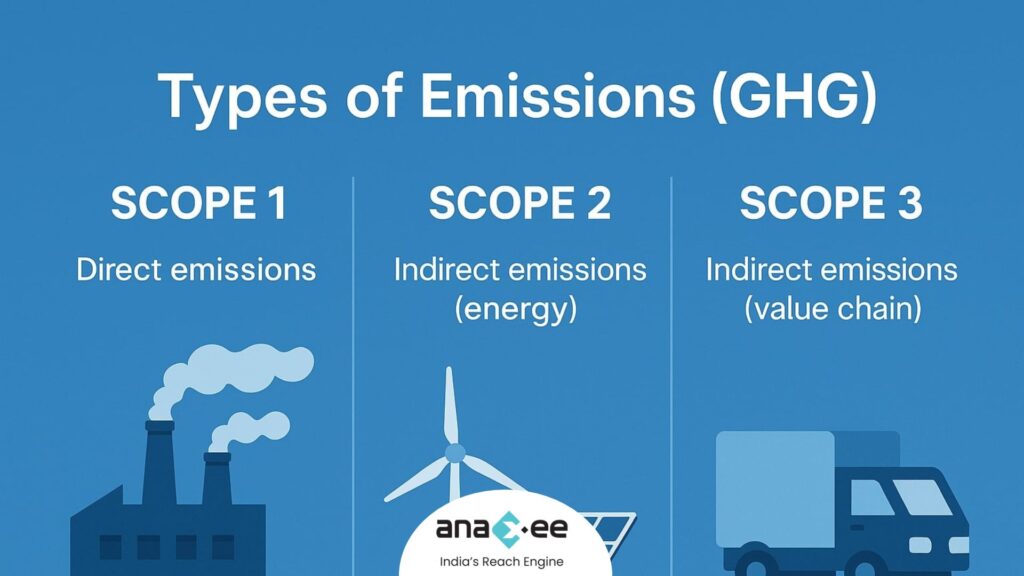
| Scope | What it covers | Simple example |
| Scope 1 | Direct emissions from sources you own or control | Fuel burned in your diesel gensets |
| Scope 2 | Indirect emissions from purchased electricity, heat, steam, or cooling | CO₂ from coal‑based power plants that feed your grid electricity |
| Scope 3 | All other indirect emissions across the value chain | Supplier mining of iron ore, business travel, customer product use |
Key takeaways
– Scope 1 is usually the smallest in a service company but the largest in heavy industry.
– Scope 2 often spikes if your site sits in a coal‑heavy grid region (think Chhattisgarh, Jharkhand).
– Scope 3 can dwarf the other two—up to 90 %—especially for consumer brands.
Don’t panic if Scope 3 data is messy on Day 1. Most firms phase it in: categories with good data first (business travel, purchased electricity); harder ones later (supplier primary data).
6. Emission Source Identification
Start with a brainstorm. Sit with facility managers, procurement folks, and a floor operator. List all activities that release GHGs. Common culprits:
-Stationary combustion: boilers, furnaces, gensets
-Mobile combustion: fleet trucks, forklifts, two‑wheelers
-Process emissions: cement calcination, ammonia production
-Fugitive emissions: refrigerant leaks (HFC‑134a), SF₆ from switchgear
-Purchased energy: grid electricity, district cooling
-Waste handling: anaerobic effluent lagoons, landfilled solid waste
Use site walk‑throughs and procurement records to cross‑check. The goal is thoroughness, not perfection at this stage.
7. Calculation Approaches
7.1 Combustion Sources
Most common formula:
Fuel Activity Data × Emission Factor × (1 − Oxidation Factor) = tCO₂eActivity Data can be litres of diesel or kWh of LNG.
7.2 Process Emissions
For limestone calcination in a cement kiln:
Clinker Produced (t) × CaCO₃ Content (%) × Stoichiometric CO₂ Ratio7.3 Fugitive Emissions
Refrigerant top‑up method:
(Refrigerant added during year) × GWP100 of gasIf equipment inventory is spotty, use mass‑balance or screening factors from IPCC.
8. Worked Examples
Example 1: Diesel Combustion
Factory generator used 12,000 litres of diesel in FY 2024‑25.
-IPCC default EF: 2.68 kg CO₂/litre
-Oxidation factor: 1 (diesel combusts fully)
12,000 L × 2.68 kg/L = 32,160 kg CO₂ = **32.16 tCO₂**Add minor CH₄ and N₂O using defaults to get CO₂‑equivalent.
Example 2: HFC‑134a Leakage
Three chillers each charged with 12 kg HFC‑134a. Average annual leak rate: 12 %.
Charge (12 kg × 3) × Leak Rate 0.12 = 4.32 kg HFC‑134a-GWP100 for HFC‑134a: 1,430
4.32 kg × 1,430 = 6,177.6 kg CO₂e ≈ **6.18 tCO₂e**9. Emission Factors & Tiers
The IPCC and GHG Protocol talk about Tiers—basically the confidence level of your emission factor.
| Tier | Source of Factor | Typical Use Case |
| 1 | Global or national default | Early‑stage inventories, SMEs |
| 2 | Technology‑specific factors | Sector averages (e.g., coal vs gas power plants) |
| 3 | Direct measurement or supplier‑specific data | Mature programmes, regulated facilities |
Pro tip: Start Tier 1, graduate to Tier 2 for big hotspots, and aim for Tier 3 where it matters (e.g., steel billets, power plants).
10. Scope 2: Location‑Based vs Market‑Based
-Location‑based: Uses the average grid emission factor where your site sits. Good for benchmarking and mandatory disclosure.
-Market‑based: Lets you account for renewable energy purchases (RECs, PPAs) at supplier‑specific factors.
If you buy solar under an open‑access PPA, market‑based Scope 2 can drop dramatically—even to near‑zero—while location‑based stays unchanged. Many sustainability reports show both numbers side‑by‑side to avoid confusion.
11. Data Templates That Actually Work
A clean spreadsheet beats fancy software during the first year. Core columns to include:
| Activity | Unit | Quantity | Emission Factor | Factor Source | Scope | Evidence |
| Diesel – Generator | L | 12,000 | 2.68 kg CO₂/L | IPCC 2021 | 1 | Purchase invoices |
Use dropdown lists for units and scopes to cut entry errors. Link evidence (PDF invoices, meter photos) inside the sheet or a shared drive.
Once volume grows, tools like Anaxee Carbon Track or Sphera can automate factor look‑ups, but don’t underestimate a tidy Excel.
12. Building an Ideal GHG Management System
- Policy & Governance – Board‑level mandate, clear roles.
- Boundary & Scope Definition – Document once, review annually.
- Data Collection Framework – Standardised templates, training for site staff.
- Emission Factor Library – Central, version‑controlled, updated yearly.
- Quality Assurance – Spot audits, automated checks, third‑party verification.
- Reduction Roadmap – Science‑based targets, capex plan, quick wins.
- Communication & Disclosure – Align with GRI, CDP, and India’s BRSR.
- Continuous Improvement – Year‑on‑year intensity reduction, digitalisation, supplier engagement.
Implementing all eight pillars turns GHG accounting from an annual chore into a strategic decision tool.
13. Conclusion
GHG accounting may feel overwhelming at first, but remember: the heaviest lift is simply getting started. Nail your boundaries, pick sensible emission factors, and be transparent about assumptions. As data quality improves, your reduction roadmap writes itself.
At Anaxee, we help organisations across India navigate this journey—whether it’s choosing a consolidation approach or setting up cloud‑based templates that cut reporting time in half. Ready to transform your carbon reporting into climate action? Get in touch today.
Frequently Asked Questions (FAQs)
Q1. Do I need third‑party verification?
Verification isn’t mandatory in India for all sectors yet, but large corporates seeking CDP leadership scores or international financing should budget for it.
Q2. How often should I update emission factors?
Best practice is annually. Grid factors, for instance, change as renewable capacity grows.
Q3. Are biogenic CO₂ emissions counted?
Report them separately. They don’t add to the fossil CO₂ total but must be disclosed.
Q4. Can I exclude de minimis sources?
Yes, but clearly define the threshold (e.g., <1 % of total emissions) and list what you left out.
About Anaxee:
Anaxee is India’s Reach Engine! we are building India’s largest last-mile outreach network of 100,000 Digital Runners (shared feet-on-street, tech-enabled) to help Businesses and Social Organizations scale to rural and semi-urban India, We operate in 26 states, 540+ districts, and 11,000+ pin codes in India.
We Help in last-mile execution of projects for (1) Corporates, (2) Agri-focused companies, (3) Climate, and (4) Social organizations. Using technology and people on-the-ground (our Digital Runners), we help in scale and execute projects across 100s of cities and bring 100% transparency in groundwork. We also work in the Tech for Climate domain, providing technology for the execution and monitoring of Nature-Based (NbS) and Community projects. Our technology & processes bring transparency and integrity into carbon projects across various methodologies (Agroforestry, Regen Agriculture, Solar devices, Improved Cookstoves, Water filters, LED lamps, etc.) worldwide.
For More info or query, Connect with sales@anaxee-wp-aug25-wordpress.dock.anaxee.com