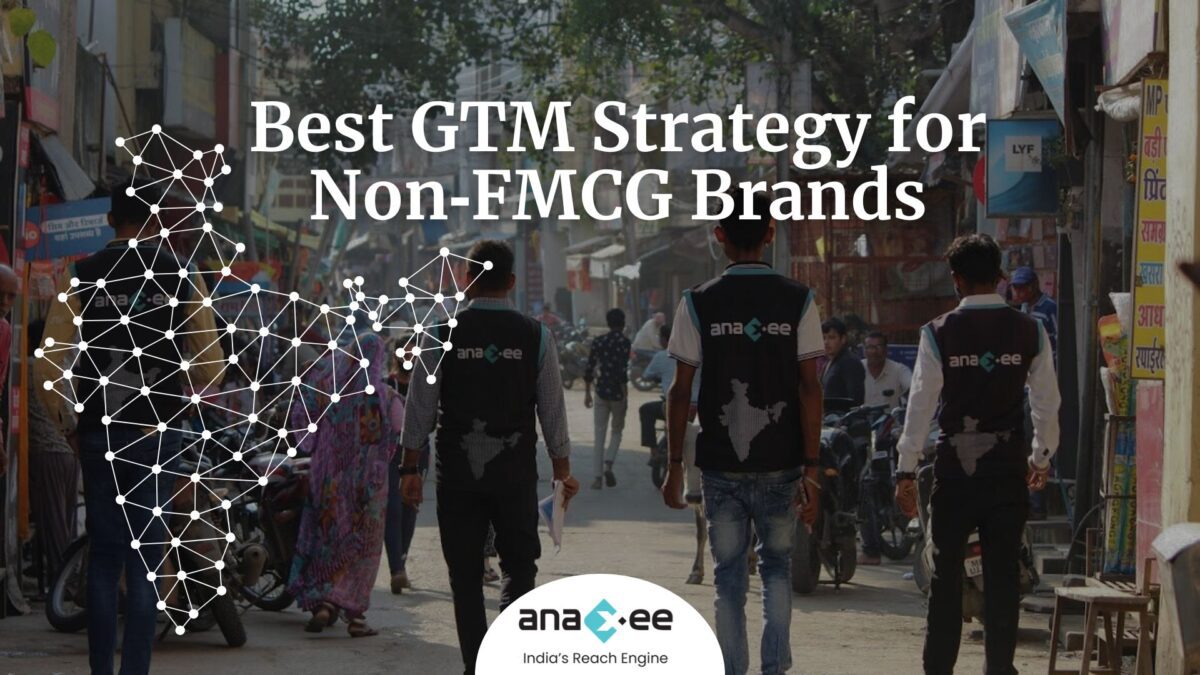
Best GTM Strategy for Non‑FMCG Brands
1. Why non‑FMCG distribution is broken
Durables and discretionary products- appliances, tyres, batteries, cookware, footwear-do not enjoy the pull that soap or biscuits do. Retailers seldom ask for stock proactively; distributors often cover only the low‑hanging outlets they already know. The result is lumpy sales, territory gaps and weak brand loyalty.
Top FMCG winners overcame the same geography by actively supporting distributors and driving field execution. The obvious play, therefore, is to adapt those proven levers—market coverage, retail activation and data discipline—to categories where they never existed.
2. What we can borrow from FMCG
FMCG playbooks revolve around six hard rules: generate uniform monthly sales in every district, squeeze full market potential, touch every outlet regardless of relationships or credit terms, expand into satellite towns, build district‑level brand affinity and stay visible against competing brands. Non‑FMCG brands need the same muscle—but with longer purchase cycles, higher ASPs and fragmented dealer networks, execution must be sharper and tech‑enabled.
3. A three‑step GTM framework that works
Anaxee distils the FMCG wisdom into three sequential steps:
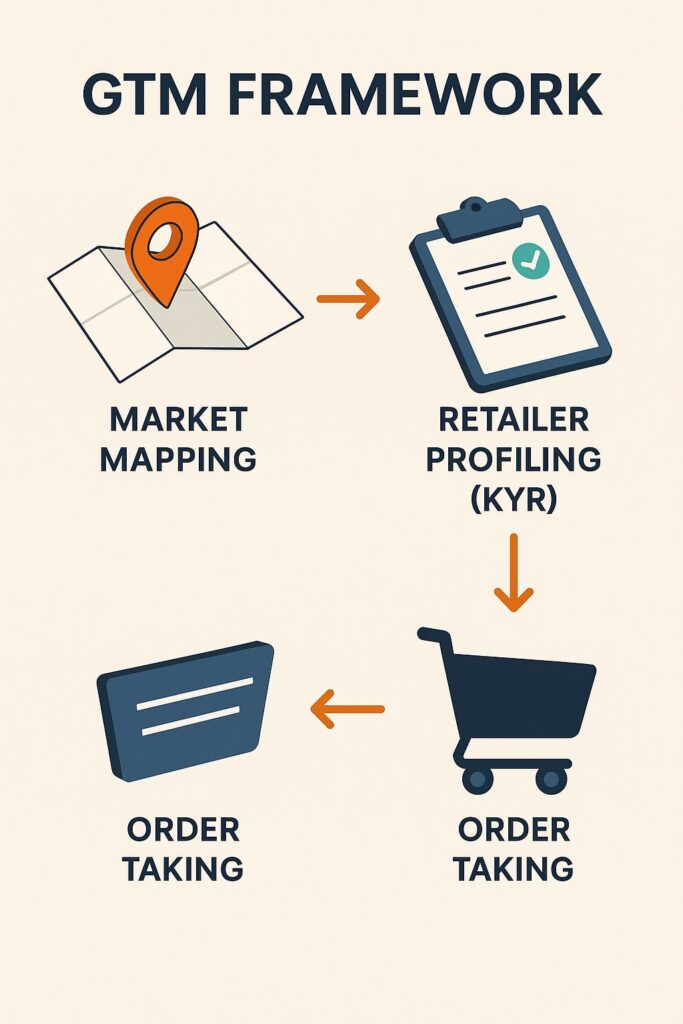
Market Mapping
Retailer Profiling (KYR)
Order Taking
Each step fixes one layer of the funnel- visibility, insight, then conversion. Below we unpack how the framework plays out on the ground and why it beats ad‑hoc distributor push.
4. Step 1 – Market Mapping: see every shop before you sell
4.1 The problem
Most brands think they’re “present” in a region once a distributor opens a few top outlets. Reality check: in East UP alone, 8 000 target shops existed across 27 districts . Without mapping, 50‑60 % of that universe stays dark.
4.2 The solution
Digital Runners comb every street with a GPS‑enabled app, tagging each store’s coordinates and category. In East UP the first five districts (Deoria, Gorakhpur, Sultanpur, Jaunpur, Prayagraj) already represented 35 % of the addressable market, forming Phase 1 of rollout . Phases 2 and 3 cover the remaining 65 %, letting brands sequence resources logically.
4.3 Why it matters
Mapping forces fact‑based territory design instead of gut feel. It also lays the benchmark for later KPIs: coverage ratio, outlet class mix, district share.
5. Step 2 – Retailer Profiling: know your retailer (KYR)
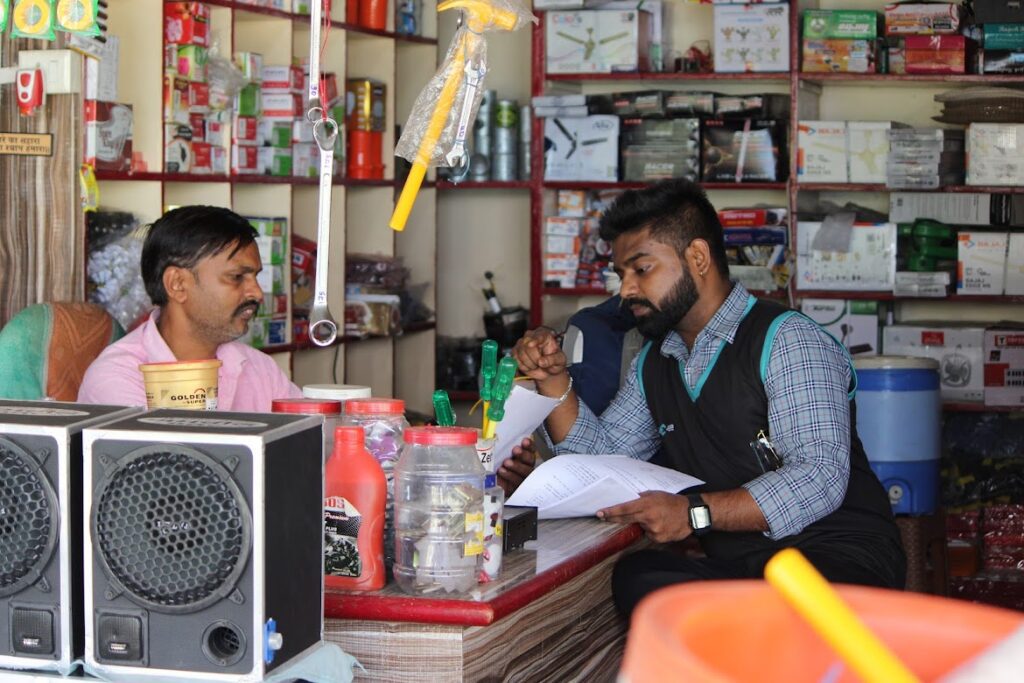
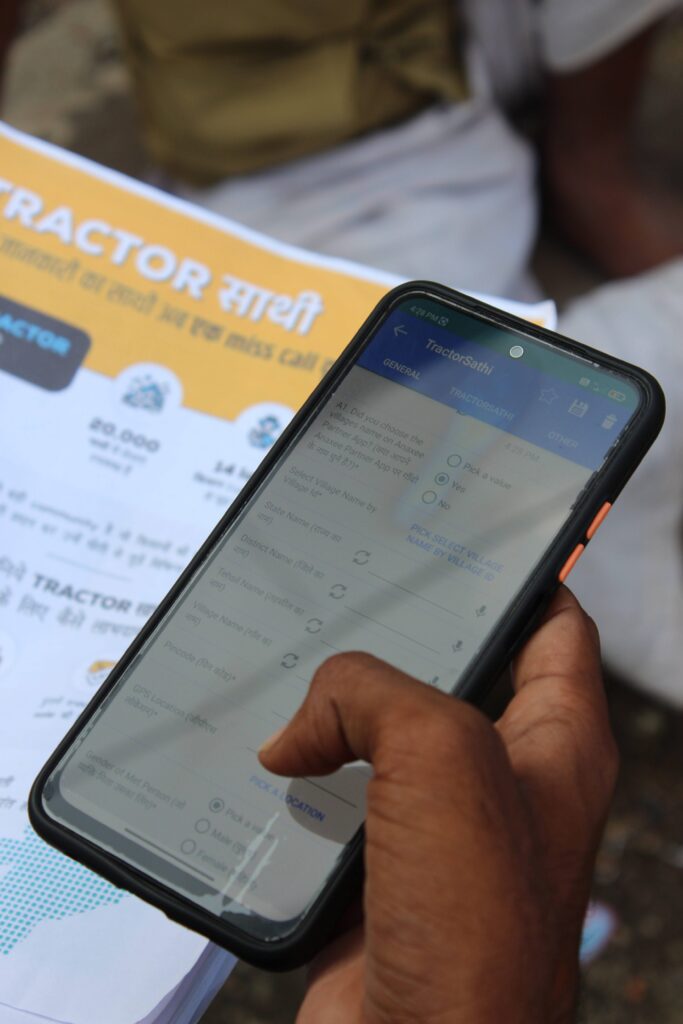
With the shop universe in hand, field teams capture SKU‑level intel: what brands the store sells, from whom it buys, credit pain‑points and monthly offtake. The KYR form inside Anaxee’s app links every data point to the store ID .
Key insights that emerge:
-True competitor spread—e.g., of 404 electronics outlets in Prayagraj, only 140 already stocked the client’s brand, leaving 264 un‑tapped prospects.
-Product width vs depth—some outlets sell induction cooktops but not mixers; others move kettles but no vacuum cleaners.
-On‑ground challenges—credit limits, service turnaround, low MOQ.
Profiling translates anecdotes into quantified opportunity.
6. Step 3 – Order Taking: convert data into revenue
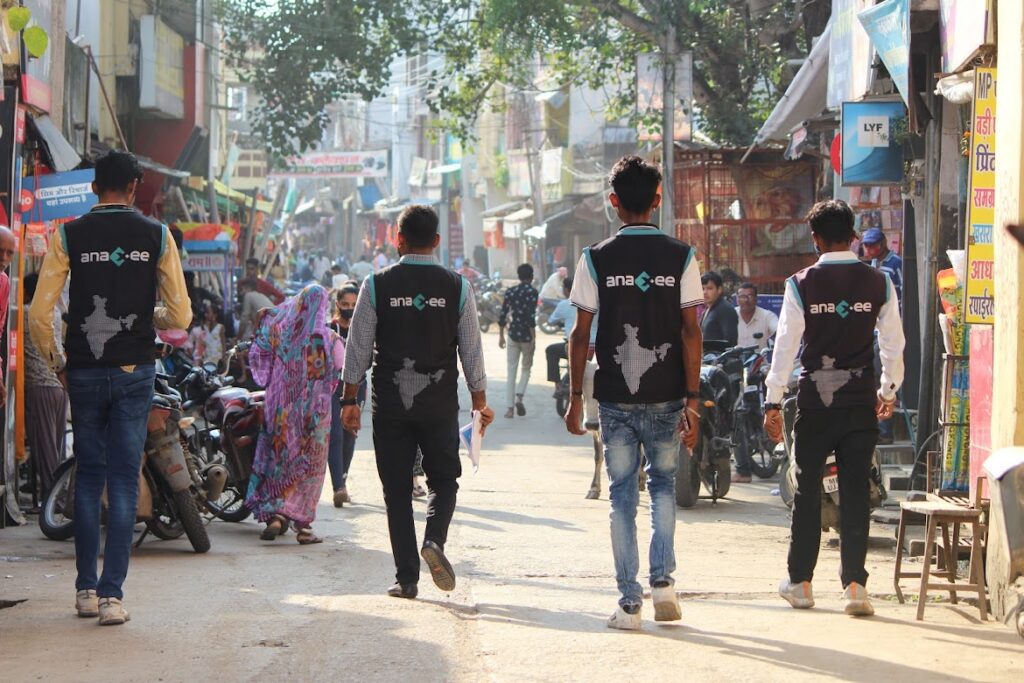
Instead of hiring a permanent feet‑on‑street (FOS) army, brands piggyback on Anaxee’s Digital Runners network. Runners revisit the profiled outlets, pitch missing SKUs, create orders in‑app and sync them to distributors—the “Uberisation” of order capture.
When a previously “not‑interested” retailer in Gorakhpur flipped after four visits and placed a ₹5 000 trial order, tech logs every attempt, objection and SKU mix. Over time, repeat visits grow both width (more outlets) and depth (basket size).
7. Empowering distributors rather than bypassing them
The framework keeps distributors central but augments them with visibility, verified leads and a predictable sales cadence—solving the classic “empty pipeline” Mondays and month‑end rush. A territory manager switches from chasing speculations to servicing confirmed in‑app orders. The model also defuses dependency risk: decisions rest on real‑time dashboards, not anecdotal feedback.
8. Phase‑wise roll‑out and resource optimisation
Market mapping data lets you stage execution:
-Phase 1 (top‑five districts) delivers the fastest ROI—35 % share captured first.
– Phase 2 (next 25 %) builds momentum.
-Phase 3 mops up the tail, adding resilience.
The phased plan prevents dilution of marketing budgets and ensures early success stories to motivate distributors.
9. Measuring what matters
| KPI | Definition | Winning Benchmark |
| Coverage Ratio | Shops selling at least one SKU ÷ Total mapped shops | >70 % in 18 months |
| Average Order Value (AOV) | ₹ per order captured via app | Sustained 10 % MoM growth |
| SKU Depth Index | Average SKUs per outlet | 4+ in appliance category |
| Distributor On‑time Fulfilment | Orders delivered within 72 h | 95 % |
Dashboards update daily, pushing real accountability rather than end‑quarter surprises.
10. Technology backbone that makes the model scale
The Anaxee Partner app:
-Geo‑tags every visit and photo‑proofs merchandising compliance.
-Runs logic‑based call cycles so no outlet is missed.
-Streams real‑time analytics down to SKU and shop level.
This data spine is why the framework stays lean—brands avoid the overhead of building their own CRM, routing or payroll stack.
11. Common pitfalls—and how to dodge them
| Pitfall | Reality check | Fix |
| Over‑promising credit | Distributors over‑extend, then freeze ordering. |
Align credit terms with AOV growth trajectories; monitor ageing in dashboards.
|
| Ignoring product training | Durable‑goods retailers need demo knowledge. |
Layer quarterly clinics using runner visits as invites.
|
| Treating rural as an after‑thought | Rural markets now account for 45 % of durables growth, fuelled by rising disposable income. |
Map satellite towns in Phase 2 rather than Phase 3.
|
12. The macro tailwinds you can ride
Organized retail is expected to top US $230 billion by 2030 as brands pivot to omnichannel reach. Consumer‑electronics alone is set to hit US $152 billion by 2033 at a 6.9 % CAGR. A GTM system that taps district‑level kiranas before competitors lock them gives non‑FMCG players asymmetric advantage in this expansion wave.
13. Implementation roadmap (90‑day view)
Kick‑off workshop – finalise outlet universe definition and SKU hierarchy.
Pilot mapping – 2 districts, 30 days, validate data schema.
Scale mapping – full phase roll‑out by day 60.
Live profiling – KYR on 100 % mapped outlets by day 75.
Order‑taking sprint – targeted revisit cadence starts day 76; AOV tracked weekly.
Distributor review – dashboard‑driven adjustments day 90.
14. The payoff
-Uniform sales every month, versus the typical spike‑and‑crash cycle.
-Reduced channel conflict—data exposes overlap and white‑space.
-Brand share‑of‑shelf expands as width (outlet count) and depth (SKU mix) improve together.
-Lower fixed cost than hiring a large proprietary salesforce. Our 50,000+ Network of Digital Runners is just a mail away.
15. Ready to deploy?
Anaxee already runs this GTM engine for multiple utensils, electric appliance, footwear and auto‑lube, tyres brands- so you don’t start from zero. Book a discovery call to see mapping dashboards for your category and region. Connect with us at sales@anaxee-wp-aug25-wordpress.dock.anaxee.com