Introduction – Why This Matters Now
Climate change used to sound like a distant risk. In 2025 it is the daily context for business, policy and personal life. From record‑shattering heatwaves in India’s pre‑monsoon season to surging insurance costs after back‑to‑back cyclones, the signals are no longer abstract. This article unpacks the science and policy landscape behind those signals, using the latest publicly available numbers and reports so you can ground decisions in fact, not hype.
1. What Is Climate Change?
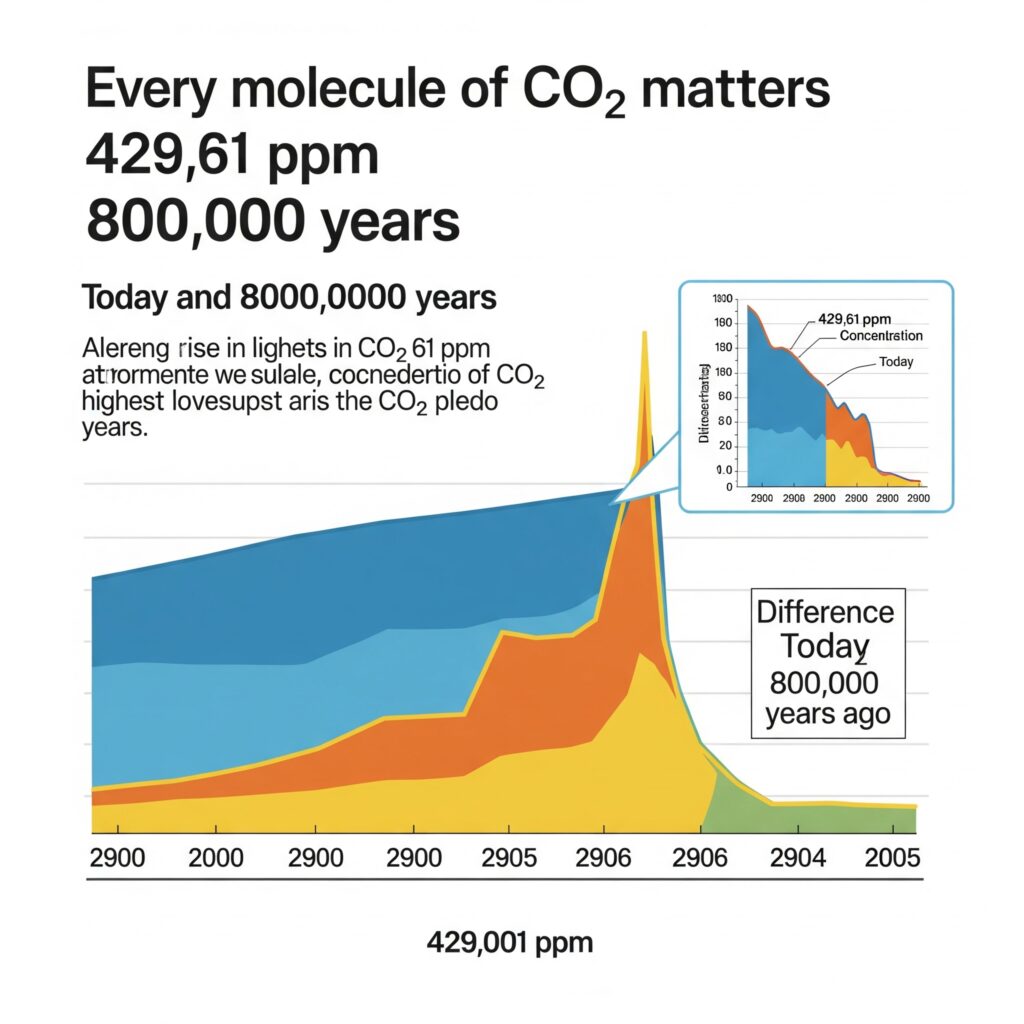
At its core, climate change is the long‑term shift in average weather patterns caused mainly by the accumulation of heat‑trapping gases in the atmosphere. Carbon dioxide (CO₂) is the headline molecule because it persists for centuries. NOAA’s Mauna Loa Observatory measured an average concentration of 429.61 ppm in June 2025, the highest in at least 800,000 years. Weekly data show levels staying above 428 ppm through mid‑July.
If those numbers feel abstract, NASA’s recent high‑resolution GEOS model animation makes them visceral by tracking CO₂ plumes in three dimensions over an entire year – reds swirling out of industrial belts, greens pulsing as forests inhale and exhale. The takeaway: every tonne emitted stays in circulation far longer than any of us will live, ratcheting the planetary thermostat upward.
2. Global Warming – From Numbers to Real‑World Heat

“Global warming” is the symptom most people feel: higher land and ocean temperatures. NASA’s global temperature series shows Earth is now about 1.5 °C warmer than the 1951‑1980 baseline. That may sound small, but a single degree globally translates into extremes locally: a 50 °C heat index in Delhi, record coral bleaching in the Caribbean, and shrinking Himalayan glaciers feeding the Ganga. Ocean heat content has climbed relentlessly since the 1950s, storing the energy that later fuels stronger cyclones.
Sea level follows suit. Satellite altimetry records reveal an accelerating rise, driven by melting ice sheets and thermal expansion. Meanwhile, September Arctic sea‑ice extent is contracting by 12.2 % per decade. Add in NASA’s GRACE data on hydrological extremes, and the pattern is clear: we have entered an age of “hydro‑climatic whiplash,” swinging from drought to flood with little warning.
3. Global & National Emissions Snapshot (2024 Data)
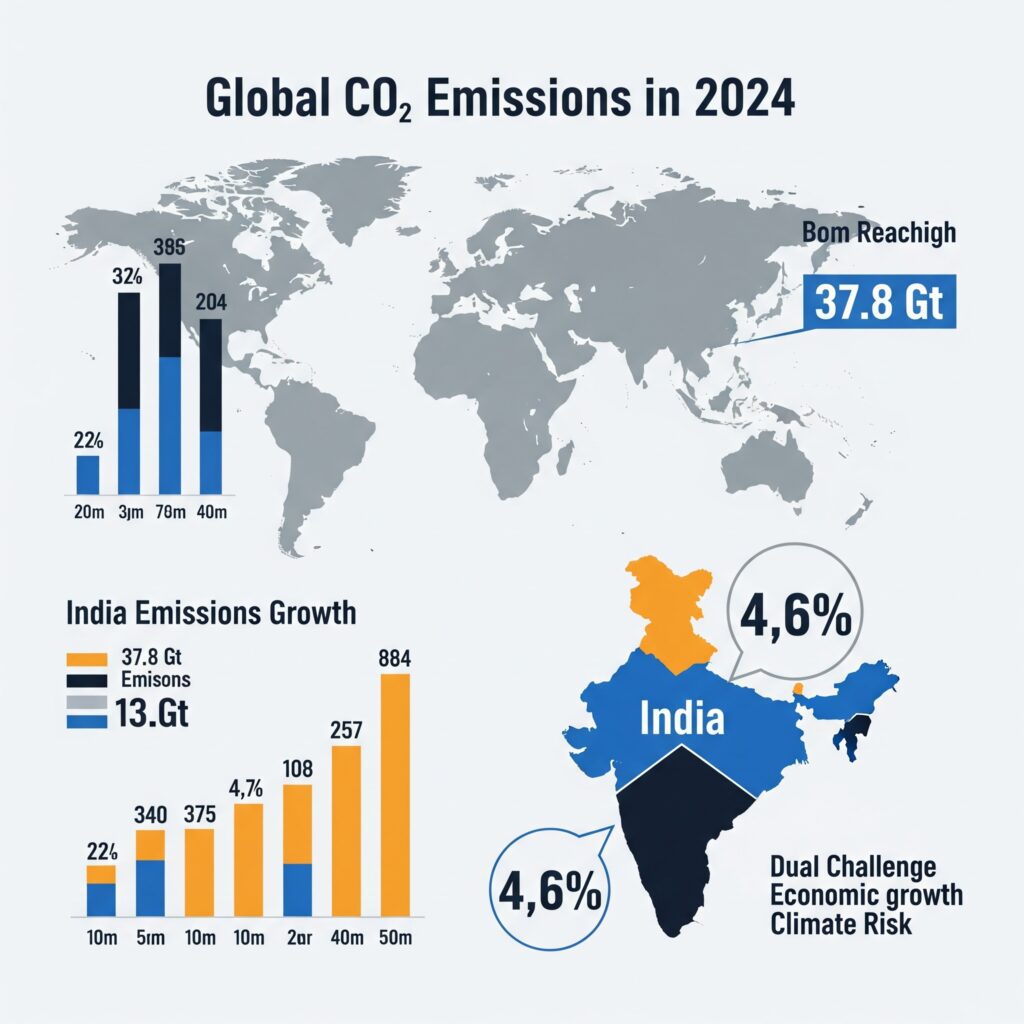
Energy‑related CO₂ emissions hit 37.8 Gt in 2024 – an 0.8 % rise and another all‑time high according to the IEA’s Global Energy Review 2025. The Global Carbon Project puts total fossil‑fuel CO₂ at 41.2 Gt, noting record wildfire contributions.
-China & USA still account for 45 % of fuel‑combustion CO₂, but India’s emissions grew 4.6 % in 2024, reflecting rapid power and transport demand.
-The EU and US declined slightly, proving that decoupling is possible but not yet fast enough.
India’s absolute energy‑sector CO₂ is now roughly 2.6 Gt CO₂‑eq, fourth globally, with coal still dominant but solar posting record additions. For Indian businesses, this duality – growth plus rising climate risk – frames every supply‑chain and investment decision.
4. The Paris Agreement – A Living Framework
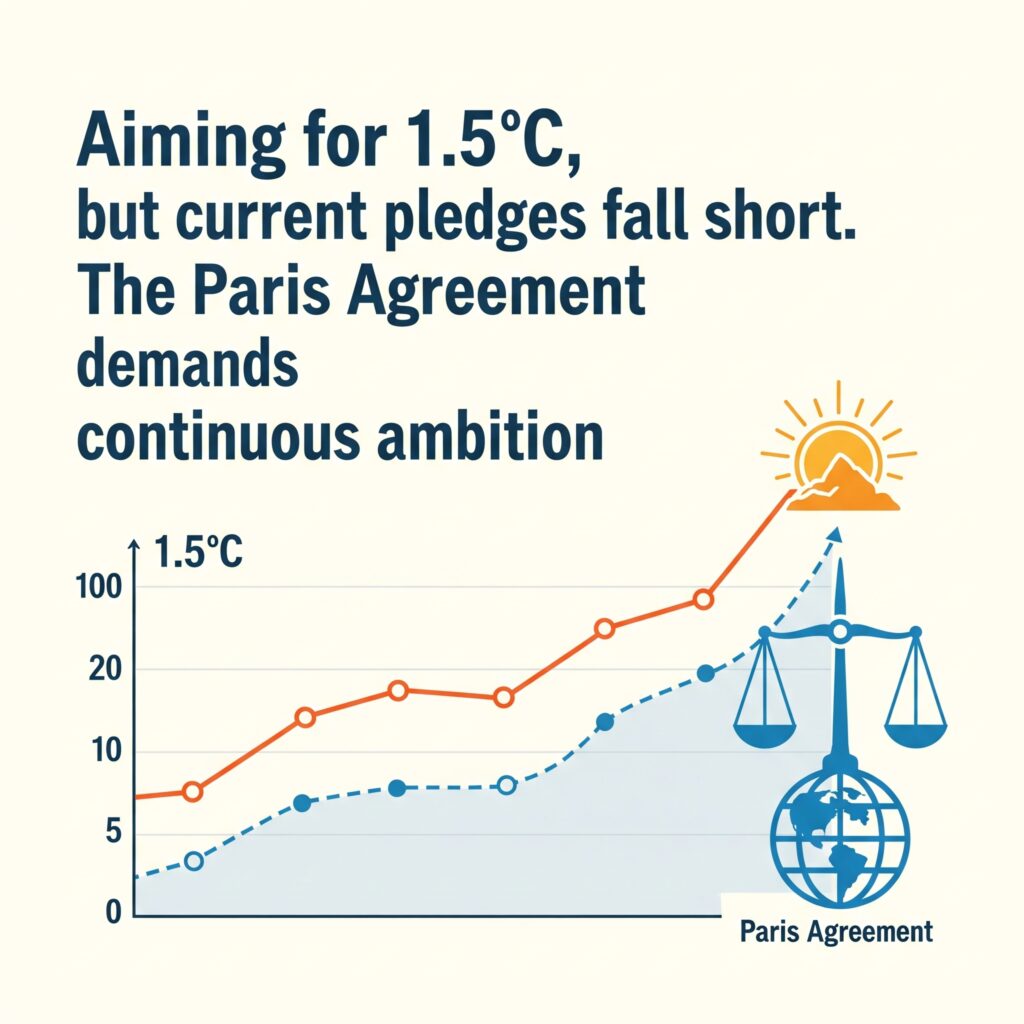
Signed in 2015, the Paris Agreement’s central aim is to hold warming “well below 2 °C” and ideally to 1.5 °C. Virtually every nation is a Party, meaning nearly 100 % of global GDP is covered. Yet UNEP’s emissions‑gap assessments show current pledges point toward ~2.5‑2.7 °C this century, even if fully implemented. The Agreement’s strength lies in its five‑year ambition cycle: each round of Nationally Determined Contributions (NDCs) must enhance or expand previous targets.
5. NDC & LT‑LEDS – Roadmaps, Not Wish‑Lists
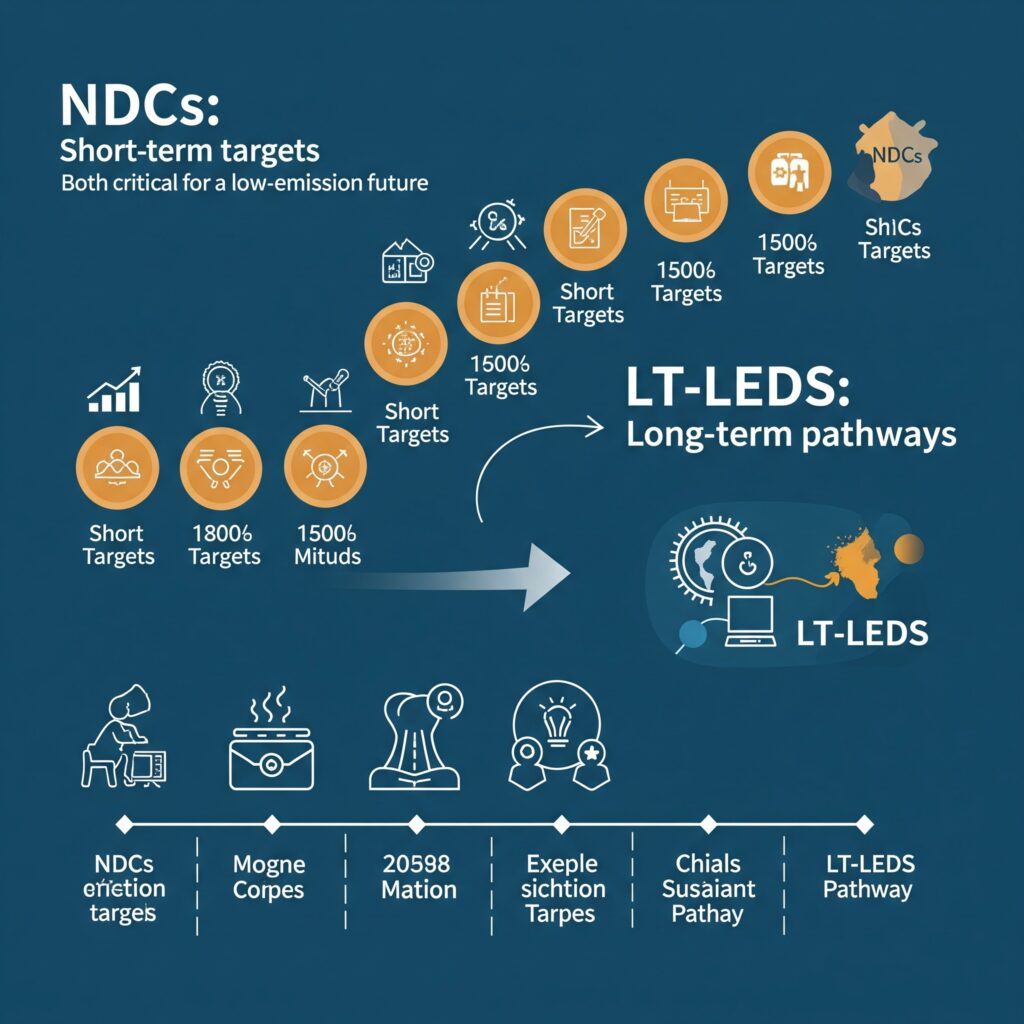
NDCs set short‑ to mid‑term (5‑ to 10‑year) targets; Long‑Term Low‑Emission Development Strategies (LT‑LEDS) sketch pathways to mid‑century neutrality. As of September 2024, the UNFCCC had logged 168 latest NDCs covering 95 % of 2019 emissions. Since then, more updates have trickled in and the secretariat reminds Parties that “NDC 3.0” submissions are due by the end of 2025, shaped by the first global stock‑take.
On LT‑LEDS, 78 Parties (including big emitters like China, the EU, the US and most recently Peru and Equatorial Guinea) have tabled strategies as of June 2025. While these plans vary in detail, they give investors signals about future carbon pricing and renewable‑energy opportunities.
6. IPCC’s National Accounting Approach – Getting the Numbers Right
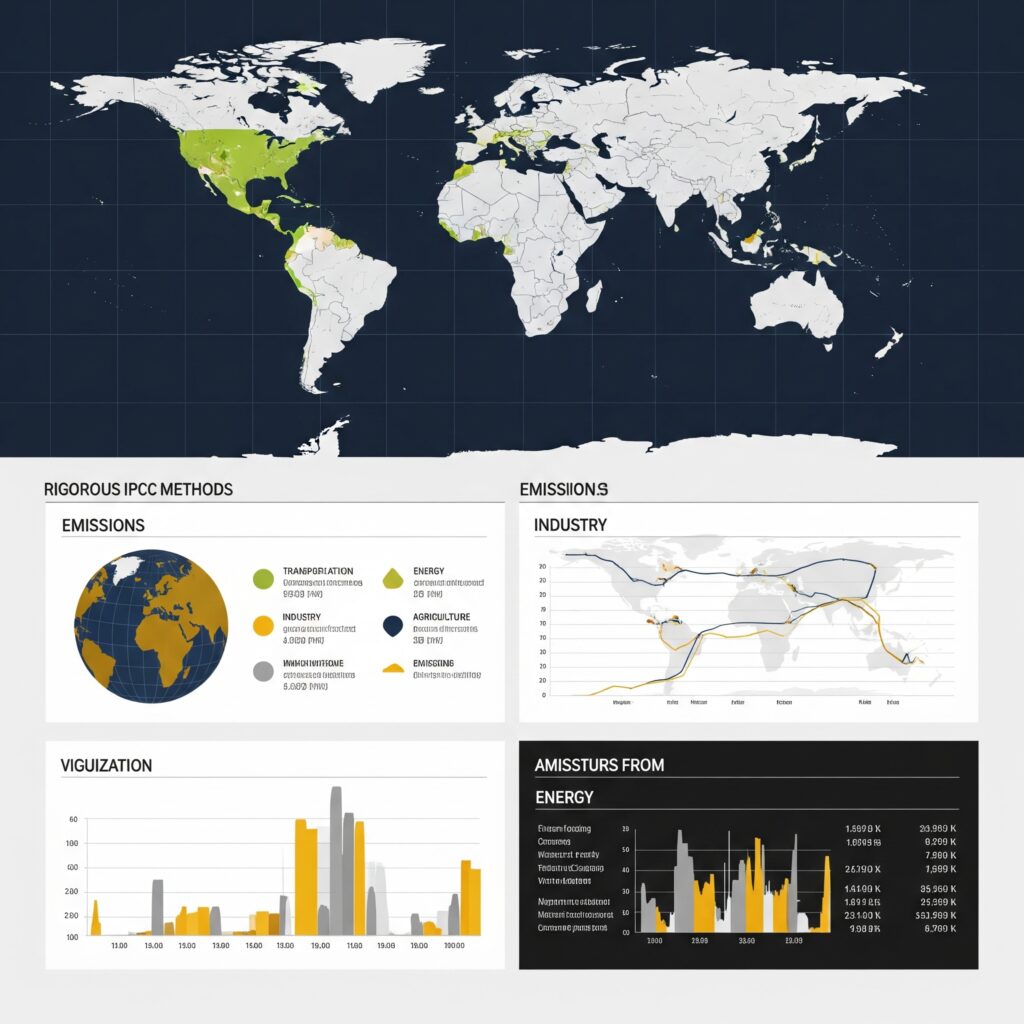
Behind every headline figure is a rigorous methodology. The IPCC’s 2006 Guidelines (refined in 2019) provide the default framework for national greenhouse‑gas inventories, defining sectors, gases, tiers of complexity and default emission factors. Inventory agencies must:
-
Cover all gases: CO₂, CH₄, N₂O and fluorinated gases.
-
Avoid double counting between sectors (e.g., land‑use and energy).
-
Continuously improve accuracy through higher‑tier methods as data allow.
This “national accounting” may sound bureaucratic, but without it we would not know whether climate actions are real or merely press releases.
7. Greenhouse Gases – The Official Classification
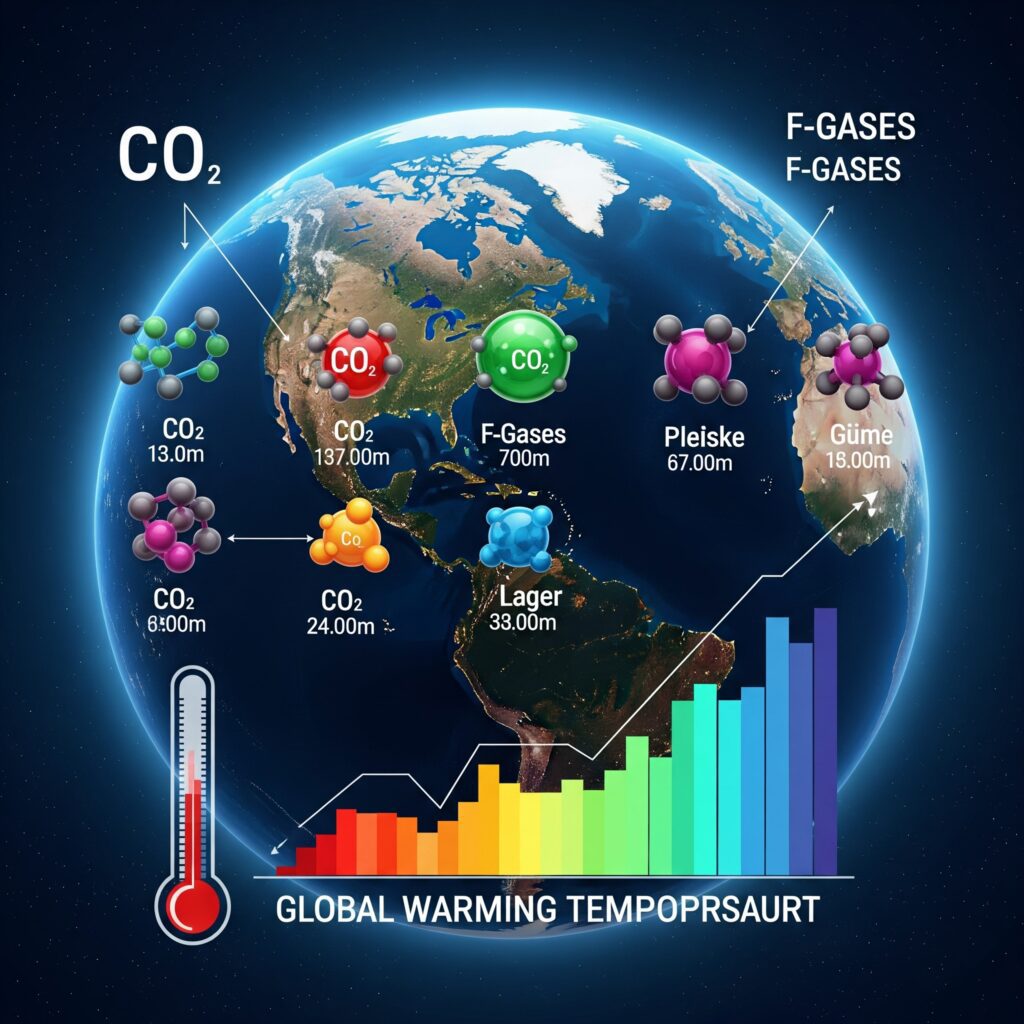
The IPCC groups heat‑trapping gases into four principal buckets:
-Carbon dioxide (CO₂) – fossil fuel combustion, cement, land‑use change.
-Methane (CH₄) – agriculture, fossil‑gas leaks, waste.
-Nitrous oxide (N₂O) – fertiliser use, industrial processes.
-Fluorinated gases (HFCs, PFCs, SF₆, NF₃) – refrigerants, electronics.
Between 1990 and 2019, CO₂ from fossil fuels grew 67 %, CH₄ 29 %, N₂O 33 %, while F‑gases skyrocketed 254 % albeit from a small base. Each gas has a “global warming potential” expressing its heat‑trapping punch over 100 years; SF₆, for instance, is over 23,000 times stronger than CO₂.
8. Evidence of Climate Change – The Smoking Gun(s)
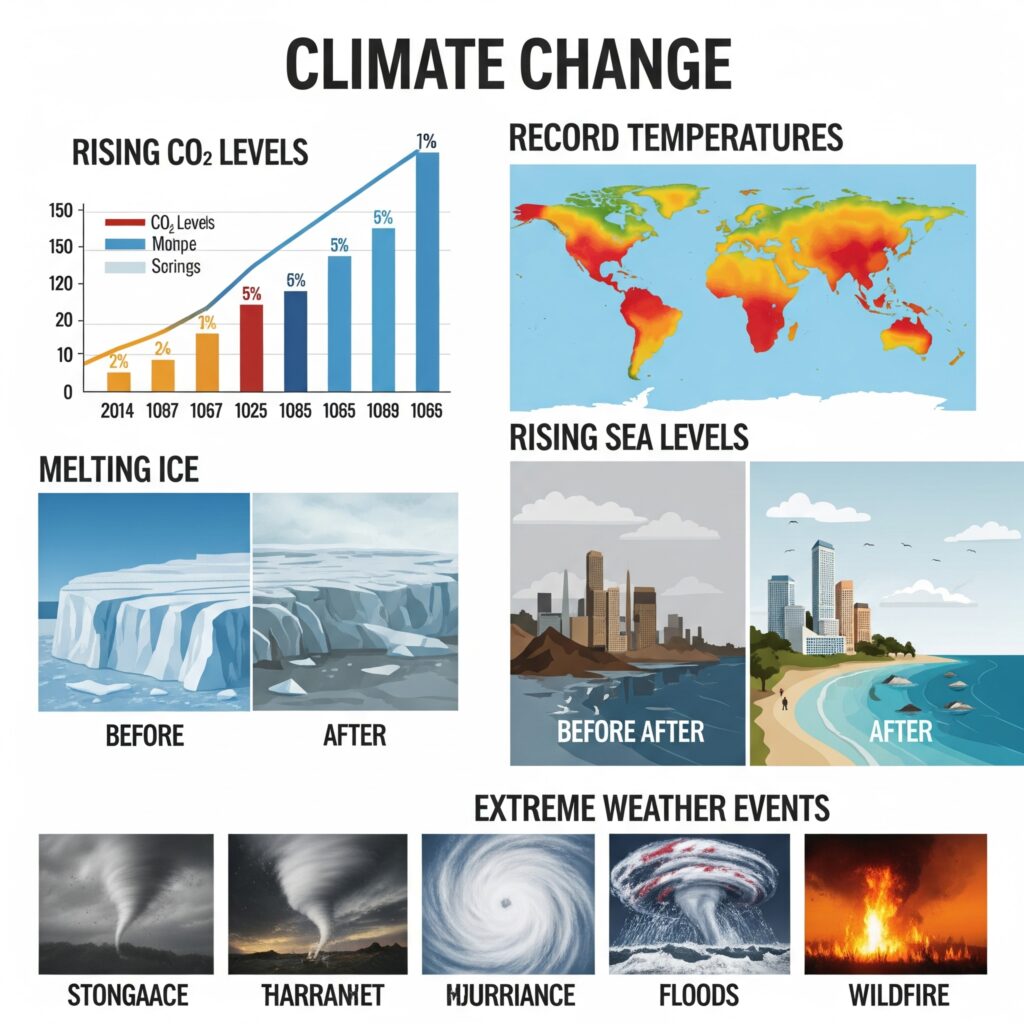
Multiple, independent lines of observation converge:
-Atmosphere – CO₂ now above 429 ppm; methane > 1,900 ppb.
-Temperature – 2024 became the hottest year on record, with every month since June 2023 exceeding the 1.5 °C threshold briefly.
-Cryosphere – Arctic summer ice retreating 12 % per decade; Greenland and Antarctica losing mass at accelerating rates.
-Sea level – Rising faster than at any period in the last 2,500 years.
-Extreme weather – NASA’s GRACE data show a doubling in the frequency of severe drought‑flood swings in the last five years.
Together, these datasets demolish the notion that recent warming is “natural variability.”
9. Status of NDC Submissions (July 2025)
Despite a UN deadline earlier this year, only about a dozen Parties accounting for 16.2 % of global emissions met the cut‑off, prompting the secretariat to prioritise quality over speed. Monaco’s fresh 2025 NDC arrived on 16 July, illustrating how updates are still landing almost weekly. Analysts expect a late‑2025 surge as major economies finalize their post‑stock‑take targets; whether ambition rises fast enough is the make‑or‑break question heading into COP 31.
Conclusion – What Comes Next?
The science leaves no doubt: the physical climate system is changing in lock‑step with rising greenhouse‑gas concentrations. Policy instruments like the Paris Agreement, NDCs and LT‑LEDS provide a governance scaffold, but their effectiveness hinges on honest accounting and rapid implementation.
For businesses operating in India and beyond, the direction of travel is clear: carbon‑intensive growth strategies face mounting physical and regulatory risks, while low‑carbon solutions unlock growing markets and capital flows. The companies that align now – auditing supply‑chain emissions, investing in renewables, backing nature‑based solutions – will be the ones still competitive when the next round of NDCs tightens the screws.
Stay tuned: the next 18 months, culminating in NDC 3.0, will set the trajectory for global emissions through 2035. Whether we write a story of managed transition or chaotic disruption depends on choices being made today.
About Anaxee:
Anaxee is India’s Reach Engine! we are building India’s largest last-mile outreach network of 100,000 Digital Runners (shared feet-on-street, tech-enabled) to help Businesses and Social Organizations scale to rural and semi-urban India, We operate in 26 states, 540+ districts, and 11,000+ pin codes in India.
We Help in last-mile execution of projects for (1) Corporates, (2) Agri-focused companies, (3) Climate, and (4) Social organizations. Using technology and people on-the-ground (our Digital Runners), we help in scale and execute projects across 100s of cities and bring 100% transparency in groundwork. We also work in the Tech for Climate domain, providing technology for the execution and monitoring of Nature-Based (NbS) and Community projects. Our technology & processes bring transparency and integrity into carbon projects across various methodologies (Agroforestry, Regen Agriculture, Solar devices, Improved Cookstoves, Water filters, LED lamps, etc.) worldwide.
For More info or query, Connect with sales@anaxee-wp-aug25-wordpress.dock.anaxee.com
Sources:
-
NOAA Global Monitoring Laboratory NOAA Global Monitoring Laboratory – “Monthly Average Mauna Loa CO₂,” last updated 14 Jul 2025.
-
NASA Scientific Visualization Studio NASA Scientific Visualization Studio – “Visualizing Global CO₂ with the GEOS Model,” 2024.
-
NASA NASA – “Temperatures Rising: 2024 Warmest Year on Record,” press release, Jan 2025.
-
IEA Blob Storage International Energy Agency – Global Energy Review 2025 (PDF), Mar 2025.
-
Global Carbon Budget Global Carbon Project – “Fossil‑Fuel CO₂ Emissions Increase Again in 2024,” 13 Nov 2024.
-
UNFCCC UNFCCC – 2024 NDC Synthesis Report (covers 168 latest NDCs), Sep 2024.
-
UNFCCC UNFCCC – “Long‑Term Low‑Emission Development Strategies Portal,” accessed 17 Jul 2025.
-
ipcc-nggip.iges.or.jp IPCC TFI – 2019 Refinement to the 2006 Guidelines for National GHG Inventories.
-
National Snow and Ice Data Center National Snow & Ice Data Center – “September Arctic Sea‑Ice Extent Decline of 12.2 % per Decade,” Oct 2024.
-
GRACE Tellus NASA GRACE Tellus – “Water‑Cycle Extremes: Droughts and Pluvials,” 2023.
-
The Times of India Times of India – “NASA Data Warns of Surge in Extreme Weather Events,” 17 Jun 2025.

