IETA VCM Guidelines 2.0 Explained: High-Integrity Carbon Credits & Anaxee’s Role
Introduction
The world is racing against time. The Intergovernmental Panel on Climate Change (IPCC) has made it painfully clear: global emissions must peak immediately and almost halve by 2030 to keep the 1.5°C target alive. Yet, corporate climate action is not keeping pace. Many companies either lack credible net zero targets or are falling behind on their commitments.
In this landscape, the Voluntary Carbon Market (VCM) plays a critical role. It offers companies a flexible, cost-effective pathway to complement internal decarbonisation with credible climate action. But trust in the VCM has been shaken by concerns over quality, transparency, and inconsistent standards. That’s why the International Emissions Trading Association (IETA) released the updated VCM Guidelines 2.0 in September 2025.
These guidelines set out a roadmap for high-integrity use of verified carbon credits (VCCs)—ensuring that offsets go beyond being just “carbon accounting tools” and instead become powerful levers for real climate impact.
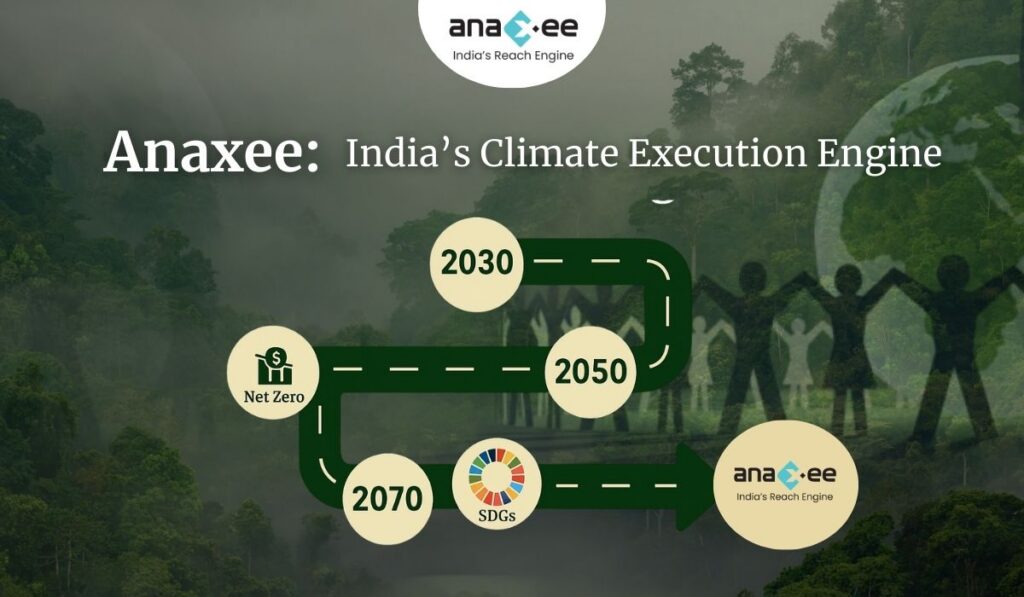
For India, where carbon markets are still evolving and the government is piloting mechanisms like the Carbon Credit Trading Scheme (CCTS), aligning with international integrity standards is crucial. And this is where Anaxee Digital Runners Pvt. Ltd. steps in—as India’s climate execution engine, ensuring that global principles of integrity translate into real action on the ground.
Section 1: The State of the Voluntary Carbon Market
The VCM has grown into a multi-billion-dollar ecosystem. By allowing companies to buy Verified Carbon Credits (VCCs) from projects that reduce or remove emissions, it creates a financial channel to scale climate solutions, from afforestation to renewable energy.
But after peaking in 2021, voluntary retirements of carbon credits stagnated. Several reasons explain this slowdown:
-Reputational risks: Companies fear being accused of “greenwashing” if their credit purchases are seen as low-quality or tokenistic.
-Quality concerns: Not all carbon credits are equal. Some projects failed to deliver the promised climate benefits.
-Regulatory uncertainty: Different frameworks—VCMI, ICVCM, SBTi, ISO—provide overlapping but inconsistent guidance.
-Market complexity: With multiple registries, methodologies, and rules, corporates face confusion about what counts as “credible” action.
Yet, demand for high-quality carbon credits remains essential. According to IETA’s modelling, international carbon markets could cut global mitigation costs by up to 32%. And for countries like India, carbon markets can unlock vital climate finance to support communities, smallholder farmers, and nature-based solutions.
The IETA Guidelines 2.0 are designed to address these bottlenecks and restore trust.
Section 2: What Are the IETA VCM Guidelines 2.0?
IETA first launched its high-integrity guidelines in April 2024. Version 2.0, released in September 2025, builds on feedback from corporates, governments, and independent initiatives. The goal: create clear, pragmatic rules for companies that want to integrate carbon credits into their net zero strategies without losing credibility.
The guidelines outline seven pillars of integrity:
Demonstrate support for the Paris Agreement goals – Companies must set science-based targets aligned with 1.5°C.
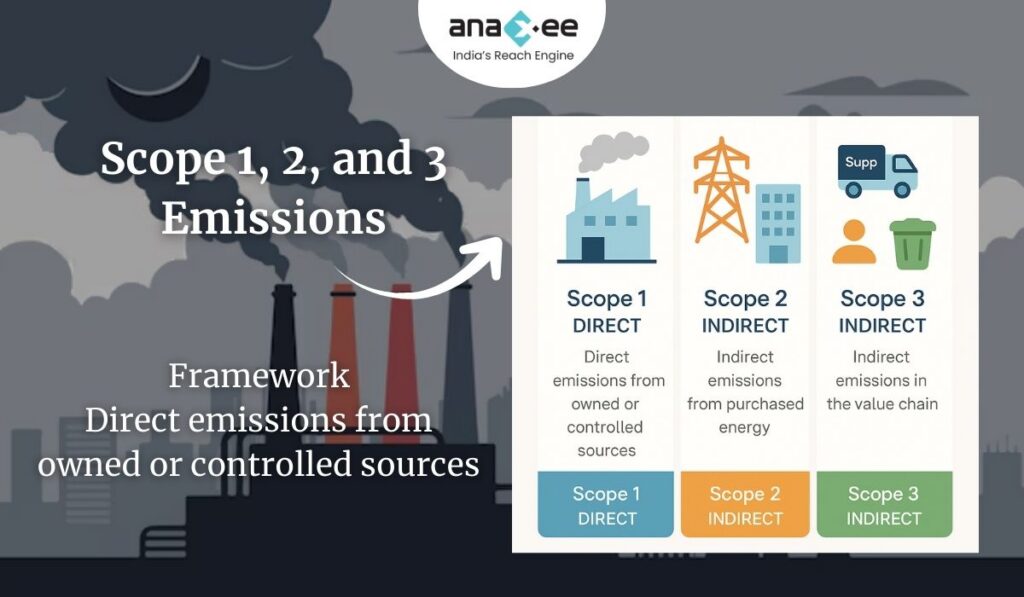
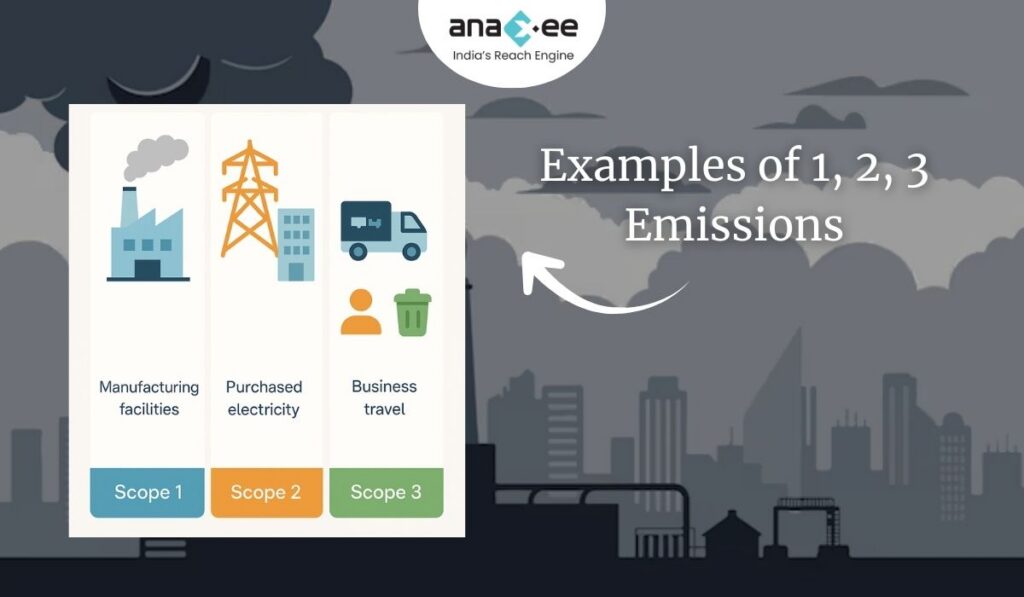
Quantify and disclose Scope 1, 2, and 3 emissions – No shortcuts. Transparency is non-negotiable.
Establish a net zero pathway and near-term targets – Companies must show measurable interim steps, not vague 2050 promises.
Use VCCs in line with the mitigation hierarchy – Prioritise internal reductions first, use credits only for what cannot be abated.
Ensure only high-quality credits are used – Credits must be additional, verifiable, permanent, and issued by credible standards.
Transparent accounting and disclosure – Report gross vs. net emissions, credit vintages, registries, and methodologies used.
Make robust and credible claims – Companies must avoid misleading labels like “carbon neutral” unless they meet strict conditions.
This framework sends a strong message: carbon credits are not excuses; they are enablers of ambitious decarbonisation.
Section 3: Why High-Integrity Use Matters
The credibility of the VCM hinges on integrity. When companies misuse credits—buying cheap offsets while continuing business-as-usual emissions—they undermine trust in the entire system.
This has real consequences:
-NGOs and watchdogs accuse corporates of greenwashing.
-Regulators consider tightening rules, adding compliance risks.
-Investors lose confidence in ESG disclosures.
-Genuine climate finance flows to vulnerable regions slow down.
High-integrity use ensures that:
-Every credit corresponds to a real, measurable emission reduction or removal.
-Companies are transparent about how credits fit into their climate strategy.
-VCM finance actually accelerates global net zero, instead of being a distraction.
IETA’s Guidelines are therefore as much about protecting corporate reputations as they are about protecting the climate.
Section 4: Corporate Use Cases of VCCs
One of the strengths of the IETA Guidelines 2.0 is their recognition of multiple legitimate use cases for carbon credits. Instead of seeing credits only as end-of-pipe offsets, the guidelines outline broader roles:
Meeting Interim Targets – Companies can use credits to stay accountable in the 2020s and 2030s, while technology solutions scale up.
Staying on Track – If a company falls behind its science-based trajectory, credits can bridge the gap temporarily.
Insetting – Credits generated within a company’s supply chain (e.g., regenerative agriculture projects) to cut Scope 3 emissions.
Counterbalancing Residual Emissions – At net zero, credits are vital to address unavoidable emissions.
Addressing Historical Emissions – Ambitious companies can go further by compensating for their legacy impact.
Going Beyond Net Zero – Contributing extra credits to accelerate global decarbonisation.
This flexible approach makes credits not just compliance tools, but strategic assets for companies that want to demonstrate climate leadership.
Section 5: VCC Quality and Risk Management
Not all credits are created equal. IETA emphasizes strict quality filters:
-Additionality – Projects must deliver emission reductions that wouldn’t have happened otherwise.
-Permanence – Risks of reversal (e.g., forest fires) must be managed via buffers or insurance.
-Verification – Independent auditors must validate methodologies and outcomes.
-Transparency – Project details, vintages, and retirement records must be public.
Emerging tools to support quality include:
-ICVCM’s Core Carbon Principles (CCPs)
-Carbon rating agencies (CRAs) like Sylvera and BeZero
-Carbon insurance products to mitigate project failure risks
The message is clear: a credit with integrity is an investment in climate stability; a poor-quality credit is a liability.
Section 6: Policy & Market Convergence
Carbon markets are no longer siloed. Voluntary and compliance frameworks are converging:
-Under Article 6 of the Paris Agreement, countries can use VCCs to meet their Nationally Determined Contributions (NDCs).
-Domestic markets (California ETS, Singapore carbon tax, China ETS) already allow limited use of credits.
-India’s Carbon Credit Trading Scheme (CCTS) is preparing to integrate credits into regulated trading.
For corporates, this convergence means two things:
Credits used voluntarily today may soon count under compliance.
Regulatory scrutiny on claims will only increase.
Aligning with IETA’s guidelines now helps companies future-proof their climate strategies.
Section 7: What This Means for India
India is at the center of the climate-finance equation. As a fast-growing economy and one of the world’s largest emitters, India must decarbonise without stalling development.
The VCM offers three major opportunities for India:
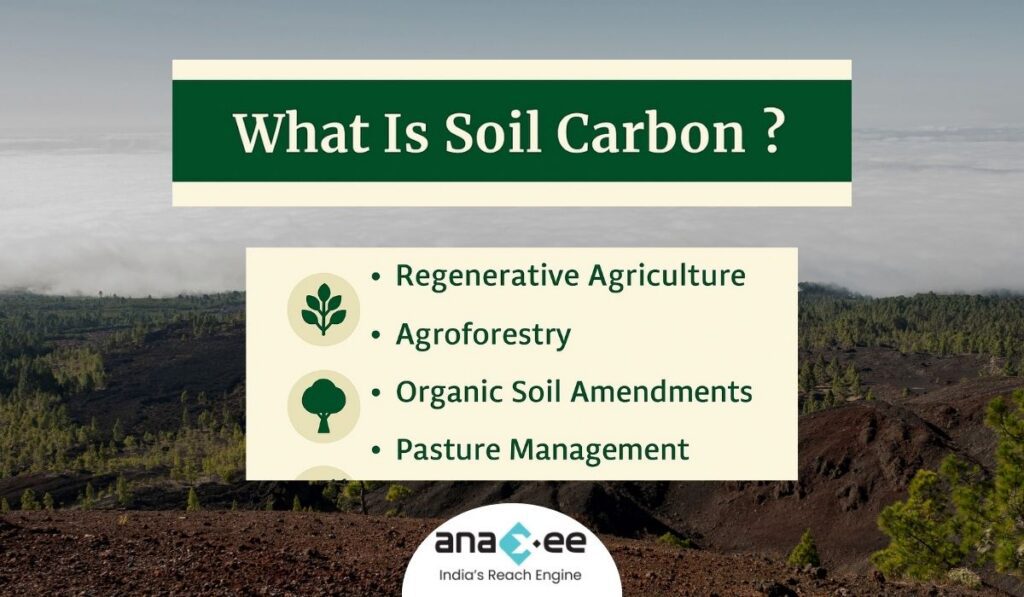
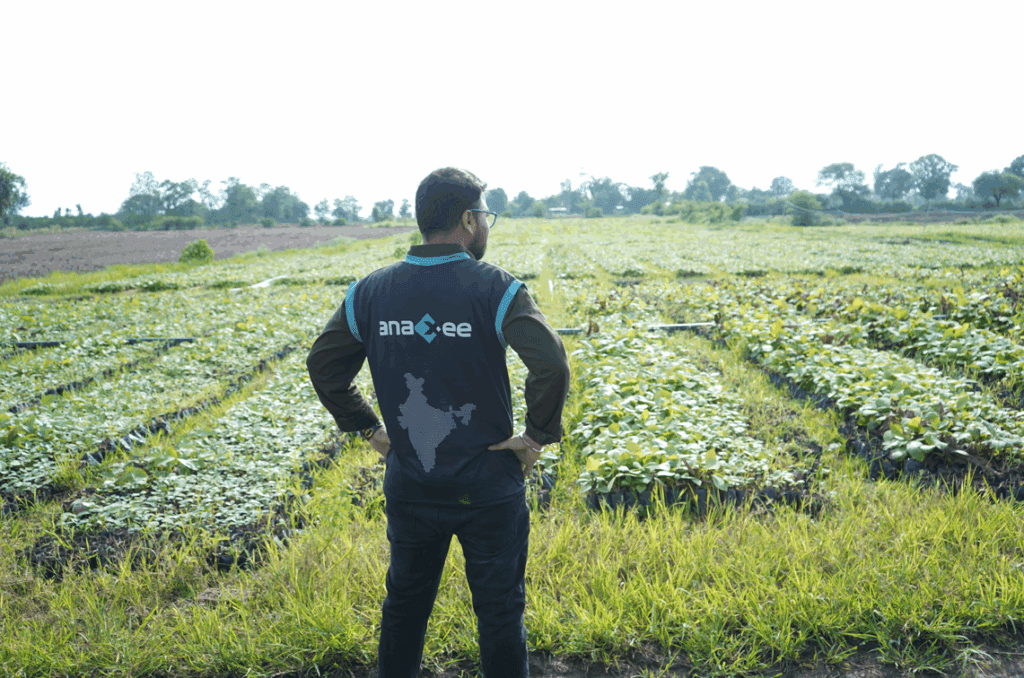
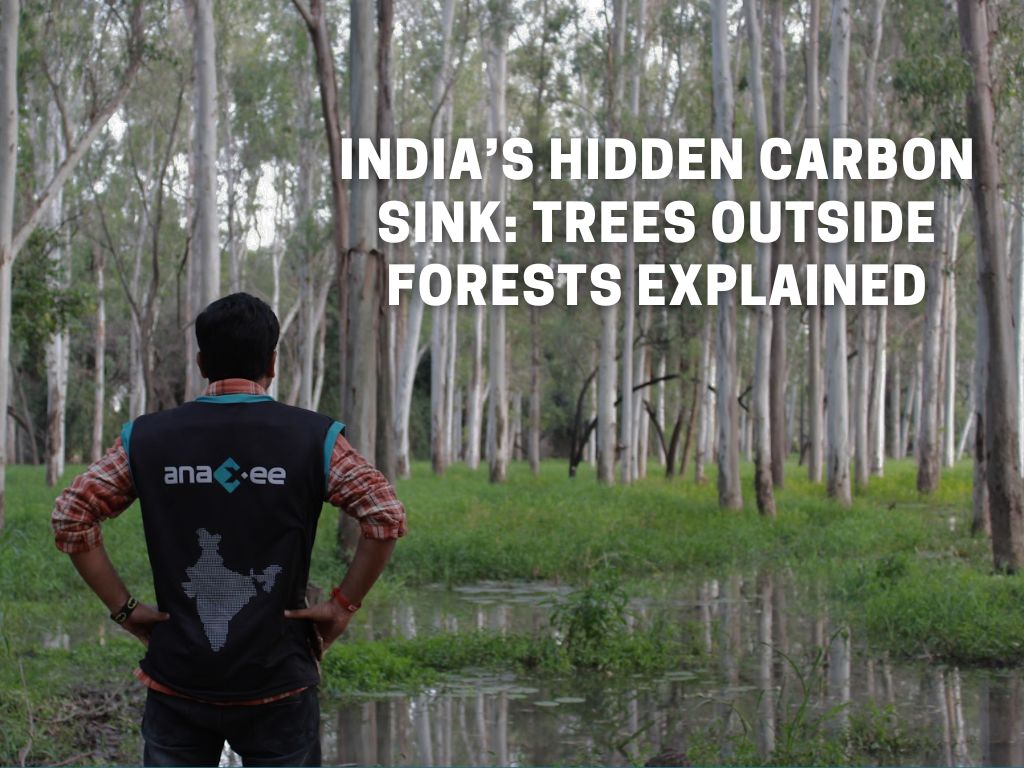
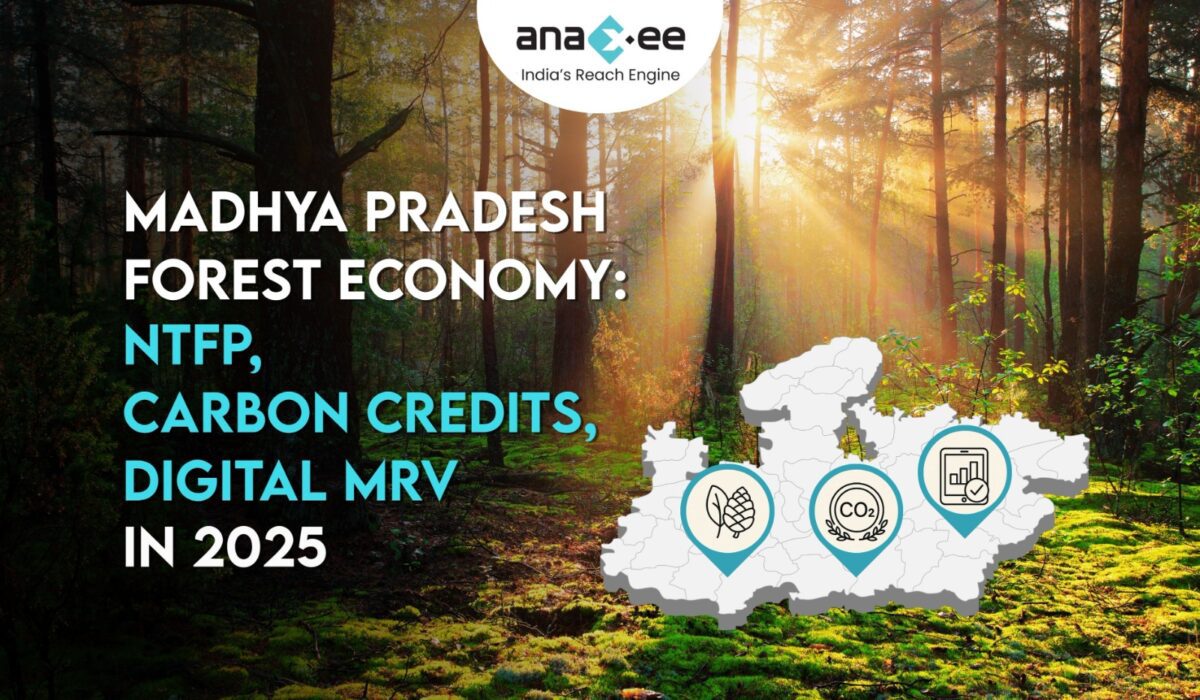
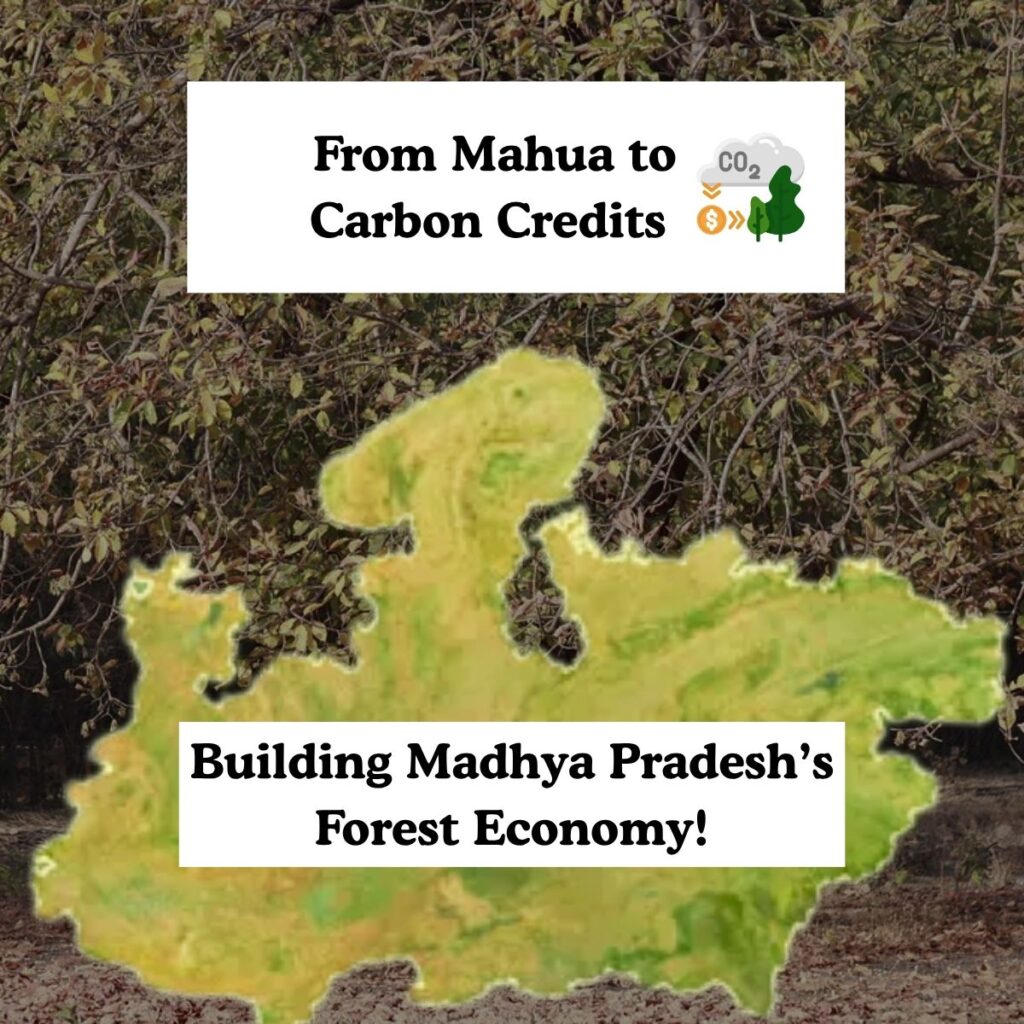
-Channel private finance into nature-based solutions (NbS) like agroforestry, mangroves, and soil carbon.
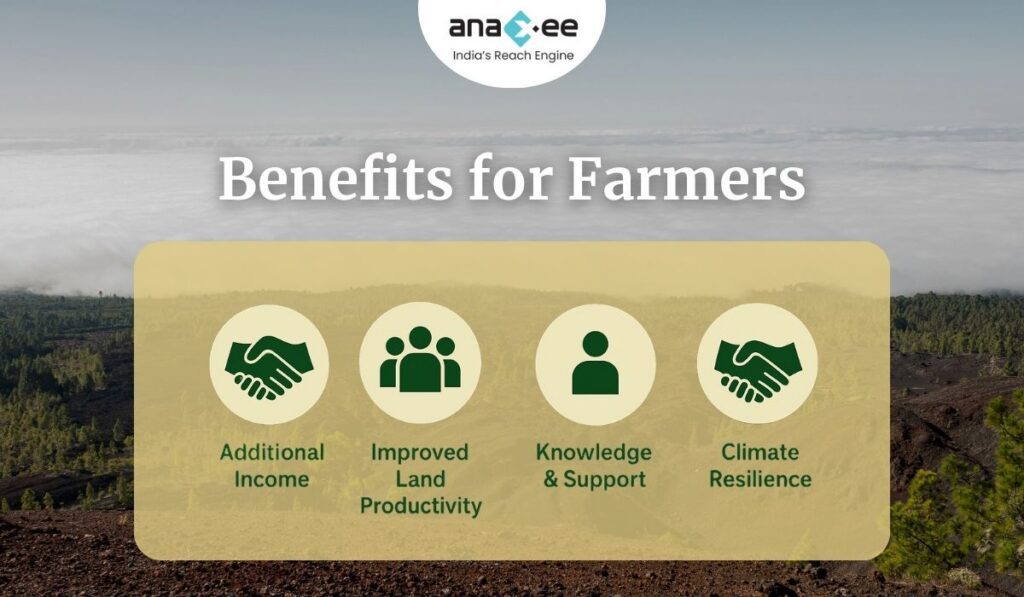
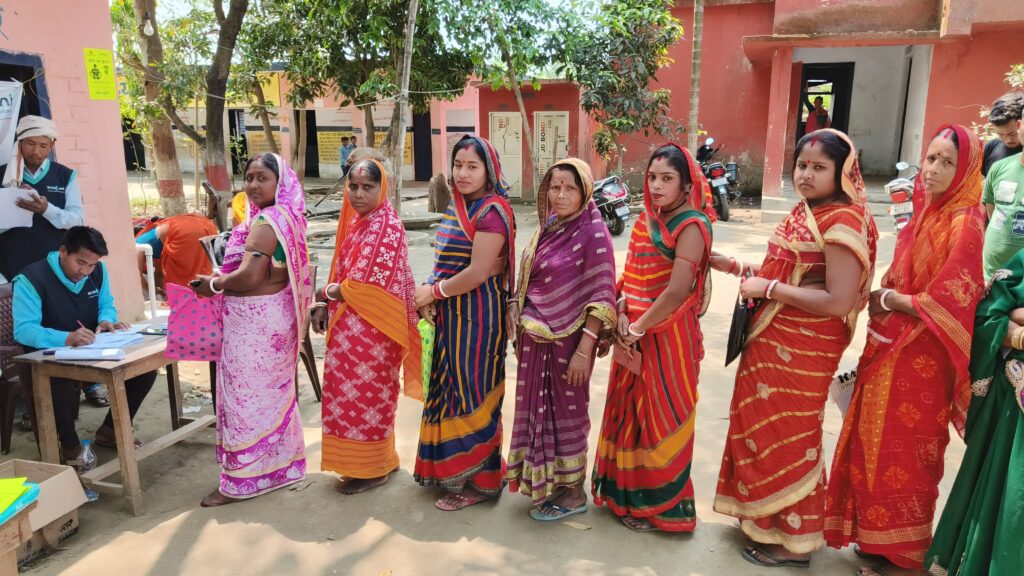
-Support smallholder farmers and rural communities by making them stakeholders in carbon markets.
-Position Indian corporates to meet global supply chain expectations around net zero and Scope 3 accounting.
But to tap this opportunity, integrity is non-negotiable. Projects must avoid leakage, ensure permanence, and deliver verifiable co-benefits. That’s where local execution capacity becomes critical.
Section 8: Anaxee’s Value in This Context
For international buyers and Indian corporates, the biggest question is: who will ensure integrity on the ground?
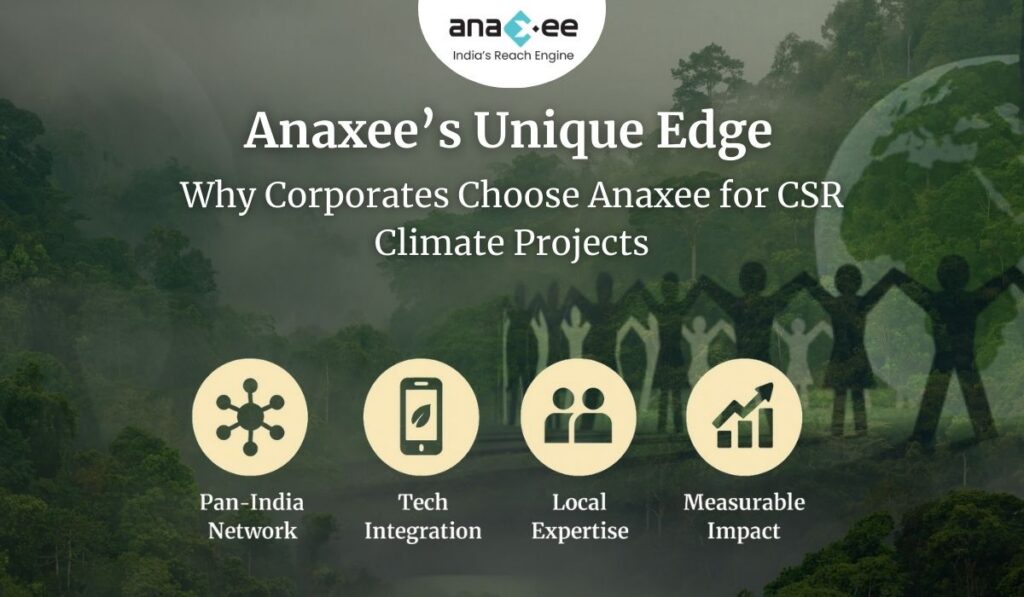
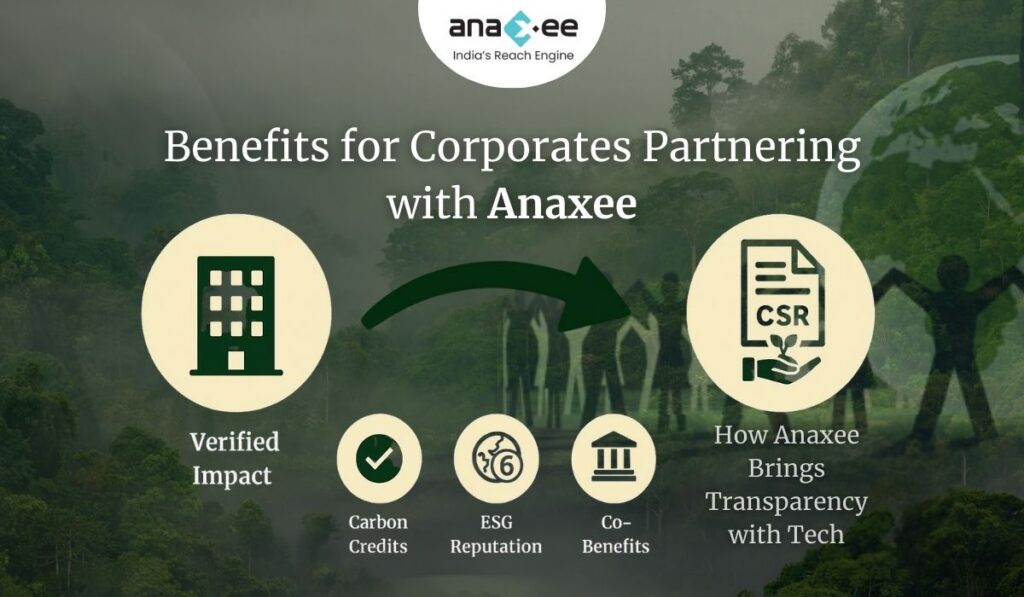
This is where Anaxee Digital Runners Pvt. Ltd. adds unique value:
Execution Engine at Scale
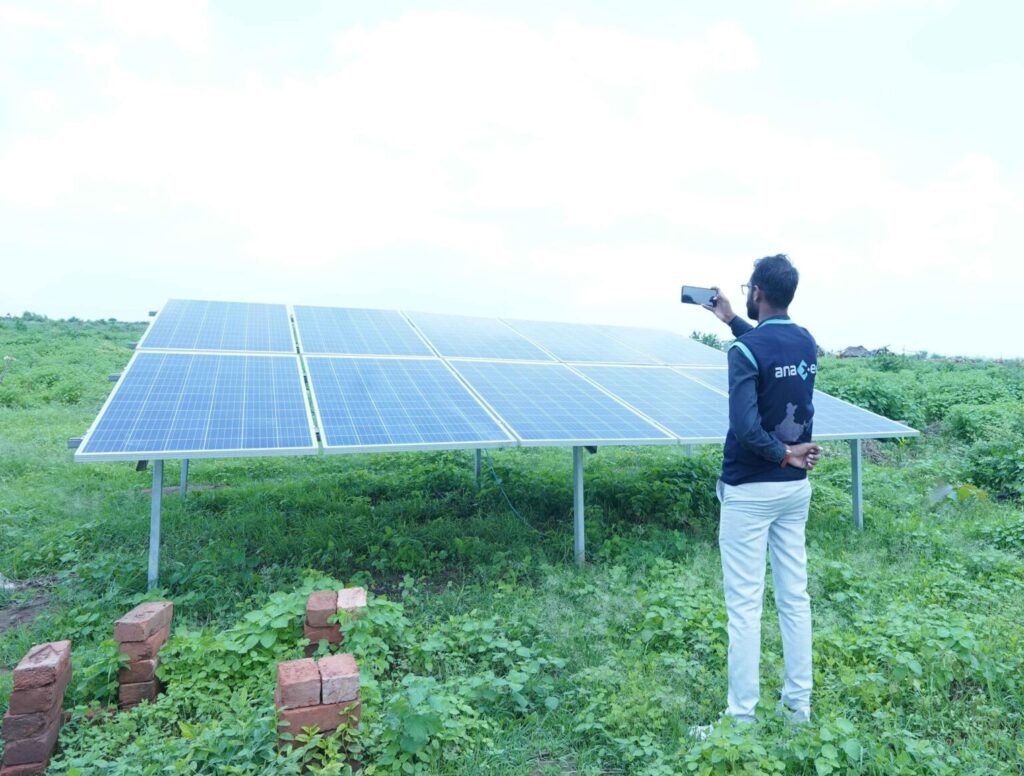
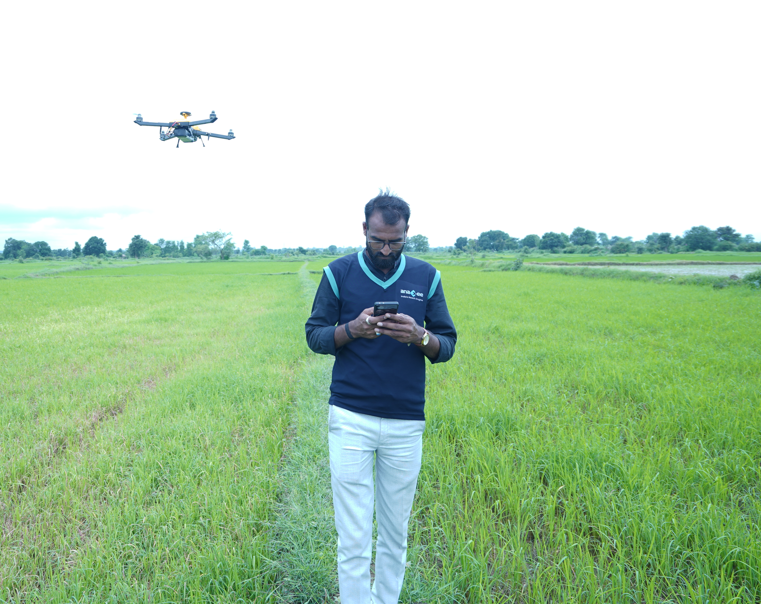
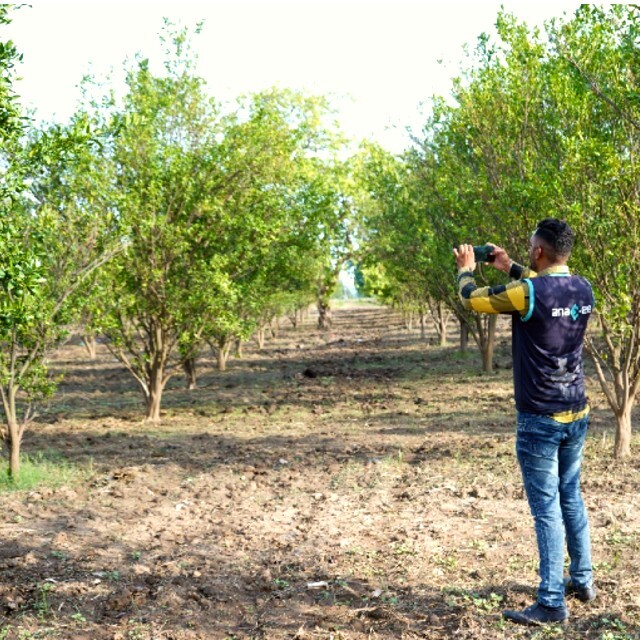
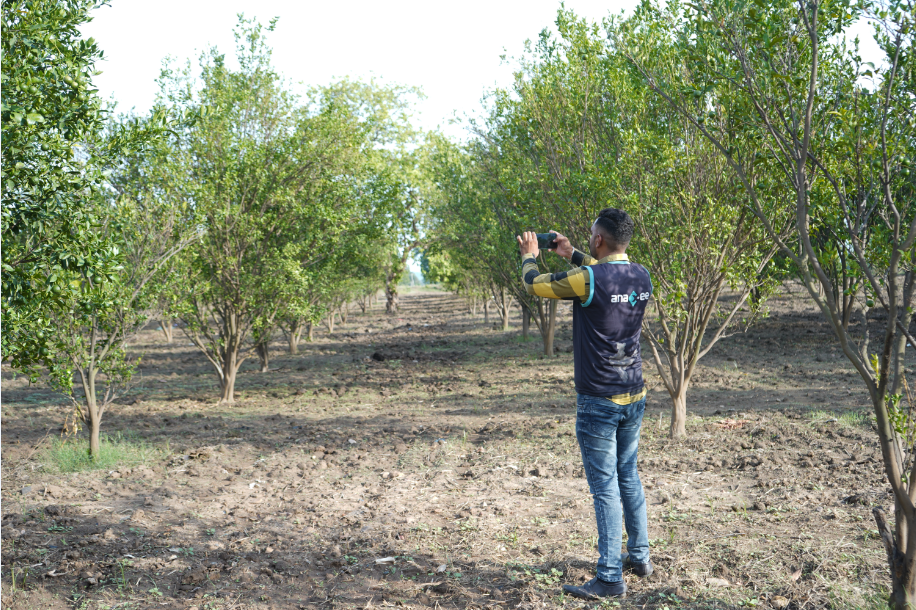
-With 125+ professionals and a network of 40,000+ Digital Runners, Anaxee can implement and monitor projects across India’s villages and farmlands.
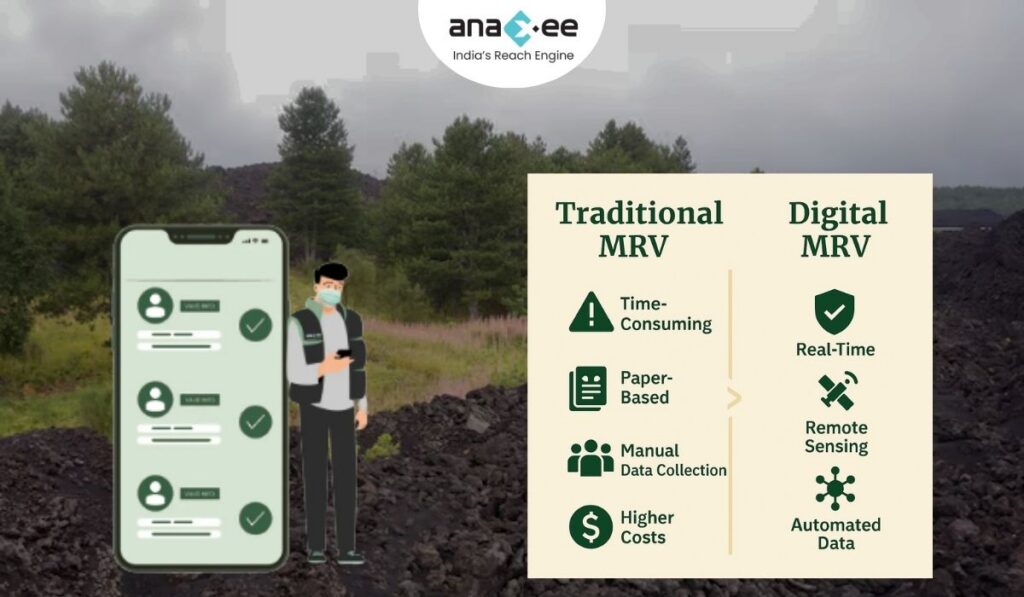
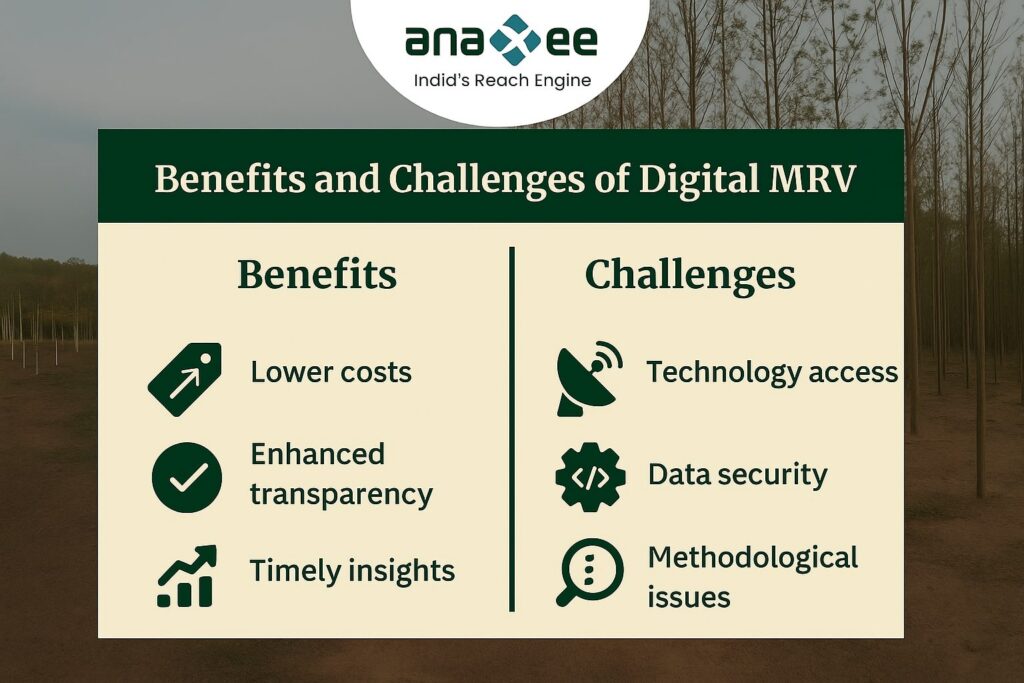
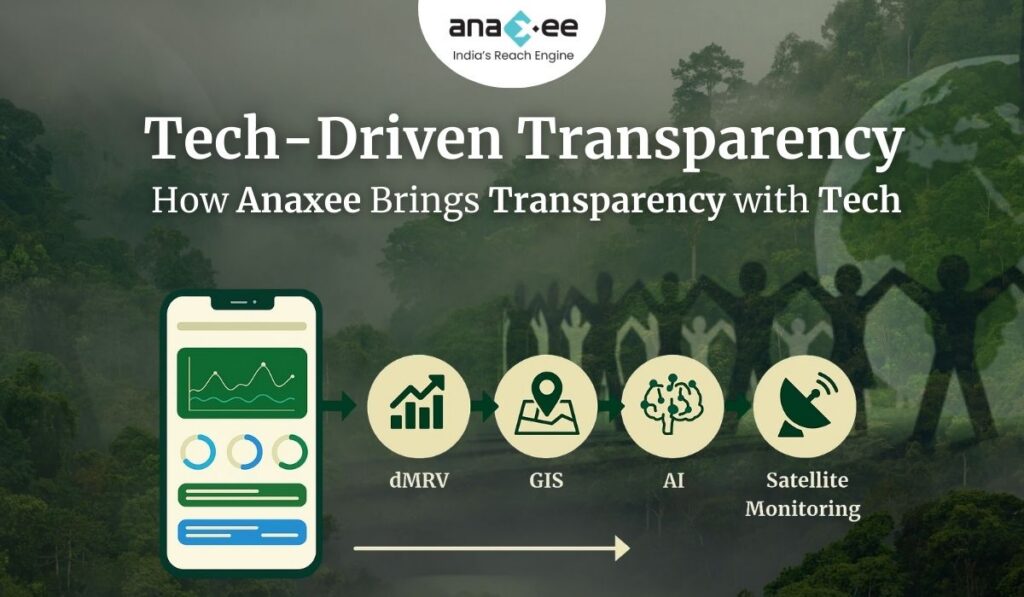
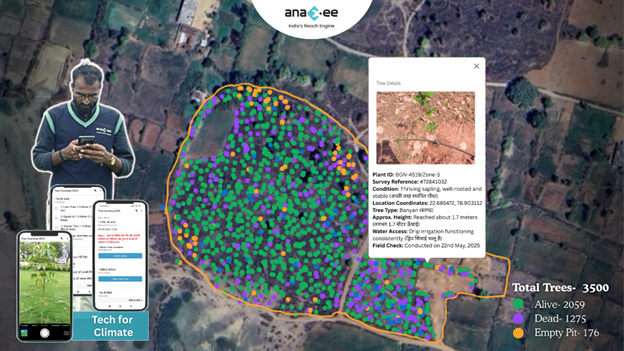
-This local capacity solves the biggest bottleneck: execution.dMRV & Transparency Tools
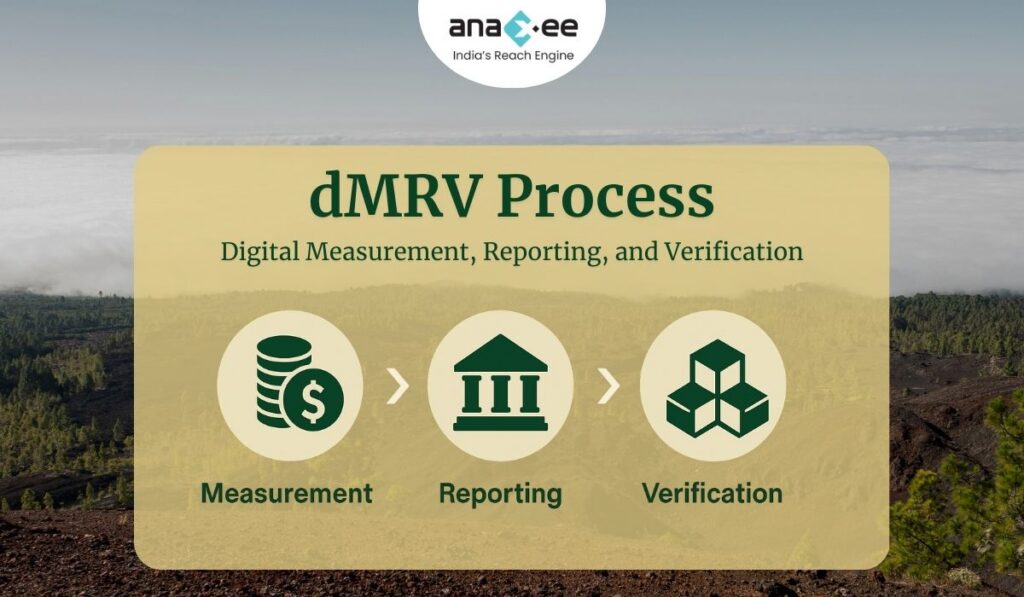
-Anaxee integrates satellite monitoring, AI-driven analytics, and mobile-based data collection.
-This ensures census-level verification, making every credit auditable, transparent, and trustworthy.Community Engagement
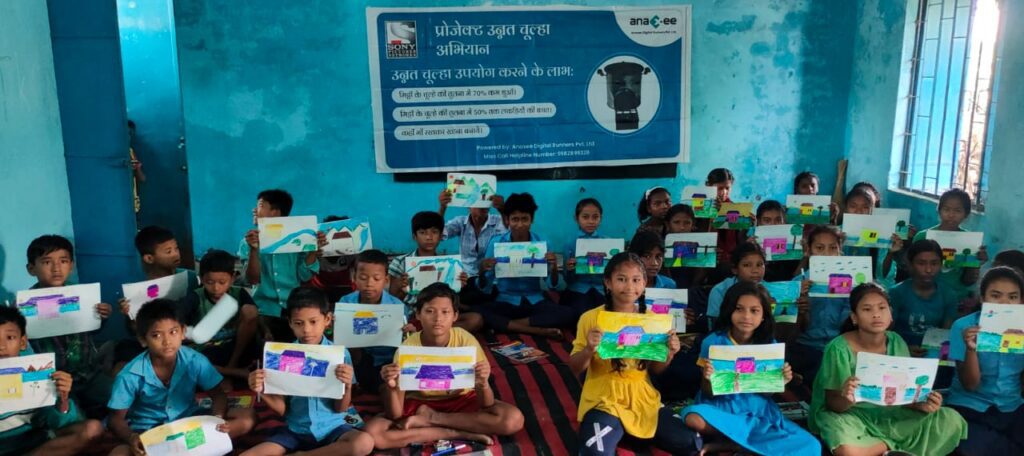
-Projects are designed with farmer and community participation, ensuring permanence and social co-benefits.
-This aligns with IETA’s emphasis on stakeholder consultation and just transition.Risk Reduction for Corporates
-By ensuring credits meet international quality standards, Anaxee reduces reputational and compliance risks for buyers.
Alignment with IETA Guidelines
-Scope 1–3 emissions tracking for clients → supports disclosure.
-High-quality, verified credits → ensures integrity.
-Transparent registries and reporting → supports guideline 6.
-Enabling corporates to make credible claims → prevents greenwashing.
In short: Anaxee translates IETA’s global guidelines into Indian ground reality.
Conclusion
The IETA VCM Guidelines 2.0 are more than a policy paper. They are a blueprint for credibility in carbon markets. By following them, companies can avoid greenwashing, build trust, and channel finance into solutions that truly matter.
But guidelines alone cannot deliver impact. Execution on the ground—across diverse geographies, communities, and ecosystems—remains the missing link.
That’s where Anaxee steps in. With its blend of last-mile execution, community partnerships, and technology-driven monitoring, Anaxee ensures that every carbon credit is real, additional, and trustworthy.
For corporates navigating India’s climate market, this means confidence:
-Confidence that credits are high-quality.
-Confidence that investments are future-proof.
-Confidence that climate claims will stand scrutiny.
The voluntary carbon market is at a crossroads. It can either regain credibility and scale—or stagnate under distrust. With IETA’s guidelines and Anaxee’s execution capacity, there’s a clear pathway forward: climate action with integrity.
About Anaxee:
Anaxee drives/develops large-scale, country-wide Climate and Carbon Credit projects across India. We specialize in Nature-Based Solutions (NbS) and community-driven initiatives, providing the technology and on-ground network needed to execute, monitor, and ensure transparency in projects like agroforestry, regenerative agriculture, improved cookstoves, solar devices, water filters and more. Our systems are designed to maintain integrity and verifiable impact in carbon methodologies.
Beyond climate, Anaxee is India’s Reach Engine- building the nation’s largest last-mile outreach network of 100,000 Digital Runners (shared, tech-enabled field force). We help corporates, agri-focused companies, and social organizations scale to rural and semi-urban India by executing projects in 26 states, 540+ districts, and 11,000+ pin codes, ensuring both scale and 100% transparency in last-mile operations. Connect with Anaxee atsales@anaxee.com