How India’s New Green Credit Rules (Aug 2025) Raise the Bar for Corporate Sustainability
In August 2025, the Ministry of Environment, Forest and Climate Change (MoEFCC) introduced a notification that significantly tightens and clarifies the rules under India’s Green Credit Programme (GCP) for tree-plantation based restoration. For companies, this isn’t just regulatory compliance — it’s a chance to align with global ESG expectations, push real environmental impact, and build brand credibility. However, the changes also bring new challenges — in planning, monitoring, and long-term investment.
In this guide, we walk you through what the new rules are, how they differ from earlier ones, what corporates need to do to not only comply but benefit, and what to watch out for. This is a deep dive, supported by practical advice.
What Is the Green Credit Programme (GCP)?
To set the stage:
-Launched in October 2023 under India’s Lifestyle for Environment (LiFE) initiative, GCP is a voluntary incentive mechanism. Corporations, communities, individuals can earn Green Credits for undertaking eco-restoration activities: plantation, water conservation, etc.
-The idea is to link environmental effort to measurable outcomes: tree survival, canopy density, and restoration of degraded land. It also helps corporations with their CSR obligations, ESG reporting, and compensatory afforestation obligations.
Key Changes in the August 2025 Notification
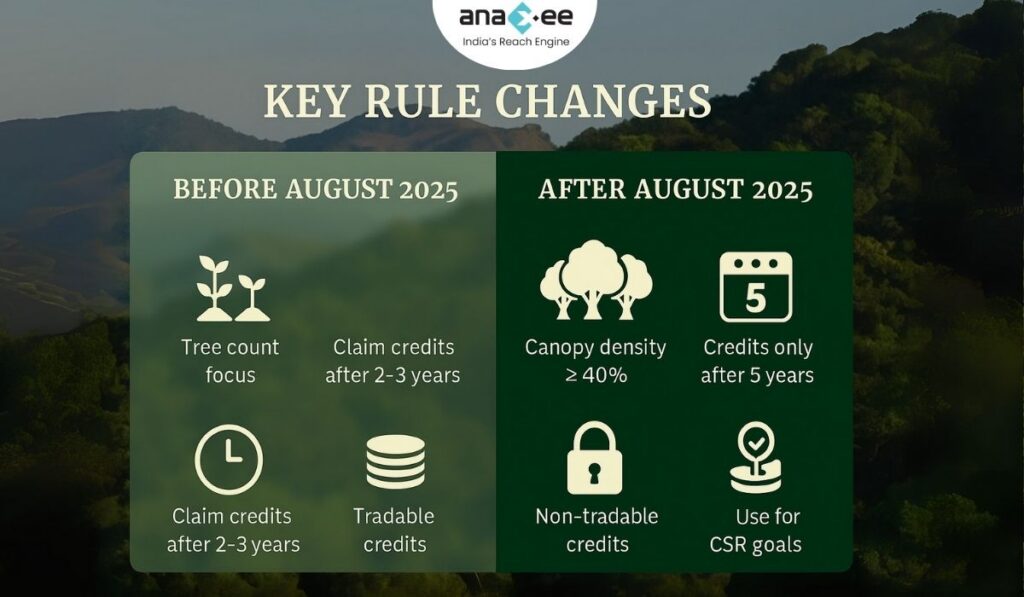
The August 29, 2025 notification introduces several important shifts. Here are the main ones, and how they compare to the older methodology.
| Aspect | Old Rule (Feb 2024 / earlier) | New Rule (Aug 2025) |
| When credits can be claimed | After plantation and basic requirement (tree count) relatively early – e.g. 2 years in some cases. | Only after 5 years of restoration work. |
| Tree survival & quality metrics | Earlier focus was more on number of trees planted / count per hectare, e.g. minimum number of saplings planted. | Now survival of trees after 5 years and canopy density of at least 40% are required. |
| Number of trees per hectare requirement | Previously, certain density norms like ~1,100 trees/ha in some settings. | That specific fixed density benchmark removed; replaced by canopy density + surviving trees. |
| Tradability / transferability of credits | Earlier versions allowed broader trading of green credits in “market-platforms” under GCP. | Credits are non-tradable and non-transferable, except for transfers within holding company ↔ subsidiaries. |
| Use / Exchange of credits | Could be used for CSR, project obligations, compensatory afforestation etc. Some ambiguity about when and how. | The revised rules maintain that credits may be exchanged once for: compensatory afforestation, CSR obligations, or statutory plantation requirements. After being used, they are extinguished and cannot be reused. |
Implications for Corporates
These changes have several consequences — both opportunities and challenges. If you are a company considering a plantation project (or already running one), these are what to think through carefully.
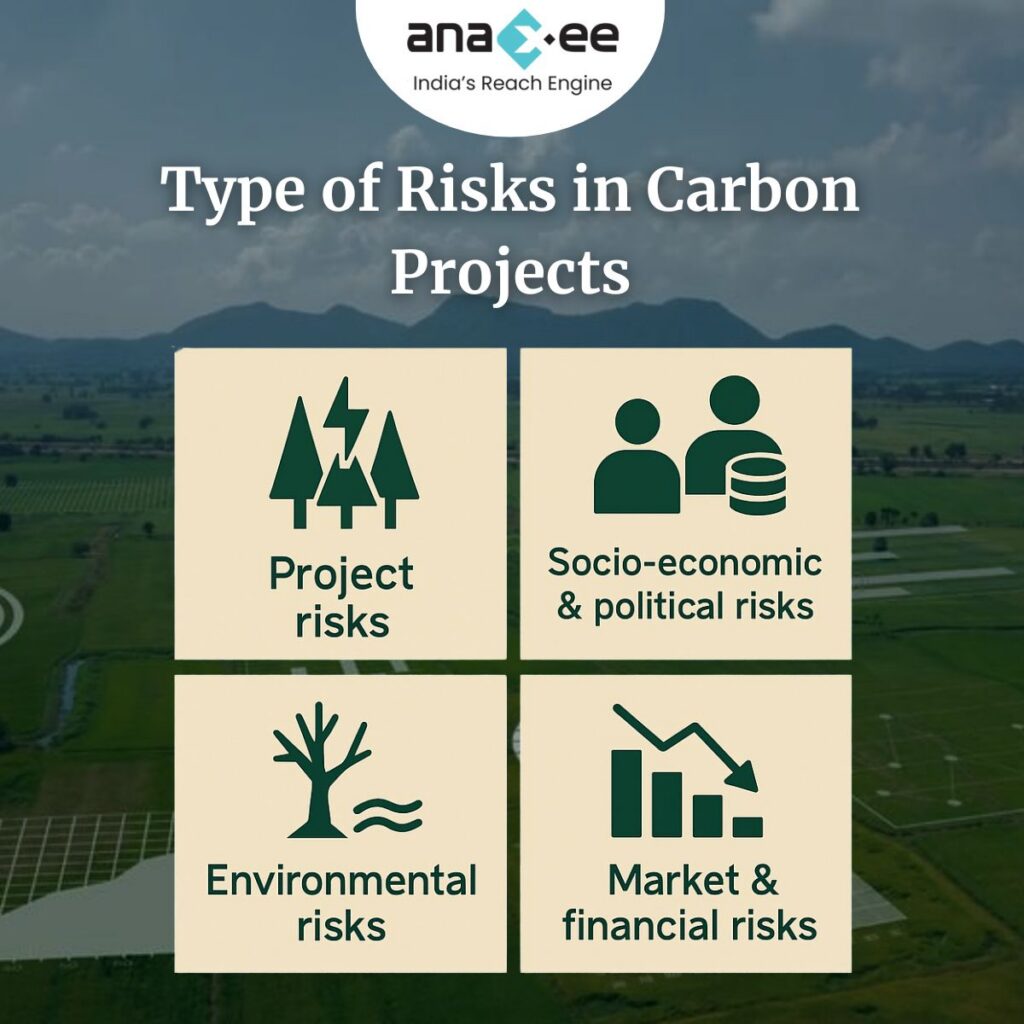
Challenges / Risks
-
Longer time horizon
Waiting five years means delayed benefits. Corporates must sustain investment, monitoring, and maintenance for at least that period. Failure to ensure tree survival, protection, and canopy growth risks losing out. -
Higher operational costs & monitoring
You must monitor survival, protect from grazing, encroachment, fires, pests, etc. You’ll need third-party verification. Soil quality, species selection, water availability all become critical. -
Biological / ecological risk
Species that grow fast may have issues with survival in dry spells or pests. Natural disasters or climatic stress (e.g. drought) can reduce survival dramatically. -
Regulatory / planning alignment
To use credits (for CSR, compensatory afforestation, project approvals), the plantation must meet all new criteria. Corporate planning must align with these requirements even before planting. -
Liquidity and financial modeling
Non-tradability of credits limits monetization potential. Companies cannot expect to sell Green Credits in open markets (except internal transfer). This affects financial return models.
Opportunities / Advantages
-
Stronger ESG positioning
Meeting these stricter rules sends a signal of credibility. It’s not just about planting trees but restoring ecosystems. That builds reputation with investors, stakeholders, consumers. -
Better environmental outcomes
Focus on survival, canopy density means greater ecological benefit — carbon sequestration, biodiversity, soil protection, watershed health. -
Cost/benefit via CSR / legal compliance
Since credits can be used once for CSR or compensatory obligations, corporates can integrate them into compliance obligations, reducing duplication or overlap. -
Early-mover advantage
Companies that plan well, choose species correctly, engage communities, invest in monitoring, will benefit; they can show case studies, get ahead on ESG reporting. -
Data, transparency, accountability
New methodology demands better data. Corporates that build capacity in GIS/remote sensing, vegetation monitoring, tree survival data will have an advantage and possibly cost efficiencies over time.
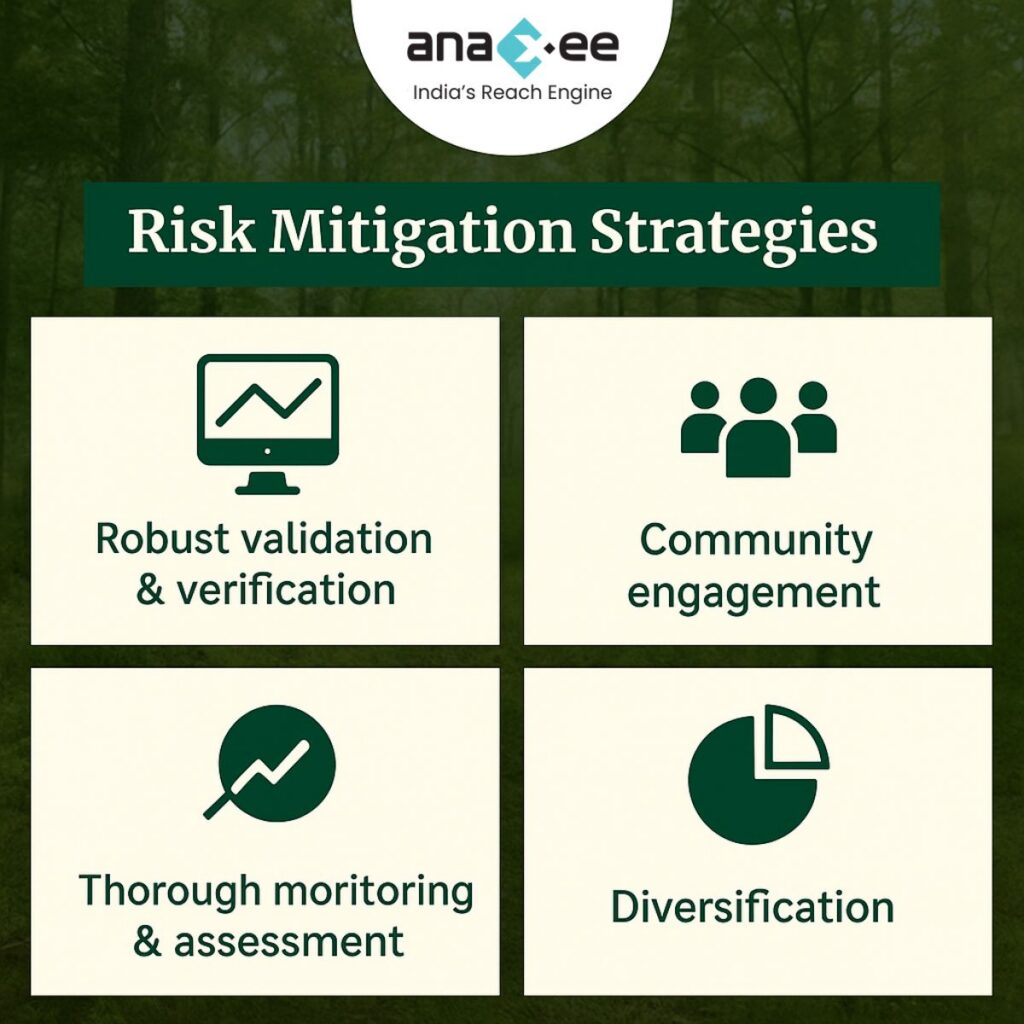
What Corporates Need to Do to Comply & Maximize Benefit
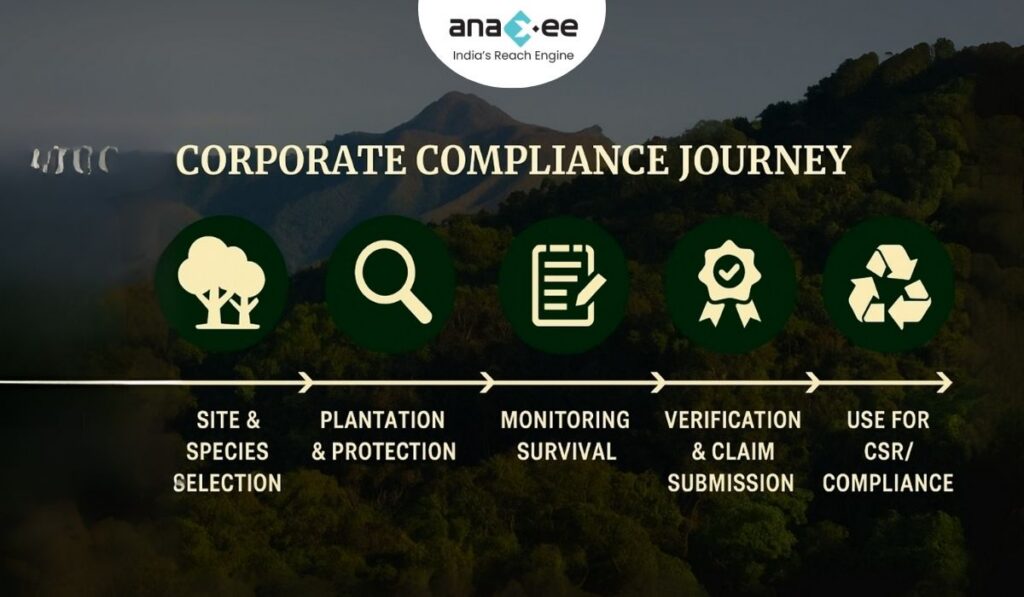
Here are practical steps corporates should take, ideally before undertaking plantation/restoration, to align with the new rules and reduce risk.
-
Site selection & baseline assessment
-
Identify degraded land parcels eligible under GCP. Check with state forest departments.
-
Assess current vegetation cover, soil health, water availability.
-
Understand local climatic stress, grazing patterns, fire risk, pests.
-
-
Species selection (with native species preference)
-
Choose species suited to the agro-climatic zone. Native species often have better survival, improve biodiversity.
-
Avoid uniform monocultures unless ecologically justified.
-
-
Planning plantation structure to achieve canopy density
-
Think about spacing, growth rates, canopy shape. To reach 40% canopy cover after five years, initial planting density + growth rates must be modeled.
-
Consider a mix: fast-growing pioneer species + slower, more robust ones to fill canopy later.
-
-
Protection & maintenance
-
Fencing or protection from grazing & encroachment.
-
Fire prevention measures.
-
Regular watering / irrigation (especially in dry seasons).
-
Pest and disease control.
-
-
Monitoring & verification processes
-
Use remote sensing, GIS tools to monitor canopy density over time.
-
Maintain records of surviving trees, their growth, health.
-
Engage third-party verifiers where required.
-
-
Legal & documentation readiness
-
Be ready to submit claim reports in the prescribed format.
-
Plan for verification fees, documentation costs.
-
Align internal CSR / environment policies with GCP rules so that credit exchange is smooth.
-
-
Financial planning
-
Budget for costs over 5+ years, not just initial planting.
-
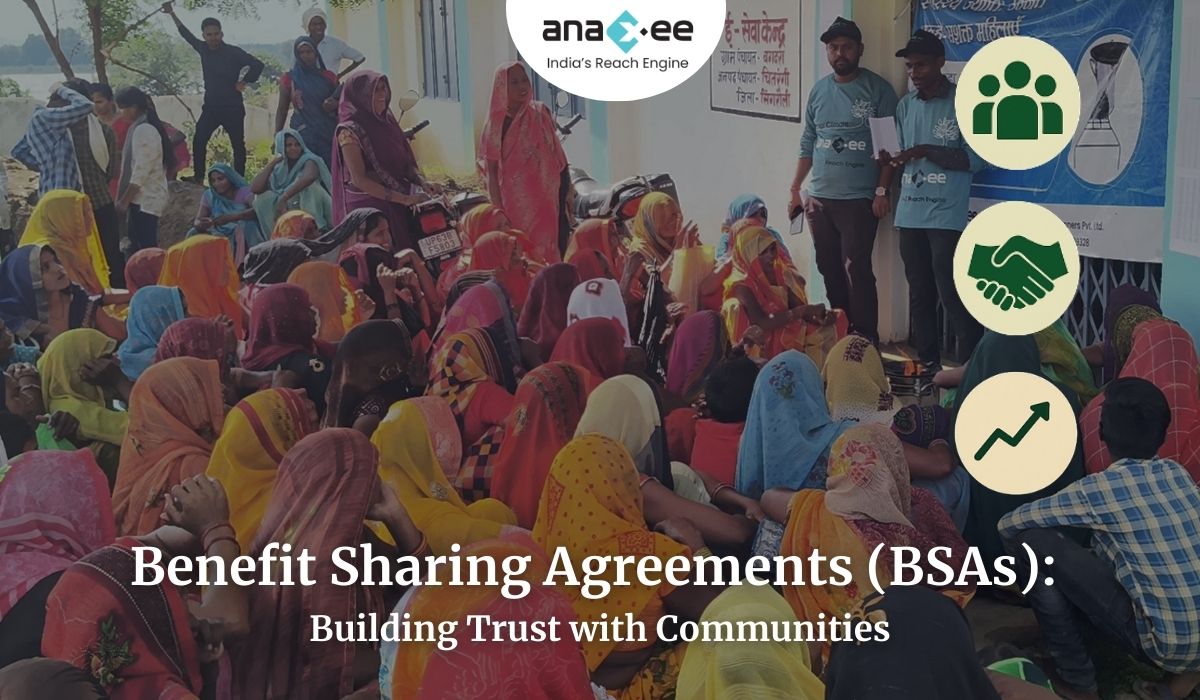
Consider partnerships (forest departments, NGOs, local communities) to share burden and risks.
-
Assess discounting of future benefit, risk of tree mortality, etc.
-
Case in Point: What Was Changed & Why It Matters
To deepen understanding, here are some specific changes and what they address.
-Removal of fixed tree per hectare benchmark: Fixed benchmarks were criticized as encouraging dense plantation even in grasslands or areas poorly suited, increasing mortality or ecological disruption.
-Shift toward survival & canopy density: These ensure that planted trees aren’t just counted early but grow, survive, and form a functioning canopy. That improves carbon sequestration, biodiversity, etc.
-Non-tradability: By restricting trade, the government appears to be trying to avoid speculative credit trading detached from actual environmental benefit. It ensures credits are used toward CSR or legal obligations rather than purely as financial instruments.
Practical Considerations: Species Selection, Agro-Climatic Zones & Carbon Sequestration
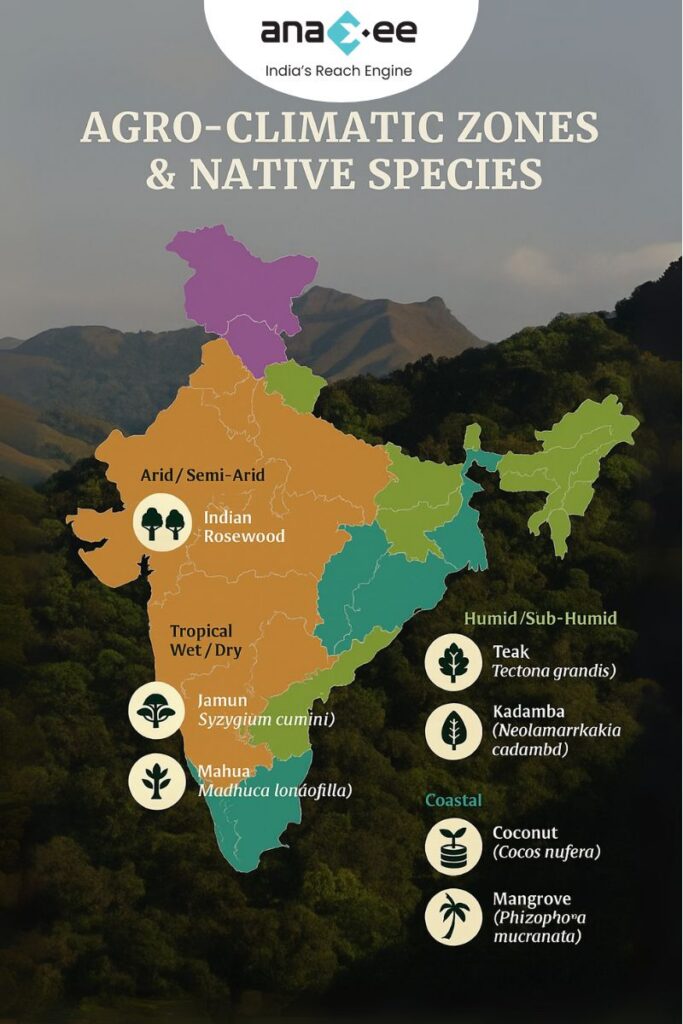
The image/document you shared has a helpful table showing example native species by agro-climatic zone, time to achieve ~40% canopy cover, issues & challenges, and carbon sequestration potential over 5 years.
Here’s how to integrate those insights:
-In arid / semi-arid zones, species like Neem (Azadirachta indica), Rosewood (Dalbergia sissoo) etc. could be used; expect moderate biomass; slower canopy build; plan for water scarcity and grazing.
-In tropical wet / dry zones, combining species like Jamun (Syzygium cumini), Mahua (Madhuca longifolia) etc. will help achieve canopy more rapidly; but plan for dry spells / cattle browsing.
-Humid / sub-humid zones allow stronger biomass, quicker canopy; but must guard against disease, pests, heavy rain damage.
-Coastal zones have additional challenges from salinity, storms — choosing salt-tolerant, cyclone-resistant species is key.
-For temperate / hill zones, growth is slower; but long-lasting trees, good stock of biodiversity; canopy build may take more time, but long-term sequestration/maturity is valuable.
Using the table to choose region-appropriate species will significantly improve survival and canopy density.
Strategic Approach: How Anaxee (or Similar Corporates) Can Build a Green Credit Roadmap
Here’s a suggested roadmap that a corporate (or Anaxee) might adopt to integrate these rules into its sustainability / CSR / environment strategy.
-
Gap audit
-
Check existing/tree plantation / CSR projects: how many of them meet or will meet the 5-year + 40% canopy criteria?
-
What species, maintenance, documentation, survival rates exist?
-
-
Pilot project(s)
-
Start with one or two sites to manage all variables: species selection, protection, monitoring. Use these as learning models.
-
-
Partnership building
-
Collaborate with local forest departments, NGOs, community groups — for tree care, security, protection, know-how.
-
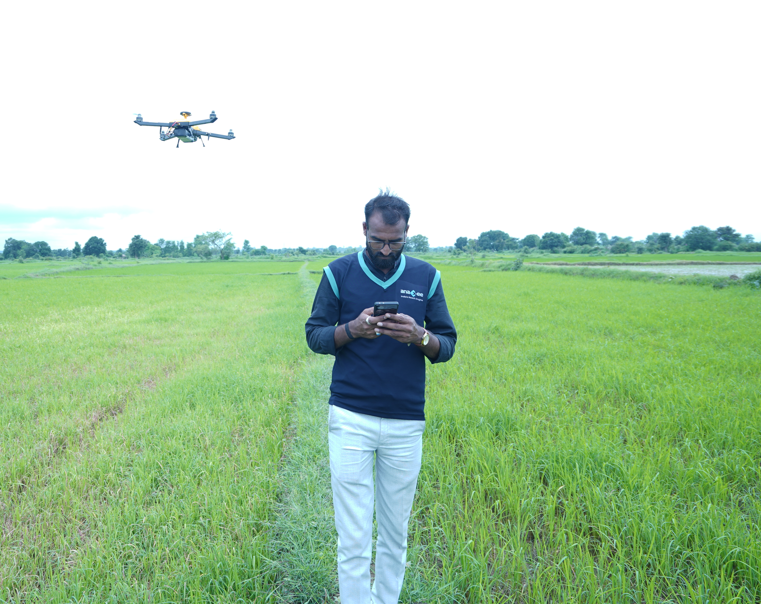
Use technology partners for remote sensing / canopy monitoring (satellite imagery, drones).
-
-
Finance & resource allocation
-
Allocate budget over 5+ years (planting + care).
-
Factor in cost of verification / third-party monitoring.
-
-
Internal capacity & processes
-
Set up teams / systems for periodic monitoring, record-keeping.
-
Ensure legal / CSR / environment department coordination so that claims, usage of credits, documentation etc. are timely.
-
-
Stakeholder communications & reporting
-
Use these ESG metrics & green credit achievements in annual reports, CSR disclosures.
-
Be transparent on failures / survival challenges — such honesty improves credibility.
-
-
Continuous improvement
-
After 5 years, evaluate: Did you reach canopy density? What survival rates? What could be improved (species, protection, site selection)?
-
Use those lessons in next project or in scaling up.
-
What to Watch Out For: Risks & Red Flags
To avoid pitfalls, corporates must be aware of:
-Survival rate slippage: Simply planting without adequate maintenance leads to mortality in early years, making the final canopy requirement hard to meet.
-Ecological mismatch: Planting species not suited to soil, water availability, local pests or climate can reduce survival.
-Lack of long-term commitment: Year 1–2 are easy; years 3-5 often see drop in care. Corporates must plan for all years.
-Verification issues: If documentation is poor or monitoring tools weak, claim may be rejected.
-Legal / land rights issues: Some degraded lands may be encumbered (community rights, forest rights, etc.). Getting permissions, ensuring clarity of ownership/use is critical.
How These Rules Fit Into India’s Broader Climate / Sustainability Goals
Understanding the bigger picture helps frame corporate strategy:
-India has committed to restoration of degraded lands under international forums (e.g. Bonn Challenge). Actions under GCP contribute to these goals.
-Improved forest cover, canopy, and tree survival help with carbon sequestration, cooling, watershed protection, biodiversity — all key for climate resilience.
-ESG / Sustainability Reporting is increasingly demanded by investors, regulators. Companies that can show compliance with MoEFCC rules will be better positioned.
This also helps meet compliance under forest / environment laws, compensatory afforestation obligations, CSR mandates.
Examples / Hypothetical Scenarios
To make it concrete, here are a couple of hypothetical scenarios illustrating what difference the new rule makes.
Scenario A: A company planted 1,500 saplings per hectare in a semi-arid region (species suited). Under old rules, they might have claimed credits after 2 years based on numbers. Under new rules, after 5 years they must show survival, canopy density ≥ 40%. If only 60% of saplings survive, and canopy is patchy, they may fall short.
Scenario B: Another firm picks better species, mixes fast and slower growers, protects from grazing, uses supplementary irrigation in dry months. They document everything, monitor canopy with remote sensing. After 5 years, they achieve 45% canopy, survival rate 70%. They meet criteria, claim credits, use them partly for CSR & for compensatory afforestation obligations.
These examples show that it’s not impossible, but demands careful planning and resilience.
Conclusions & Recommendations
-The MoEFCC’s 29 August 2025 notification marks a shift from quantity-oriented plantation targets to quality, ecological impact, and long-term sustainability.
-For corporates, this raises the bar: more effort, more planning, but also more meaningful environmental and reputational returns.
-The critical success factors will be species selection suited to local agroclimatic zones, protection, monitoring, documentation, and sustaining investment over the full 5 year period (and ideally beyond).
-Corporates that treat this as a core part of their ESG/CSR strategy (not just a checkbox, but a mission) will gain competitive advantage, stronger brand trust, possibly regulatory goodwill.
The Green Credit Rules 2025 aren’t just another regulation — they represent a growing expectation (both globally and within India) that environmental restoration must deliver real, quantifiable impact. Corporates that adapt early, plan deeply, and invest sustainably will not just comply — they will shape leadership in the green economy.
In many ways, the notification challenges old habits: tree-planting campaigns for public photo-ops, minimal maintenance, superficial checks. This is different — results matter: survival, canopy, ecosystem health. It’s harder, but the payoff (environmental, reputational, regulatory) is proportionally higher.
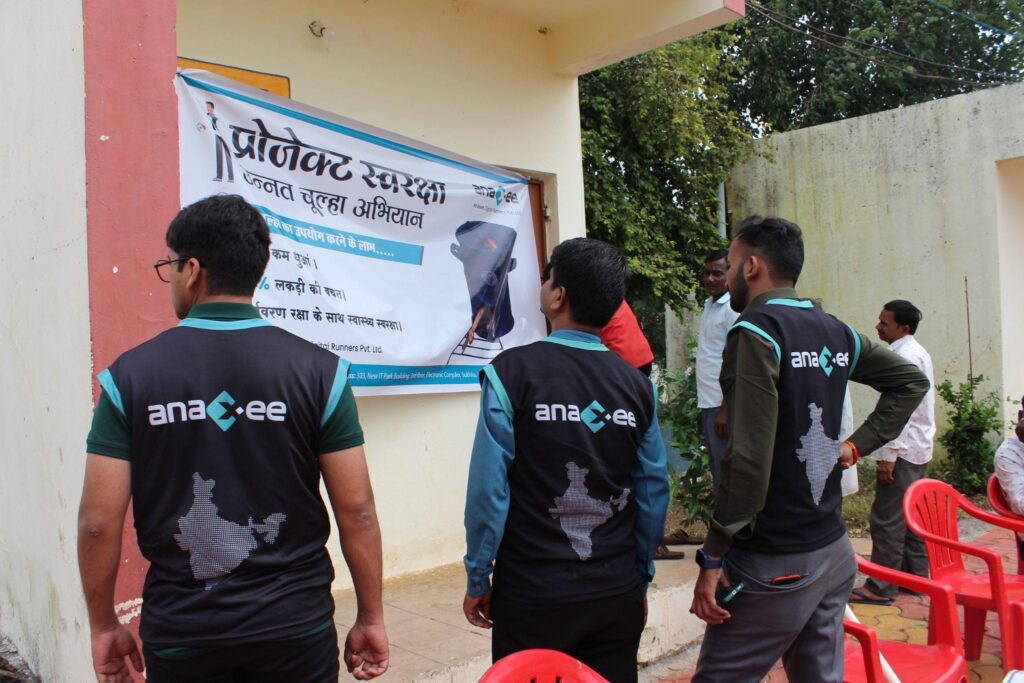
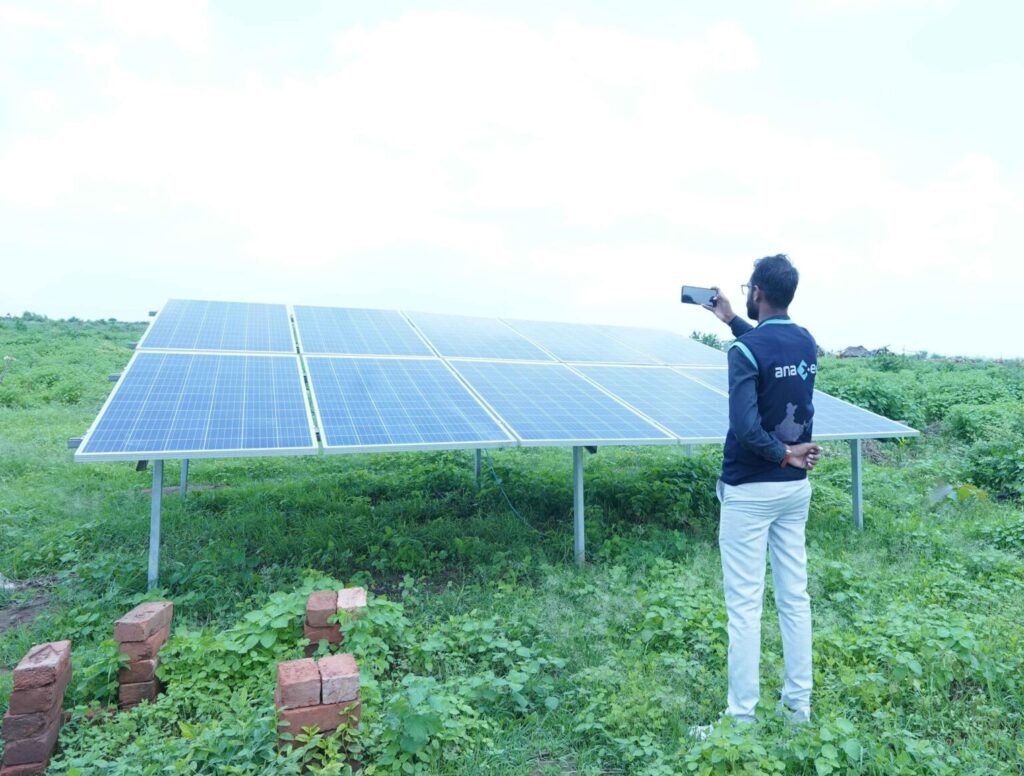
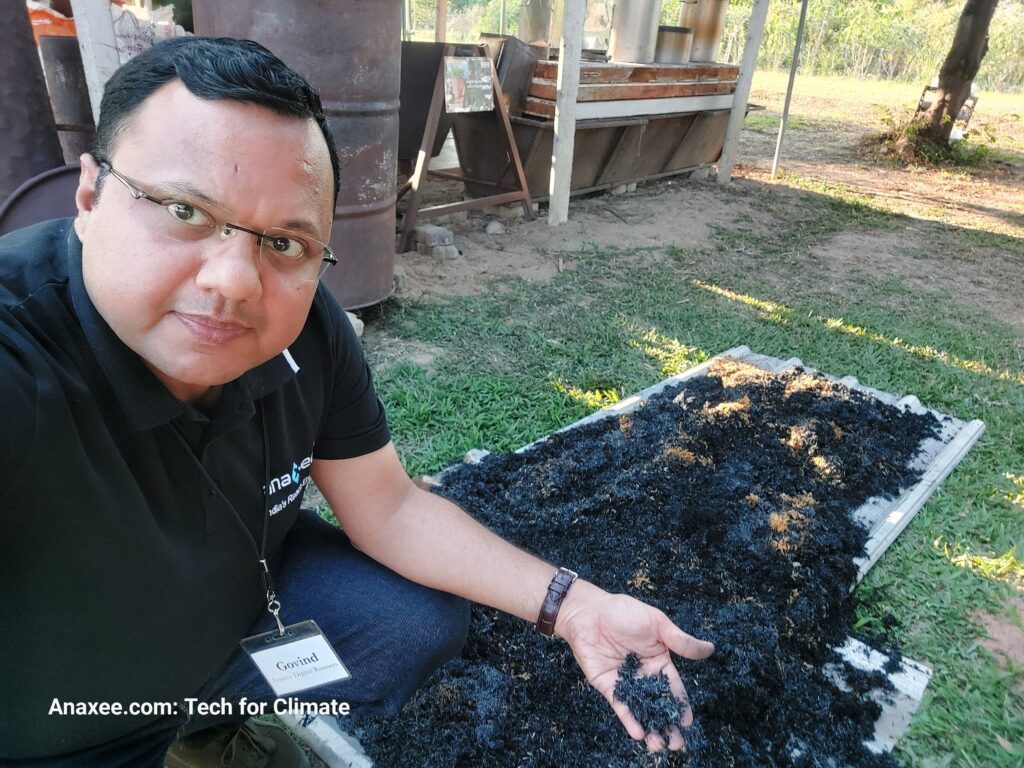
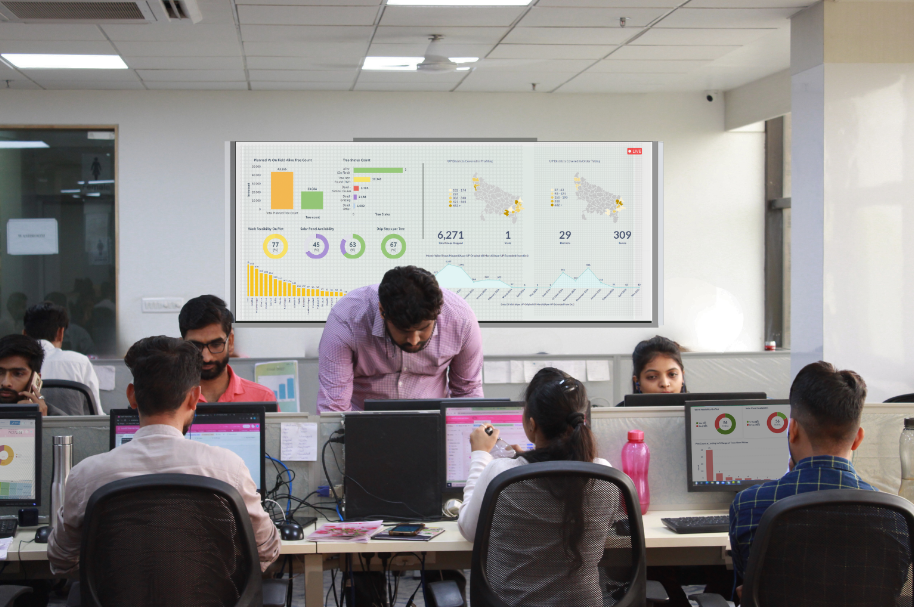
About Anaxee: Anaxee drives large-scale, country-wide Climate and Carbon Credit projects across India. We specialize in Nature-Based Solutions (NbS) and community-driven initiatives, providing the technology and on-ground network needed to execute, monitor, and ensure transparency in projects like agroforestry, regenerative agriculture, improved cookstoves, solar devices, water filters and more. Our systems are designed to maintain integrity and verifiable impact in carbon methodologies.
Beyond climate, Anaxee is India’s Reach Engine- building the nation’s largest last-mile outreach network of 100,000 Digital Runners (shared, tech-enabled field force). We help corporates, agri-focused companies, and social organizations scale to rural and semi-urban India by executing projects in 26 states, 540+ districts, and 11,000+ pin codes, ensuring both scale and 100% transparency in last-mile operations. Connect with Anaxee at sales@anaxee.com