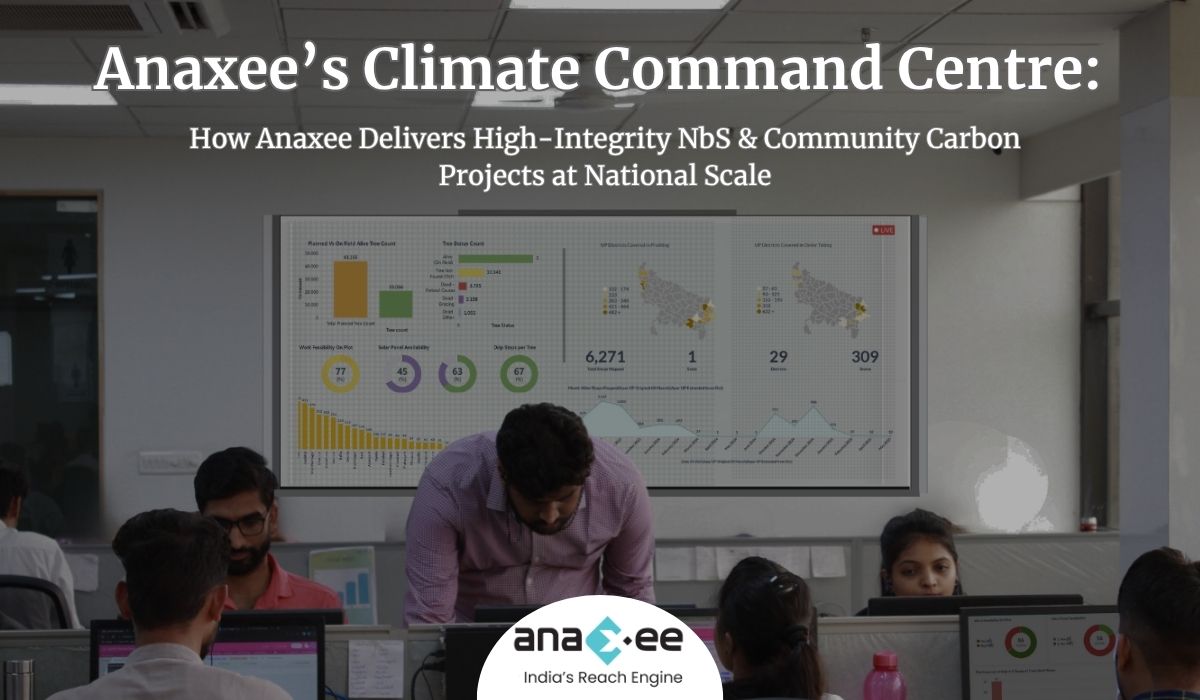
Anaxee’s Climate Command Centre: Carbon Projects with Precision and Scale
When most people think about carbon credit projects, they imagine forests being planted or cookstoves being distributed. But what they often overlook is the backend engine- the systems, people, and technology that make sure these projects are done correctly, at scale, and with trust. That engine, at Anaxee, is called the Climate Command Centre.
Let’s take you inside.
What is the Climate Command Centre?
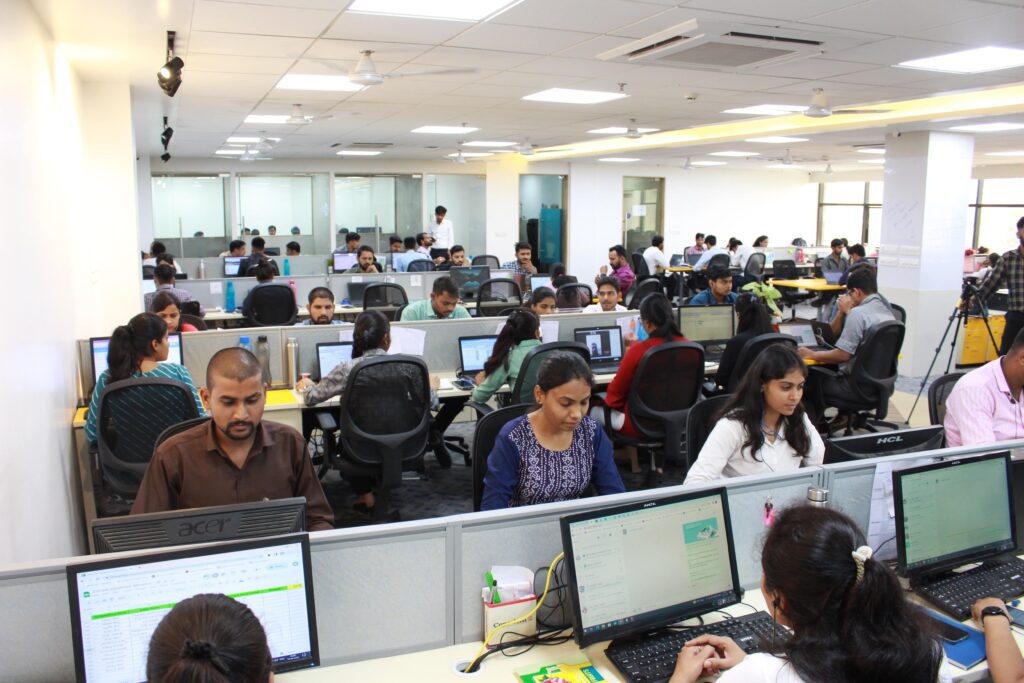
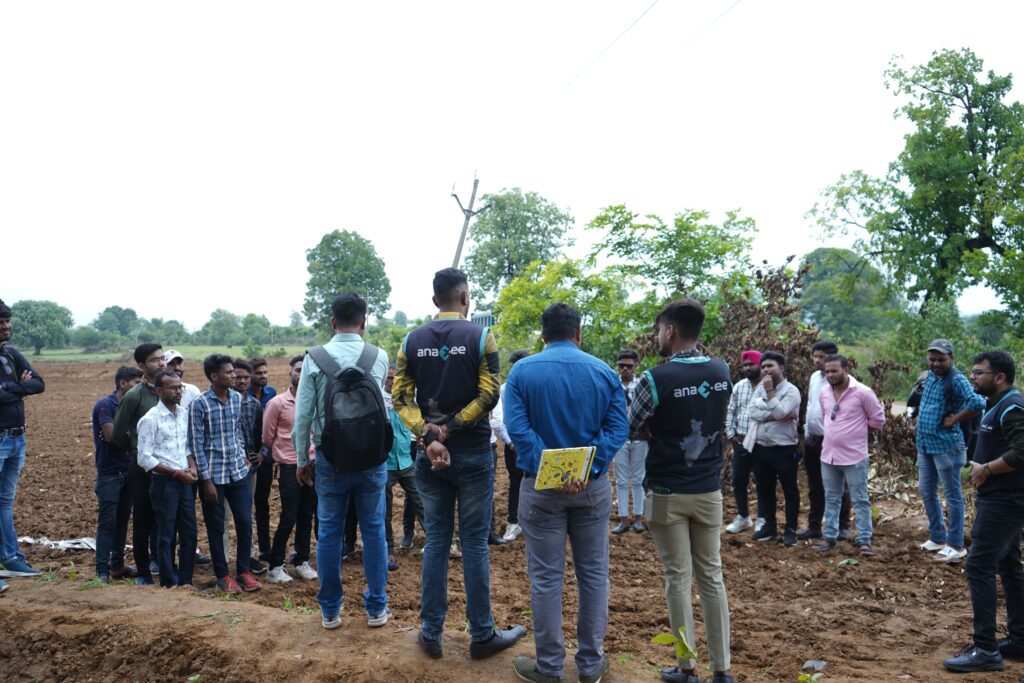
Anaxee’s Climate Command Centre is a centralised project management hub built to monitor and execute climate projects across thousands of locations in India. From tribal villages in Odisha to farming belts in Maharashtra, our Climate Command Centre operates like a control tower. It coordinates a workforce of 100,000+ Digital Runners, backed by a dedicated team of 125+ employees stationed at our headquarters.
While our Digital Runners collect ground-level data and engage with communities, our internal team reviews, guides, and manages the end-to-end lifecycle of each project.
We handle:
-Project planning & deployment
-Real-time monitoring of ground activity
-Continuous training
-Quality checks
-Data validations
-Beneficiary onboarding
-Dashboards and Reporting
Let’s break down how it all works.
Our Secret Weapon: 125+ Team Members Coordinating Every Step
Executing a carbon project isn’t just about planting trees or delivering clean cookstoves. It’s about ensuring that every tree is planted at the right depth, every stove reaches a genuine beneficiary, and every piece of data is auditable. That level of precision is possible because of our dedicated 125+ team members, each assigned to specific processes.
Their work includes:
-Tracking Digital Runner activity in real-time
-Monitoring data uploads and location tagging
-Assigning and reassigning tasks based on data gaps
-Resolving field-level issues instantly
-Flagging quality issues for correction
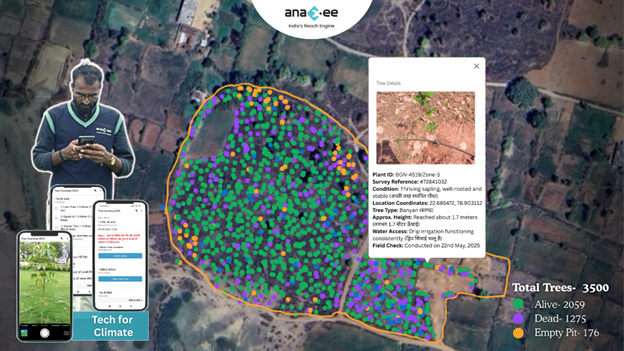
Example: Agroforestry Monitoring
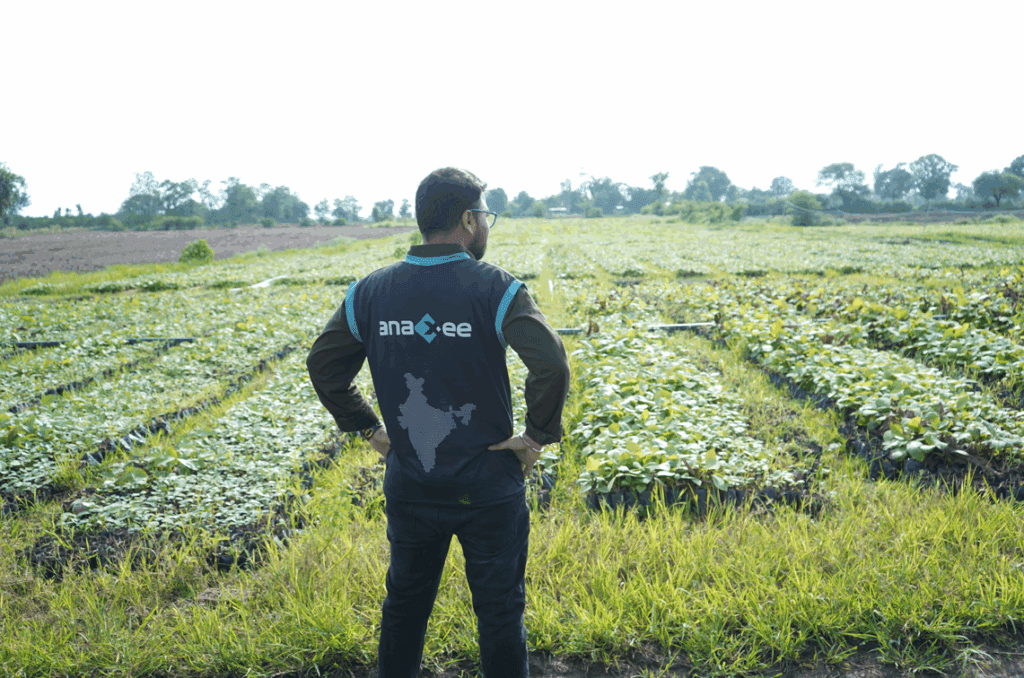
In agroforestry, Digital Runners geo-tag tree pits, click pre- and post-plantation photos, and record species-level data. Our internal team validates if the pits meet depth requirements (e.g., 1x1x1 ft), reviews timestamped photos, and ensures sapling count matches the project design. If any issue arises, immediate feedback is sent to the Runner with corrective instructions.
This is project management at the micro level, scaled up across 5000+ villages.
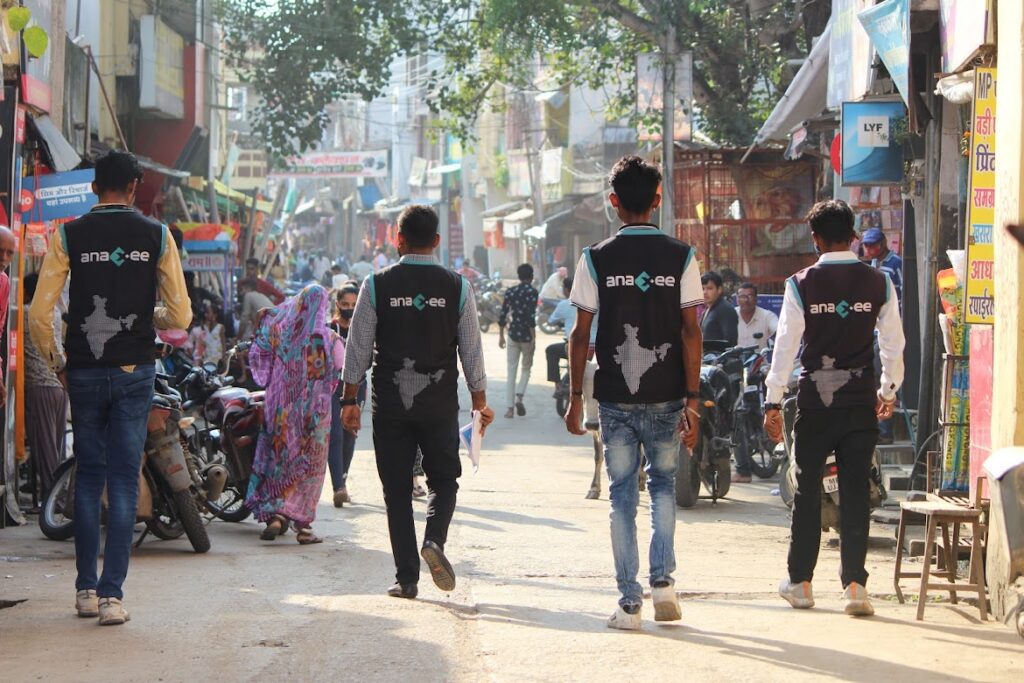
Localized Power: Why Digital Runners Are Key
Instead of parachuting people into rural areas, we hire Digital Runners from their own localities. This gives us several advantages:
-Trust: Locals are more welcomed by the community.
-Familiarity: They know local dialects, routes, and dynamics.
-Accountability: They stay in the same region and can be traced.
Digital Runners aren’t just data collectors. They are:
-Trained field agents
-Project ambassadors
-Beneficiary verifiers
We combine this local trust with robust backend support.
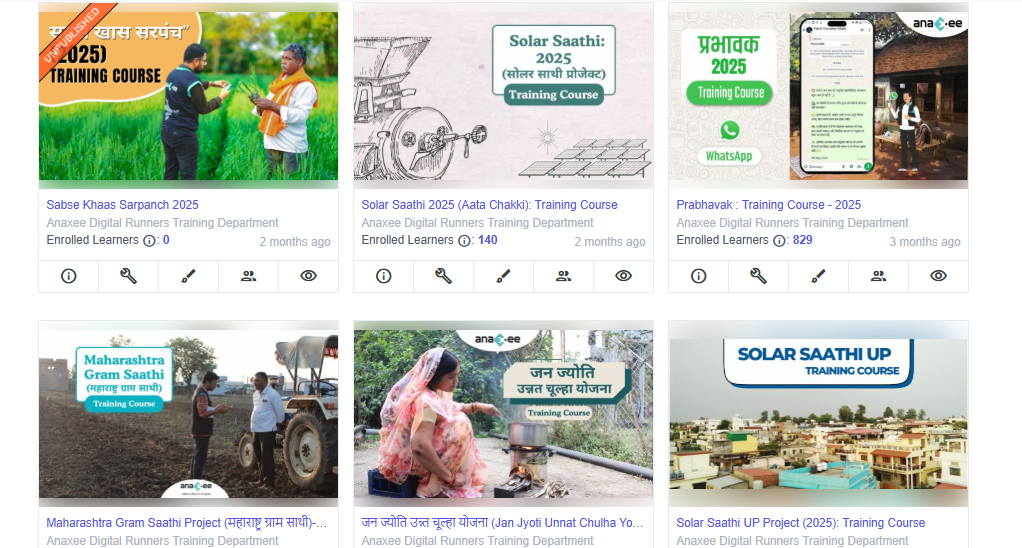
Training That Actually Works: From Zoom to Field
Before any Runner is activated, they go through a structured training program that includes:
-Video modules in regional languages
-Live Zoom sessions for Q&A
-On-ground field demos with supervisors
-Interactive quizzes to verify learning
Why Training Matters
In an Agroforestry project, if a sapling is planted incorrectly (e.g., shallow pits, incorrect spacing), it could die within months—invalidating future carbon credits. Training ensures:
-Accurate spacing and layout of plantations
-Correct species mapping
-Understanding of the project’s climate goal
We don’t assume knowledge. We train for it, test for it, and track it.
Our Digital Stack: Real-Time, Transparent, Traceable
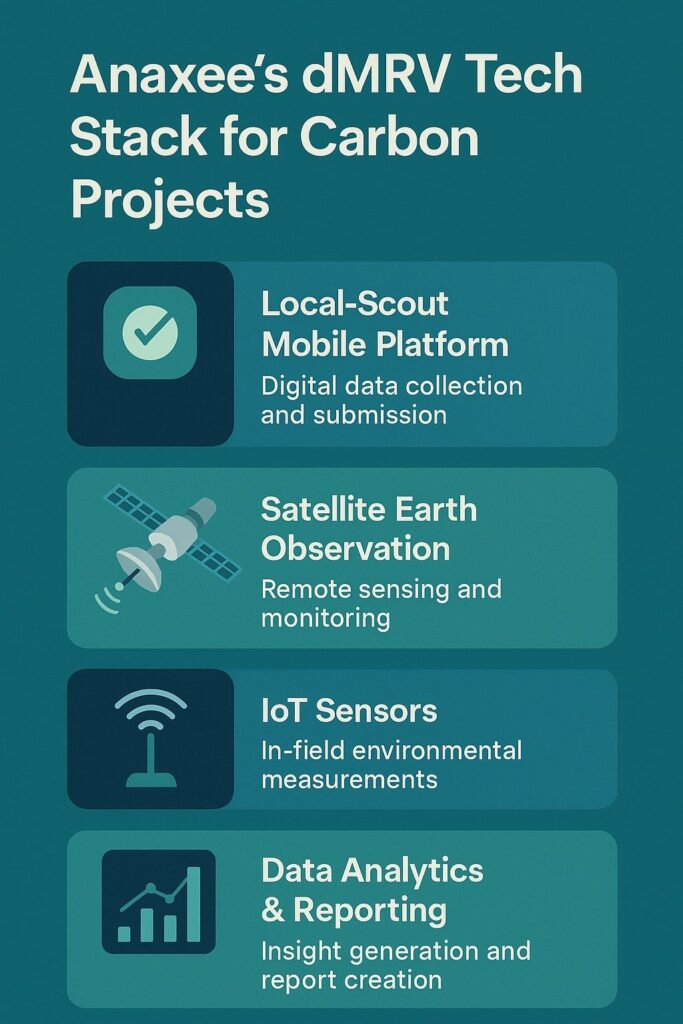
Technology is the backbone of our project management. We’ve built a full-stack system that includes:
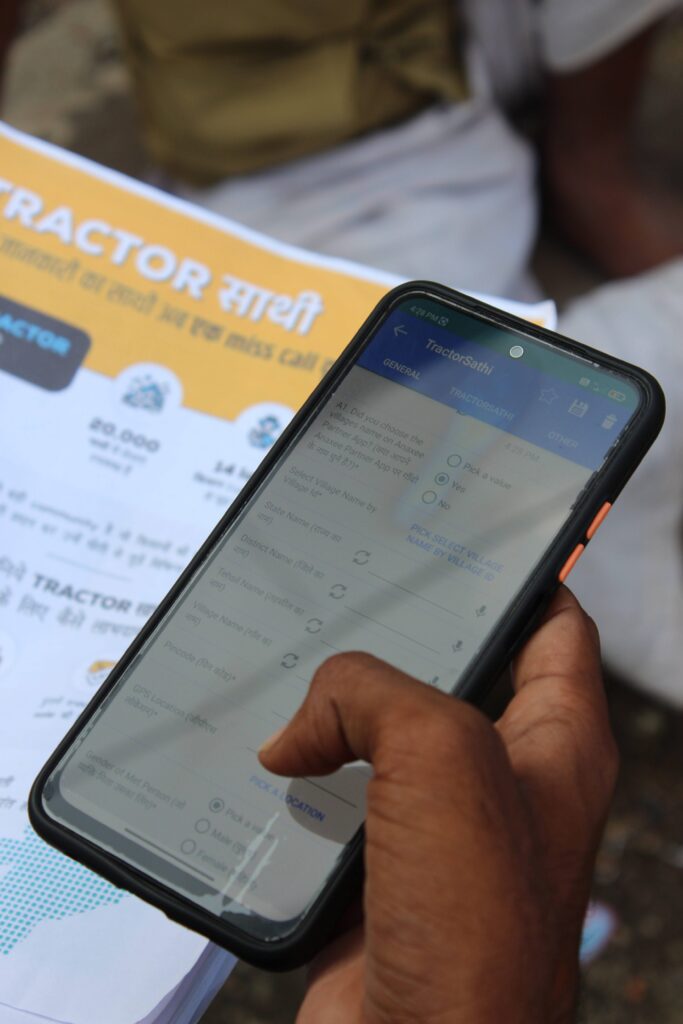
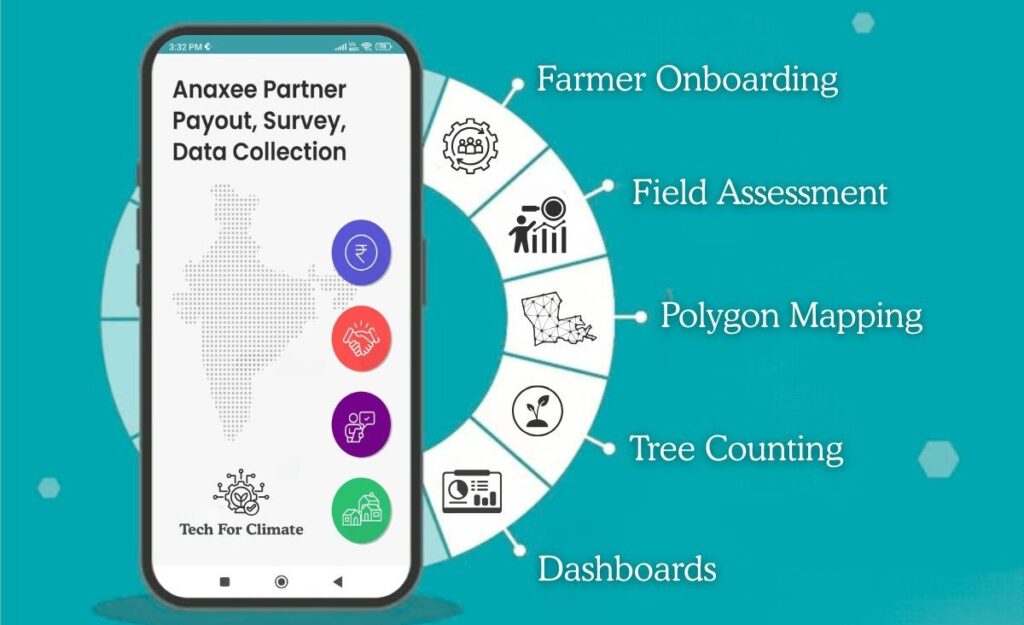
1. Anaxee Partner App
Used by Digital Runners to:
-Get assigned tasks
-Upload GPS-tagged images
-Fill in project forms
-Record feedback from the ground
2. Training Portal
-Video content
-PDF manuals
-Language-specific quizzes
-Score tracking for certification
3. dMRV Platform
-Real-time tracking of Runner activities
-Quality control triggers
-Data analytics for trends
-Integration-ready with Verra, Gold Standard protocols
This is Digital MRV (Measurement, Reporting, and Verification) in action.
How We Do Quality Check of Data
Every image, every GPS point, and every form is checked and validated.
Here’s how:
-Images are auto-checked for time, location, clarity
-GPS points are verified using backend maps
-Forms are run through logic rules (e.g., sapling count vs. land size)
-Duplicate entries flagged
If a data point fails any check, a feedback loop is triggered, and the Runner is notified instantly.
Example: Clean Cooking Project
For clean cookstove distribution:
-Digital Runners collect beneficiary info, stove images, and usage confirmation
-Our backend team filters for low-income families using demographic indicators
-Only eligible households are onboarded
-Follow-up calls validate usage
Beneficiary Selection: No Guesswork
We have set processes to identify and validate beneficiaries. For example:
In Improved Cookstove Projects:
-Runners first survey the household
-Mobile app captures cooking method, wood usage, and household size
-Data runs through filters (e.g., LPG vs. firewood users)
-Only wood-using households below income threshold are approved
This ensures high additionality and methodological integrity.
Dashboards That Tell the Truth
Every stakeholder, from project developers to auditors, wants visibility. We provide it through:
-Real-time dashboards for plantation progress
-Maps showing exact geo-coordinates of beneficiaries
-Status trackers for sapling survival, device usage
-Weekly reports downloadable in CSV or PDF
It’s transparency by design, not just as a reporting requirement.
Human + Digital: Our Hybrid Model
What sets Anaxee apart is this hybrid model:
-Humans on ground: For empathy, trust, adaptability
-Tech on cloud: For scalability, accuracy, auditability
This balance allows us to:
-Scale fast without losing quality
-Pivot quickly when field realities shift
-Maintain end-to-end control
We Don’t Just Run Projects. We Command Them.
Calling it a “Climate Command Centre” isn’t just branding. It’s an operational reality.
Whether we’re planting 10 lakh trees, distributing 1 lakh stoves, or mapping 50,000 acres of land, every step is managed, measured, and improved in real time.
And behind it all is a team that cares, tools that work, and a vision that scales.
Why This Matters
Carbon markets are shifting toward high-integrity, high-auditability projects. Gone are the days when a generic CSR report would suffice. Today, every credit must be backed by:
-Verified data
-Transparent processes
-Community co-benefits
Anaxee is ready. And the Climate Command Centre is where it all comes together.
Interested in Partnering with Us?
If you’re a project developer, carbon registry, CSR leader, or climate investor—reach out. See how Anaxee’s Climate Command Centre can become your execution backbone in India. Connect with us at sales@anaxee-wp-aug25-wordpress.dock.anaxee.com
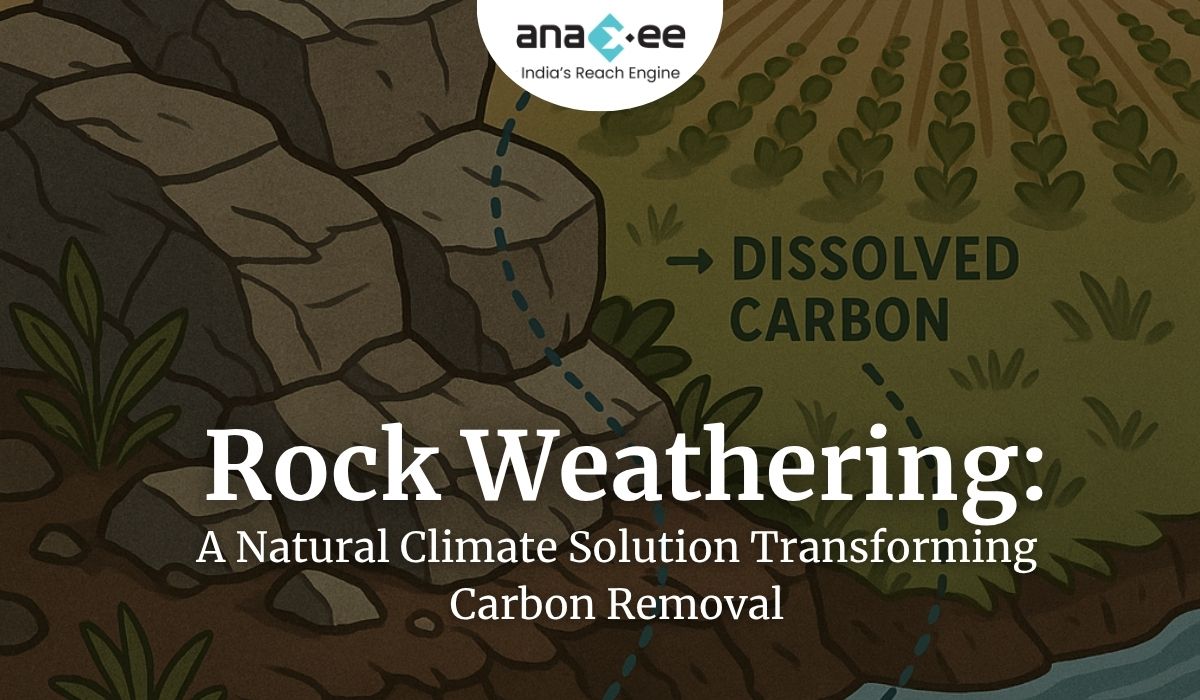
Rock Weathering: A Natural Climate Solution Transforming Carbon Removal
Introduction: Why We Need to Look Beneath Our Feet
As climate change accelerates, the urgency to remove carbon dioxide (CO₂) from the atmosphere has intensified. Governments, companies, and climate scientists are searching for scalable, affordable, and permanent solutions. Among nature-based and tech-assisted methods, one solution that’s gaining traction yet remains under-discussed is “rock weathering.” This naturally occurring geological process may not sound revolutionary, but its potential to sequester billions of tonnes of carbon is drawing serious attention.
India, too, with its vast basaltic formations and mineral-rich terrain, is uniquely positioned to lead in the application of this method — especially with the emergence of Article 6 mechanisms and India’s own Carbon Credit Trading Scheme (CCTS). But before we get to the market opportunities, let’s understand what rock weathering actually is.
1. What is Rock Weathering?
Rock weathering is the natural process by which rocks break down over time due to exposure to air, water, and biological activity. When it comes to climate, we are specifically interested in a sub-type called “chemical weathering” — particularly of silicate minerals.
Here’s how it works:
-Silicate rocks (like basalt or olivine) react with atmospheric CO₂ and rainwater.
-This forms bicarbonates, which are eventually washed into the oceans.
-Over thousands of years, the bicarbonates turn into carbonates and are stored in marine sediments — effectively locking away CO₂.
This process has been regulating Earth’s climate for millions of years, but it operates on geological timeframes. What’s new is the idea of “enhanced weathering.”
2. Enhanced Weathering: Speeding Up a Natural Process
Enhanced weathering is a climate intervention technique that aims to accelerate this natural CO₂ removal process by:
-Crushing silicate rocks to increase surface area
-Spreading them over farmland, grasslands, or degraded land
-Letting rainfall and soil processes do the rest
One of the key advantages is that this method is permanent, meaning the captured carbon doesn’t get released back into the atmosphere like in many short-term offset projects. And it does not require massive infrastructure.
Think of it as turning crushed rock into a carbon sponge.
3. The Science Behind It
The chemical formula for the reaction is often simplified like this:
This means one molecule of silicate binds with one molecule of CO₂ to form solid calcium carbonate and silica.
Some popular rocks for this purpose include:
-Olivine – Found in dunite, highly reactive with CO₂
-Basalt – Abundant in India’s Deccan Plateau
-Peridotite – Found in ophiolites, very high in magnesium silicates
The key is the reaction kinetics — how fast the rocks weather in a given climate and soil condition. Humid tropical environments like India offer excellent conditions for faster weathering.
4. Agronomic Co-benefits: More Than Just Carbon
Interestingly, this approach doesn’t just sequester carbon. It also improves soil health:
-Reduces soil acidity – A natural liming effect, particularly helpful in acidic soils
-Adds nutrients – Basalt contains potassium, calcium, and magnesium
-Improves water retention – Microporous crushed rock increases soil capacity
-Boosts crop yields – Some early studies show 5–10% increase in output
This makes it ideal for integrating with agricultural programs, especially in smallholder farming systems like India’s. Enhanced rock weathering could serve dual purposes: climate mitigation and rural soil rejuvenation.
5. Potential in India: A Hidden Advantage
India’s geology offers one of the largest contiguous basalt formations in the world — the Deccan Traps, spanning Maharashtra, Madhya Pradesh, Gujarat, and parts of Telangana and Karnataka. These rocks are not just abundant but also underutilized.
Why India is Strategically Positioned:
Factor
India’s Advantage
Rock Availability
Extensive basalt from Deccan Trap
Climate Suitability
Monsoonal rains, warm temperatures
Agricultural Integration
Smallholder farms, acidic soils in many regions
Labor Force
Rural outreach potential for spreading material
Policy Environment
CCTS and Voluntary Carbon Market reforms
If India scales this approach regionally, it could create a climate-positive agri-revolution.
6. Rock Weathering vs. Other Carbon Removal Methods
Let’s compare rock weathering with some other popular carbon removal approaches:
Approach
Cost (USD/tCO₂)
Permanence
Co-benefits
Maturity
Rock Weathering
$50–$150
1,000+ yrs
Soil, yield
Emerging
Biochar
$30–$120
100–500 yrs
Soil fertility
Mature
DAC (Direct Air Capture)
$600–$1000+
1,000+ yrs
None
Nascent
Afforestation
$10–$50
Decades
Biodiversity
Mature
Soil Carbon
$15–$50
Short-term
Agronomic benefits
Mature
What stands out is the permanence of rock weathering — it offers high-integrity carbon removal without the risk of reversal.
7. Current Research and Pilot Projects
Globally, organizations like UNDO (UK), Project Vesta (US), and Lithos Carbon (US) are conducting large-scale field trials. Some early learnings include:
-Fine particle size increases weathering speed
-Optimal pH and microbial activity boost CO₂ capture
-Yield gains create additional incentives for farmers
In India, few pilots are underway — mostly in Karnataka and Maharashtra, often piggybacking on regenerative agriculture or CSR programs. The current bottleneck? Lack of awareness, field-level deployment partners, and MRV (Monitoring, Reporting, Verification) frameworks.
This is where outreach-focused organizations like Anaxee can play a crucial role.
8. MRV for Rock Weathering: The Tech Challenge
Measuring how much CO₂ has been captured through rock weathering isn’t straightforward. It requires:
-Soil and water sampling – Bicarbonate concentrations, pH shifts
-Isotope tracing – Carbon isotopes to confirm geological origin
-Modeling weathering rates – Using geochemical software like PHREEQC
-Remote sensing and AI – For monitoring deployment and crop impact
Emerging dMRV platforms can help digitize this — using drone surveys, soil sensors, and machine learning to predict and verify CO₂ sequestration.
9. Policy and Carbon Market Integration
Enhanced rock weathering is already recognized by:
-IPCC as a negative emissions technology
-Puro.earth as a certifiable carbon removal methodology
-Verra is in the process of developing weathering protocols
-CCTS (India) can enable voluntary issuance in a co-benefit-linked framework
As India’s carbon market matures under Article 6.2 and 6.4, early projects in rock weathering can be positioned for future trading. Particularly if India adopts a separate track for durable carbon removals — as seen in the EU and US.
10. Risks and Criticism: A Balanced View
No solution is perfect. Rock weathering faces challenges:
-Dust inhalation – Crushed rocks need safe handling protocols
-Energy use – Crushing rocks consumes energy; needs renewable power
-Ecological impact – Mining new rock could harm ecosystems
-Measurement uncertainty – Requires sophisticated MRV, still evolving
Mitigation involves using mine tailings, renewable-powered crushing, and targeting degraded land for spreading.
11. What’s Next: The Road to Scale
Here’s how this can move from pilot to large-scale deployment in India:
Mapping basalt deposits – Government geological surveys + remote sensing
Farmer partnerships – Particularly in acidic-soil districts
Integration with CSR/NbS – Projects by corporates looking for removals
MRV stack development – With tech partners and carbon platforms
Carbon credit registration – Either with Verra, Gold Standard, or future Indian registries
Anaxee, with its rural last-mile capabilities and tech-enabled tracking, is well placed to be an execution partner in this new frontier.
Conclusion: Turning Rocks into a Climate Asset
Rock weathering represents the fusion of deep-time geology with cutting-edge climate science. It’s quiet, solid, and permanent- just like the rocks themselves. And it could turn India’s volcanic past into a climate-secure future.
As the carbon market shifts toward durable removals, enhanced rock weathering offers India a rare opportunity: to lead the world by deploying a homegrown, natural climate solution — quite literally — from the ground up.
About Anaxee:
Anaxee drives large-scale, country-wide Climate and Carbon Credit projects across India. We specialize in Nature-Based Solutions (NbS) and community-driven initiatives, providing the technology and on-ground network needed to execute, monitor, and ensure transparency in projects like agroforestry, regenerative agriculture, improved cookstoves, solar devices, water filters and more. Our systems are designed to maintain integrity and verifiable impact in carbon methodologies.
Beyond climate, Anaxee is India’s Reach Engine- building the nation’s largest last-mile outreach network of 100,000 Digital Runners (shared, tech-enabled field force). We help corporates, agri-focused companies, and social organizations scale to rural and semi-urban India by executing projects in 26 states, 540+ districts, and 11,000+ pin codes, ensuring both scale and 100% transparency in last-mile operations.
How Asia’s Largest Conglomerates Are Powering Net-Zero: What Indian Industry Can Learn from SK Group
1. Introduction: Why Look at SK Group Now?
As India rolls out the Carbon Credit Trading Scheme (CCTS) and more conglomerates declare net-zero ambitions, the real test lies in execution. Companies like Reliance, Adani, Tata, and JSW are making climate pledges—but who is already walking the talk?
South Korea’s SK Group is a compelling example. As the country’s second-largest conglomerate, SK is embedding climate strategy across its core businesses: energy, petrochemicals, renewables, and chemicals. While Indian corporates often silo green efforts into CSR or RE portfolios, SK’s model is integrated, time-bound, and strategic.
So, what can Indian industry learn from SK Group’s approach?
2. Who is SK Group?
-SK Group is South Korea’s 2nd-largest chaebol (business group) with over $130 billion in revenue.
-Its subsidiaries include SK Innovation (energy), SK E&S (clean energy), SK Chemicals, and SK Hynix (semiconductors).
– The group has pledged to achieve net-zero across operations and value chains.
SK is actively investing in clean tech, hydrogen, circular economy models, and low-carbon product lines, with a clear short-, medium-, and long-term roadmap.
3. What SK Group Is Doing: A Sectoral and Time-Frame Breakdown
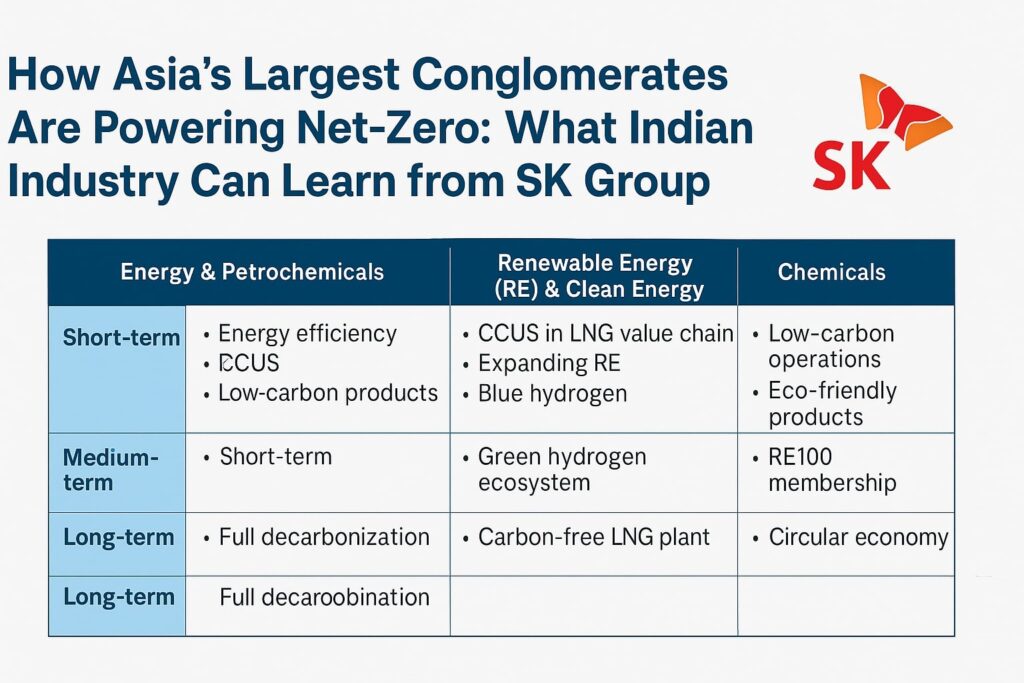
The group’s strategy can be summarized as a three-horizon play across three sectors:
A. Energy & Petrochemicals
Short-Term
-Improving energy efficiency
-Scaling renewable energy (RE)
-Developing low-carbon petrochemical products
-Driving EV battery production
Medium-Term
-Investing in green hydrogen production
-Deploying carbon capture, utilization, and storage (CCUS)
-Circular economy integration in energy flows
Long-Term
-Full decarbonization of the value chain
-Becoming a green materials and energy provider
-Mass adoption of hydrogen and net-zero fuels
B. Renewable Energy & Clean Energy
Short-Term
-CCUS integration in LNG value chains
-Expanding RE infrastructure (solar, wind)
-Producing blue hydrogen
Medium-Term
-Developing green hydrogen and supporting hydrogen ecosystems
-Purchasing nature-based carbon credits to offset hard-to-abate emissions
Long-Term
-Setting up carbon-free LNG power plants
-Becoming a global clean energy leader
C. Chemicals
Short-Term
-Eco-friendly production
-GHG reduction in chemical manufacturing
Medium-Term
-RE100 membership for SK Chemicals
-Eco-friendly copper foil production for electronics
Long-Term
-Circular economy model for the entire chemicals division
4. What Makes This Strategy Unique
Unlike many companies that treat ESG as a reporting obligation, SK Group:
-Aligns climate goals with core business profitability.
-Sets clear internal timelines across sectors.
-Integrates nature-based solutions (carbon credits) with tech-based decarbonization.
-Champions hydrogen not only as fuel but as a system-wide solution across transport, energy, and chemicals.
It’s a whole-of-conglomerate playbook. And India needs more of these.
5. What Indian Conglomerates Can Learn
Conglomerate
Current Climate Moves
SK-Inspired Action Plan
Reliance
Green hydrogen, net-zero by 2035
Add CCUS for petrochemicals, circular economy pilot
Adani
Solar parks, green ammonia
Commit to full value chain decarbonization
Tata
EVs, Tata Power RE projects
Unify sustainability and clean energy under one umbrella
Vedanta
Fragmented ESG reporting
Create sector-specific green roadmaps
6. CCTS & Indian Climate Policy Context
India’s new CCTS mechanism demands verified emission reductions from industrial players. Like Korea’s ETS, it will pressure conglomerates to:
-Set internal carbon prices
-Plan abatement trajectories
-Explore offsetting through credits (RE, NbS, etc.)
SK’s nature-based carbon credit strategy is a signal that even large industrial groups see value in blending abatement + offsets.
7. Role of Anaxee: Tech for Climate
Anaxee can:
-Provide dMRV solutions for conglomerates investing in nature-based offset projects
-Enable traceable biomass supply chains for co-processing or CCUS feedstock
-Partner on verification frameworks aligned with CCTS
8. Conclusion: From Talk to Transformation
Indian conglomerates don’t lack intent—but they lack structured execution plans. SK Group shows that it’s possible to:
-Align business growth with decarbonization
-Integrate climate into capex, product, and policy strategy
-Leverage both nature-based and tech-based solutions
As CCTS takes off in India, SK Group’s three-horizon roadmap can inspire India Inc. to move from climate pledges to climate leadership.
About Anaxee:
Anaxee drives large-scale, country-wide Climate and Carbon Credit projects across India. We specialize in Nature-Based Solutions (NbS) and community-driven initiatives, providing the technology and on-ground network needed to execute, monitor, and ensure transparency in projects like agroforestry, regenerative agriculture, improved cookstoves, solar devices, water filters and more. Our systems are designed to maintain integrity and verifiable impact in carbon methodologies.
Beyond climate, Anaxee is India’s Reach Engine- building the nation’s largest last-mile outreach network of 100,000 Digital Runners (shared, tech-enabled field force). We help corporates, agri-focused companies, and social organizations scale to rural and semi-urban India by executing projects in 26 states, 540+ districts, and 11,000+ pin codes, ensuring both scale and 100% transparency in last-mile operations.
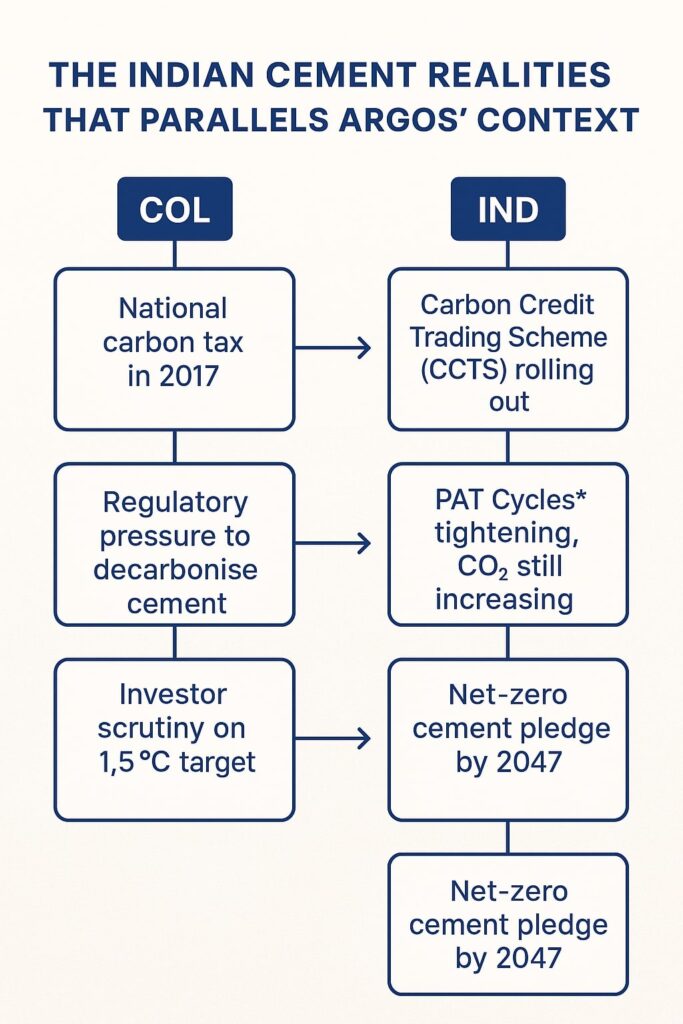
1. Why Look at Colombia When India Has Its Own Carbon Rules?
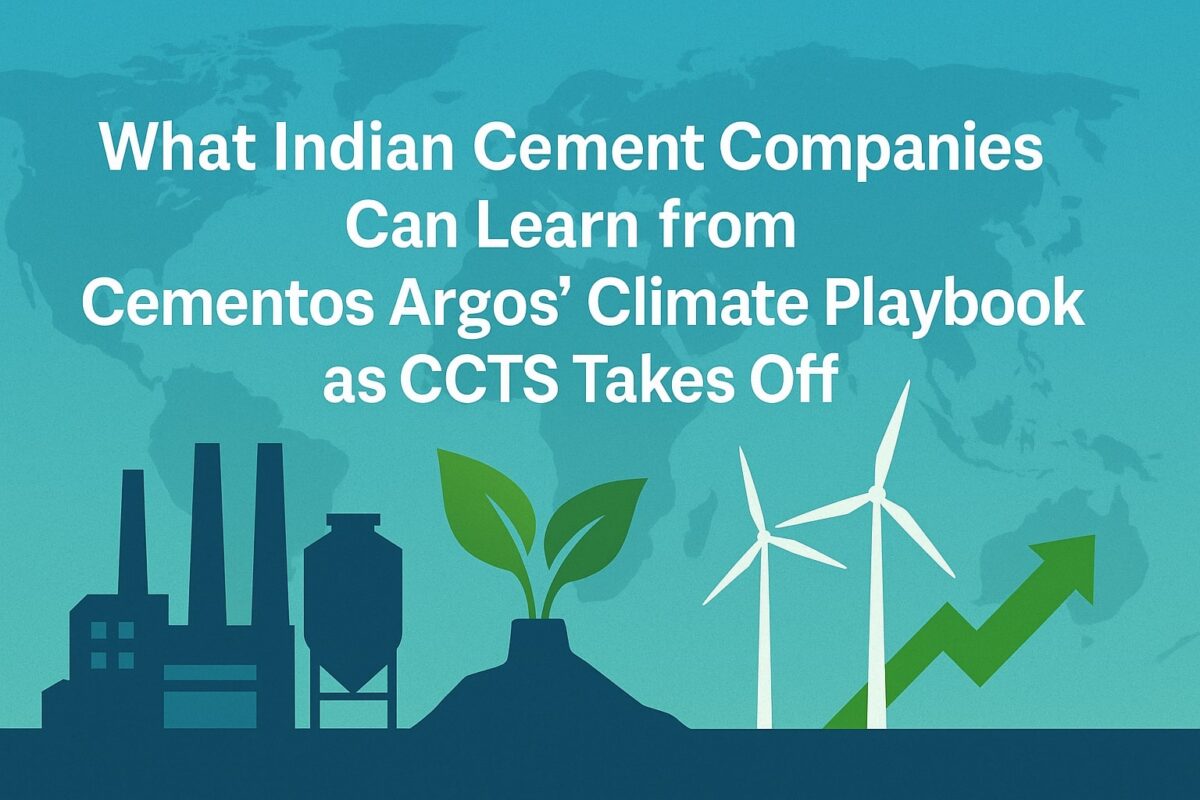
You could say Colombia and India are worlds apart. Yet Cementos Argos—Colombia’s largest cement maker—faced the same crossroads Indian producers meet today:
–A national carbon tax in 2017 and plans for an Emissions Trading System (ETS).
-Rising investor pressure for 1.5 °C‑aligned targets.
-Customers asking for greener cement.
India is now rolling out the Carbon Credit Trading Scheme (CCTS) and tightening PAT cycles. If Colombian cement could get ahead of regulation, why can’t we?
2. What Exactly Did Cementos Argos Do?
Response Box on Slide
Real‑World Action
Evidence
“Began preparing before obligations were finalised”
Ran internal scenario workshops in 2016 while the carbon‑tax bill was still in Congress
-Piloting carbon capture with Nuada under GCCA Innovandi.
-Low‑clinker ‘EcoStrong PLC’ cement in North America—clinker ratio cut from 89 % to 80 % in two years.
3. Where Does India Stand? A Quick Reality Check
-CCTS: Notification issued 2023; methodologies approved March 2025. Nine sectors—including cement—will face intensity targets first, then a cap‑and‑trade regime.
-PAT Cycle‑III results: Energy savings good, yet absolute CO₂ keeps rising as demand grows.
-Net‑zero pledge: 2070 for India, 2050 for many listed cement majors. Roadmap from GCCA‑India & TERI sets interim goal of net‑zero cement by 2047.
Bottom line? The rulebook is being written now—exactly the window Argos exploited.
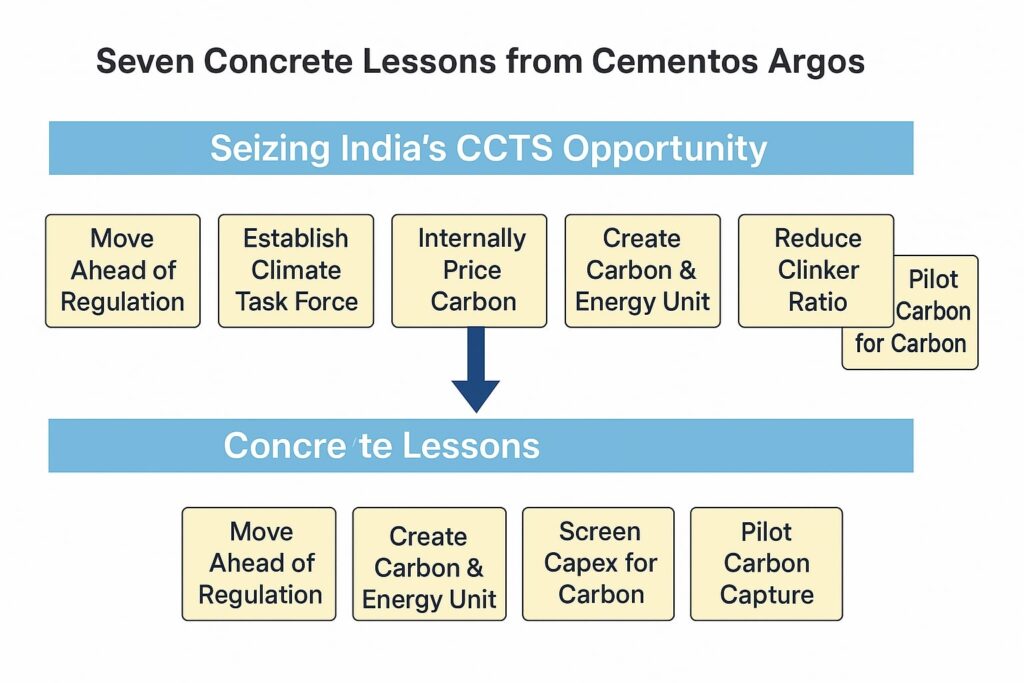
4. Seven Concrete Lessons for Indian Producers
4.1 Move Before the Hammer Falls
Argos started compliance prep one full year before the Colombian carbon‑tax rate was fixed. Indian firms can:
-Simulate CCTS penalties at INR 1 000–2 000/t CO₂.
-Run pilot MRV systems—don’t wait for Bureau of Energy Efficiency manuals.
4.2 Build a Cross‑Functional Climate Task Force
Siloed CSR teams won’t cut it. In Argos the Task Force links finance, operations, R&D and marketing; that integration drove faster decision‑making. Replicate with a chairperson reporting straight to the COO.
4.3 Put a Price on Carbon—Internally
Even a low shadow price disciplines investment. Start modest (say, INR 500/t) and ratchet up yearly. Use it to rank kiln upgrades, waste‑heat recovery, and alternative‑fuel retrofits.
4.4 Institutionalise a Carbon & Energy Unit
Data quality is India Inc.’s Achilles heel. A dedicated unit ensures:
-Plant‑level dashboards for clinker ratio, fuel mix, specific heat consumption.
-Alignment with ISO 14064 or GHG Protocol for audits.
4.5 Slash Clinker—Fast
Calcined clay, slag, and limestone fillers lowered Argos’ clinker factor. Indian context:
-Calcined clay: Abundant in Gujarat and Jharkhand.
-Granulated blast‑furnace slag: Tata Steel and JSW supply.
-Fly ash: Still ample despite coal‑plant phase‑down.
4.6 Treat Cap‑Ex as Climate‑Ex
Argos vetoed high‑carbon retrofits once carbon price went into the NPV. Indian boards should set a rule: “Projects above INR 50 crore must clear internal carbon hurdle.”
4.7 Bet on Carbon Capture Pilots
CCUS may feel distant, yet early pilots lock learning curves. Partner with Innovandi, IISc or BHEL‑NTPC JV for cement‑flue capture test rigs.
5. Deep Dive—Applying the Lessons Plant‑by‑Plant
Plant Archetype
Typical Indian Scenario
Argos‑Style Play
Quick Win
Legacy Wet‑Process
1970s kilns, high heat rate
Scrap wet line, install modern pre‑heater/pre‑calciner; justify with shadow carbon price
15 % fuel cut
Integrated Dry Kiln + WHR
UltraTech‑type mega plants
Co‑processing RDF, biomass; sign green‑power PPAs
100 kg CO₂/t cut
Standalone Grinding Unit
Imports clinker from parent plant
Push PLC (Portland Limestone Cement) or PSC blends; market as “low‑carbon”
-CCTS Early‑Action Credits – Projects completed after Jan 2023 may qualify.
-Green Finance – SEBI’s new disclosure rules nudge lenders to favour low‑carbon CapEx.
-Production‑Linked Incentive (PLI) for Green Hydrogen – Opens door to hydrogen kiln pilots like Argos’.
-State RDF Mandates – Tamil Nadu & Rajasthan already require minimum RDF substitution in kilns.
Use them or lose them.
7. What Role Can Anaxee Play?
Anaxee’s last‑mile network can:
dMRV: Provide digital MRV for biomass supply chains to meet co‑processing traceability.
Community Biomass Aggregation: Aggregate agri‑waste for RDF or bio‑char feedstock.
Carbon‑Credit Origination: Package early‑action projects for voluntary market sales before CCTS kicks in fully.
8. Frequently Asked Questions
Q1. Will internal carbon pricing hurt profitability? Short term maybe, long term it prevents stranded assets.
Q2. Isn’t CCUS too expensive? Pilot scale costs are falling. Early movers get learning subsidies and first‑mover brand value.
9. The Road Ahead-A 12‑Month Checklist
Month
Action
Owner
1‑2
Form Climate Task Force
MD & HR
2‑3
Issue internal carbon‑pricing memo
CFO
3‑6
Audit clinker factors & fuel mix
Plant Heads
4‑8
Identify one low‑clinker product line
R&D
6‑9
Sign MoU for CCUS pilot
BD & Tech
9‑12
File early‑action credit documents under CCTS
Sustainability
10. Conclusion
Cementos Argos shows climate leadership is not an NGO talking point—it’s a profit‑shield in a carbon‑priced world. With CCTS already gazetted, Indian cement majors that copy Argos’ playbook today will dodge compliance shocks, capture green‑product premiums tomorrow, and—frankly—outrun the laggards.
Carbon markets face a credibility crunch. Manual MRV is slow, costly and prone to error. Digital MRV (dMRV) promises transparent, near‑real‑time proof of impact—yet many solutions lack on‑ground validation at scale. Anaxee Digital Runners bridges this gap with a 40,000‑member field force synced to an AI‑driven data cloud, slashing verification costs by up to 70 % while empowering smallholders across 120,000 Indian villages.
1 The Trust Deficit in Carbon Markets
By 2025 the voluntary carbon market (VCM) surpassed USD 2.1 billion in annual value. Yet credibility lags. A 2024 Guardian investigation found that nearly 30 % of issued credits showed overstated impact or dubious baselines. Corporations—fearful of greenwashing headlines—now demand bulletproof data trails.
Traditional MRV, built on sporadic field visits and manual paperwork, simply cannot meet today’s expectations for timeliness, granularity or transparency. Verification invoices often exceed USD 6–8 per tCO₂e for small projects, eroding developer margins.
dMRV has emerged as the antidote: integrate satellites, sensors and secure ledgers to automate evidence gathering. But technology alone does not solve the “ground truth” gap—the need to confirm that what the pixels show, actually exists.
Digital Measurement, Reporting & Verification (dMRV) layers tech across the classic MRV triad.
Pillar
Digital Enhancer
Examples
Measurement
Remote sensing, drones, IoT
Sentinel‑2 imagery; smart stove meters
Reporting
Cloud dashboards, APIs
JSON data feeds to Verra’s Climate Check
Verification
Immutable ledgers, AI anomaly detection
Hyperledger‑fabric records; ML leakage alerts
Key Standards to Know
-D‑VERA: Digital Guidance under Verra’s VM0047 methodology.
-Gold Standard Digital MRV Sandbox: Fast‑track protocols for tech‑enabled projects.
-ISO 14 064‑1:2023: Introduces digital data assurance clauses.
Tip for developers: Align your data schema with emerging open‑source ontologies like dMRV‑O to future‑proof registry integration.
3. Anaxee’s Origin Story: From Digital KYC to Climate KYC
Founded in 2016, Indore‑based Anaxee Digital Runners originally performed doorstep KYC verifications for banks and telecoms. By 2020 the company had assembled India’s largest gig‑enabled field network—Digital Runners—covering every second village.
In the same period, climate developers struggled to monitor dispersed assets such as agroforestry plots or rural cook‑stoves. Anaxee spotted the adjacency: replace KYC forms with “Climate KYC” tasks—geotagged photos, sapling girth measurements, sensor swaps—synced via the existing mobile app.
Pivot Year (2021): Anaxee signed its first carbon client—a 5,000‑ha bamboo agroforestry venture in Madhya Pradesh. The pilot cut verification time from 14 months to 6 months, attracting more projects and sparking a dedicated Climate Tech division.
4 Building the Tech Stack: Acquisition → Processing → Ledger → Insights
4.1 Data Acquisition Layer
Satellites – 10‑m Sentinel‑2 and PlanetScope streams ingested via AWS Open‑Data.
Drones – Hire‑per‑day VTOL drones capture <5 cm ortho‑mosaics for baseline plots.
Mobile Surveys – Runner app enforces photo+video evidence with AI on‑device QC.
4.2 Processing Layer
-AI Biomass Engine – CNN models classify tree species & diameter at crown spread with 92 % precision. -Leakage Detector – Multi‑temporal NDVI change triggers human audit within 72 h. -Sensor QA/QC – Dual‑channel median filters catch drift; flagged outliers auto‑dispatch a Runner.
4.3 Ledger Layer
-Hyperledger Fabric – Permissioned consortium chain co‑run with registry auditors. -IPFS Storage – Stores raw imagery hashes for audit reproducibility.
4.4 Insights Layer
–Custom dMRV Dashboard: Climate KPIs, geospatial heatmaps, CO₂e ticker. -API Kit: Plug‑and‑play endpoints for Verra, Gold Standard, SAP Sustainability Control Tower.
5. Human‑in‑the‑Loop: Why Last‑Mile Validation Still Matters
Purely remote dMRV solutions often stumble on:
-Occult Tree Loss – Under‑storey sapling mortality invisible to satellites.
-Device Tampering – Stove users might remove SIM modules to save power.
Anaxee’s Digital Runners close these gaps:
-Presence Proof – Runners geotag each sapling, capturing 360° imagery.
-Sensor Integrity – Monthly field visits include QR‑coded photos, preventing ghost devices.
Each Runner earns ₹25–40 per task, converting idle time into income while ensuring data fidelity.
6. Navigating the Regulatory Maze: Article 6, NAPCC & Beyond
6.1 Article 6 of the Paris Agreement
UN supervisory bodies have signalled that digital reporting templates will become default. Anaxee’s ledger design aligns with the Article 6 Information Matrix, mapping every credit to a unique digital asset.
6.2 India’s National Action Plan on Climate Change (NAPCC)
Eight sub‑missions now encourage digital transparency. Anaxee’s APIs feed directly into the National Carbon Registry sandbox run by the Ministry of Environment.
6.3 Data Privacy & Security
Compliant with DPDP Act 2023: personal identifiers are tokenised; only statistical aggregates leave India’s borders.
7 Case Studies
7.1 Agroforestry & Trees‑Outside‑Forests (TOF)
-Location: Vidarbha, Maharashtra.
-Scale: 18,400 farmers, 11,900 ha.
-dMRV Edge: 3.2 million tree crowns mapped; Runner spot‑checks confirm 97 % model accuracy.
-Outcome:125,000 credits issued at USD 9/tCO₂e, 68 % cost reduction vs manual MRV.
7.2 Clean Cooking & LPG Shift
-Households: 64,000 rural homes, Madhya Pradesh.
-Tech: GPRS stove meters; UPI micro‑payments.
-Impact: 1.7 tCO₂e avoided per home. Verification cycle compressed to quarterly, enabling rolling issuances.
8. Cost–Benefit Analysis: dMRV vs Legacy MRV
Metric
Manual MRV
Anaxee dMRV
Delta
Verification Cost (USD/ha/yr)
14.5
4.2
−71 %
Issuance Lag (months)
14
5
−64 %
Auditor Site Visits
2/year
Remote + 0.3 on‑site*
−85 %
Farmer Revenue Share
51 %
68 %
+17PP
*Average across 2024 projects.
9. Scaling Internationally: Kenya, Brazil & The Franchise Model
Kenya Pilot (2024): Partnered with local NGO to recruit 2,200 “Runner‑Lites” mapping agro‑pastoral land. API integration with Africa Carbon Exchange.
Brazil Pilot (2025): Mato Grosso regenerative cattle project. LoRa sensors on herd collars track methane proxies; Runner franchise handles sensor upkeep.
Shift to energy‑harvesting IoT chips; Runner‑triggered battery swap alerts.
AI Bias on Minor Species
Incorporate spectral libraries from ICAR & Kew Gardens; active‑learning loops.
Data Sovereignty Jurisdictions
Deploy sovereign cloud nodes via Azure Arc.
Scaling Runner Quality
Gamified training app; quarterly certification exams.
Upcoming Features (H2 2025):
-Zero‑Knowledge MRV Proofs for privacy‑preserving validation.
-Generative AI dashboards auto‑explain anomalies to auditors.
-Tokenised Credit Marketplace enabling T+1 settlement for smallholders via CBDC‑compatible rails.
11 Conclusion: A Call for Collaborative Climate Infrastructure
Carbon markets cannot thrive on blind faith. They demand infrastructure of trust—transparent, verifiable and inclusive. Anaxee Digital Runners has demonstrated that the fusion of satellites, sensors and a human mesh network can deliver that trust at scale, putting more revenue into the hands of the rural communities who steward our planet’s carbon sinks.
Whether you are a corporate sustainability head, a registry auditor, or a project developer seeking scale, Anaxee’s dMRV playbook offers a proven path forward.
About Anaxee:
Anaxee is India’s Reach Engine! we are building India’s largest last-mile outreach network of 100,000 Digital Runners (shared feet-on-street, tech-enabled) to help Businesses and Social Organizations scale to rural and semi-urban India, We operate in 26 states, 540+ districts, and 11,000+ pin codes in India. We Help in last-mile execution of projects for (1) Corporates, (2) Agri-focused companies, (3) Climate, and (4) Social organizations. Using technology and people on-the-ground (our Digital Runners), we help in scale and execute projects across 100s of cities and bring 100% transparency in groundwork. We also work in the Tech for Climate domain, providing technology for the execution and monitoring of Nature-Based (NbS) and Community projects. Our technology & processes bring transparency and integrity into carbon projects across various methodologies (Agroforestry, Regen Agriculture, Solar devices, Improved Cookstoves, Water filters, LED lamps, etc.) worldwide.
Digital MRV (dMRV) is reshaping how carbon projects are measured and verified. India‑born Anaxee Digital Runners has built the country’s largest last‑mile data network, marrying human reach with satellite, sensor and AI workflows to cut verification costs by up to 70 % while speeding credit issuance by months. This in‑depth guide explores dMRV fundamentals, the global pivot to digitisation, India’s unique opportunity, and real‑world case studies of how Anaxee delivers trust and scale.
1. Introduction: The Race for Credible Carbon Data
The global carbon market crossed USD 1 trillion in traded value in 2024, yet more than one‑third of credits were flagged for quality concerns. Investors, corporates and regulators now demand evidence‑based impact before they will buy, retire or account for a tonne of CO₂e. Traditional monitoring, reporting and verification (MRV) models – clipboards, paper forms, sporadic field visits – simply can’t keep up. Enter digital MRV (dMRV): a technology‑driven framework that streams geospatial, sensor and human‑validated data in near real‑time, automates analytics and slashes subjectivity.
If MRV was the carbon market’s “trust but verify” mantra, dMRV upgrades it to “trust because you can verify at any time.” For climate projects operating across thousands of villages and hectares, the difference is transformative: lower verification costs, faster credit issuance and, most importantly, heightened credibility in the eyes of buyers and auditors.
In this long‑form guide (≈4,000 words), we unpack what dMRV really means, why it is rapidly becoming the new norm, and how Anaxee Digital Runners – an Indore‑based deep‑tech company – has emerged as a trailblazer powering India’s most ambitious nature‑based and household‑level carbon projects.
2. MRV vs dMRV –
A Quick Primer Measurement, Reporting & Verification (MRV) dates back to the Kyoto Protocol. It prescribes that every carbon project must:
Measure baseline emissions and subsequent reductions or removals.
Report findings in an auditable format.
Verify data through a third‑party accredited body.
While robust in principle, legacy MRV workflows rely heavily on manual sampling and periodic site visits. A 2024 study by the LSE Grantham Institute estimated that up to 20 % of project costs can be swallowed by MRV overheads.
Enter dMRV
Digital MRV layers modern tech on top of the three pillars:
-Remote sensing & drones to capture canopy height, biomass and land‑use change.
-IoT sensors (soil probes, smart cook‑stove meters) for continuous data feeds.
-Machine learning to convert raw pixels and sensor noise into emissions factors.
-Blockchain or distributed ledgers for tamper‑proof records and transparent audit trails.
Key stat: A Gold Standard working group found that dMRV can cut verification costs by 40–70 % and compress credit issuance cycles by up to 12 months.
With market mechanisms like Article 6 of the Paris Agreement demanding ever faster, globally comparable data, dMRV is gaining near‑mandatory status.
3. Why dMRV Matters to the Voluntary & Compliance Carbon Markets
3.1 Speed
Faster verification means carbon revenues hit project developers’ accounts sooner, improving cash flow and enabling reinvestment in community benefits.
3.2 Accuracy & Integrity
Continuous monitoring reduces the risk of over‑ or under‑crediting. Transparent, tamper‑proof data logs improve buyer confidence and comply with stringent registries.
3.3 Scale
With automated analytics, a single verifier can oversee dozens of projects simultaneously, unlocking economies of scale previously impossible.
3.4 Equity
Lower transaction costs open the door for smallholder farmers, village bodies and micro‑entrepreneurs to participate in carbon markets – a game‑changer for rural economies.
4. The Global dMRV Landscape in 2025 From Silicon Valley start‑ups to UN‑backed think tanks, the race to build ‘infrastructure for trust’ is heating up.
Region
Notable Players
Signature Tech
Focus Sector
North America
Pachama, Regrow Ag
LiDAR + AI Forest Models
Forestry & Agriculture
Europe
Sylvera, Climate Trace
Satellites + ML
Global MRV Scoring
Africa
BURN Manufacturing
Smart‑metered cook‑stoves
Household Energy
Asia
Green Carbon, Netra Tech
Methane Sensors + Blockchain
Rice & Blue Carbon
India is fast emerging as the largest testbed for scalable dMRV, thanks to its vast rural landscapes, smartphone penetration and proactive policy support.
5. India’s Moment: Policy, Demand & Innovation
National Green Credit Programme (2023) – incentivises biodiversity, water conservation and carbon sequestration projects, all requiring stringent MRV.
Startup India & Digital Public Goods – zero‑rating of GST on carbon credits and sandboxes for climate‑tech pilots.
Corporate Net‑Zero Rush – Over 160 Indian companies have SBTi‑approved targets, driving demand for high‑quality local credits.
Combined, these forces make India ground zero for dMRV experimentation – and Anaxee sits squarely at the intersection of tech capability and last‑mile reach.
6. Meet Anaxee:
India’s Largest Last‑Mile Climate Data Infrastructure Founded in 2016, Anaxee Digital Runners began as a distributed field‑data platform for banks and FMCG giants. Today, its 40,000‑strong ‘Digital Runners’ network covers 26 states, 7,000+ pin codes and 120,000 villages, making it India’s deepest boots‑on‑the‑ground data operation.
6.1 Core Strengths
-Human + Digital Hybrid: Runners validate satellite insights with geo‑tagged photos, ensuring on‑ground reality matches remote sensing output.
-Real‑Time Data Pipelines: A cloud dashboard visualises every tree, stove or sensor in near real‑time for project owners and auditors.
-Local Empowerment: Village‑level micro‑entrepreneurs earn revenue for each data task, injecting income into rural economies.
Transparency for corporates, registries, communities
Strategic tie‑ups with ISRO’s Bhuvan Portal and Azure FarmBeats provide high‑resolution imagery and agronomic models, while an MoU with IIT Kharagpur advances AI species‑classification.
-Area: 12,000 ha across 45 villages in Maharashtra.
-Data Points: 2.8 million trees monitored via UAV + mobile app surveys.
-Outcome: Verification cost ₹52/ha/year vs ₹380 in manual MRV; first 50,000 credits issued in 11 months (70 % faster).
8.2 Clean Cooking for Tribal Households
-Scale: 60,000 smart‑metered LPG connections in Madhya Pradesh.
-dMRV Edge: Burner‑level sensors push usage data every 30 minutes, validated by monthly Runner visits.
-Impact: Average 1.6 tCO₂e avoided per household per year; credit payments disbursed via UPI.
8.3 Mangrove Restoration, Sundarbans Delta
-Area: 3,500 ha degraded coastline.
-Tech: Sentinel‑2 NDVI change detection + community photo transects.
-Projected Benefit: 1.2 million tonnes CO₂e removed over 30 years; blue‑carbon warrant enables upfront financing.
9. Overcoming dMRV Challenges – Data Quality, Leakage & Permanence
-Sensor Drift & Calibration – Anaxee installs dual sensors per site and cross‑checks against Runner‑captured readings.
-Leakage Detection – Geofenced alerts flag land‑use change in buffer zones within 72 hours for corrective action.
-Permanence Risk – Parametric insurance via blockchain smart contracts auto‑pays for replanting if cyclones or fires are detected.
-Data Privacy – Differential‑privacy algorithms anonymise household‑level data while preserving aggregate accuracy.
10. Future Outlook: Article 6, Tokenisation & AI Automation
-Article 6 Trust Layer: With UN supervisory bodies signalling digital reporting templates, Anaxee’s modular APIs are Article 6‑ready.
-Instant Settlement: Tokenised credits on public‑permitted chains enable near‑instant payouts to smallholders.
-AI‑First MRV: Multispectral AI models will auto‑identify species and growth anomalies, enabling predictive maintenance of carbon assets.
-Global Expansion: Pilot projects in Kenya and Brazil leverage partner Runner networks under a franchise model.
11. Conclusion & Call to Action:
The carbon market is no longer just about planting trees or switching fuels; it’s about proving, continuously and transparently, that those interventions work. Digital MRV is the engine of that proof, and Anaxee has built a uniquely Indian – and globally relevant – engine room.
Whether you are a corporate chasing net‑zero, a project developer seeking scale, or an investor hungry for verifiable impact, Anaxee Digital Runners offers the people, platform and proof to deliver high‑integrity credits at speed.
Anaxee is India’s Reach Engine! we are building India’s largest last-mile outreach network of 100,000 Digital Runners (shared feet-on-street, tech-enabled) to help Businesses and Social Organizations scale to rural and semi-urban India, We operate in 26 states, 540+ districts, and 11,000+ pin codes in India. We Help in last-mile execution of projects for (1) Corporates, (2) Agri-focused companies, (3) Climate, and (4) Social organizations. Using technology and people on-the-ground (our Digital Runners), we help in scale and execute projects across 100s of cities and bring 100% transparency in groundwork. We also work in the Tech for Climate domain, providing technology for the execution and monitoring of Nature-Based (NbS) and Community projects. Our technology & processes bring transparency and integrity into carbon projects across various methodologies (Agroforestry, Regen Agriculture, Solar devices, Improved Cookstoves, Water filters, LED lamps, etc.) worldwide.
Teaching Calculations: Emission Accounting for Scope 1 & Scope 2
When most sustainability manuals explain greenhouse‑gas (GHG) accounting, they bury you in jargon before getting to the numbers. This article flips the script. We focus squarely on Scope 1 and Scope 2 calculations, walking line‑by‑line through real‑world data sets from four Indian sectors:
Cement manufacturing (heavy industry)
Cloud data centre (service + power intensive)
Bottled beverages plant (FMCG)
Textile dyeing mill (SME)
For each case study we share raw activity data, pick the right emission factors, crunch the numbers, and reflect on what the results actually mean for management. All examples use FY 2024‑25 data, Indian grid factors, and IPCC Fifth Assessment defaults unless stated otherwise.
Note for beginners – We assume you already know what Scope 1 and Scope 2 are. If not, jump over to our previous primer on GHG boundaries, then hop back here for the math.
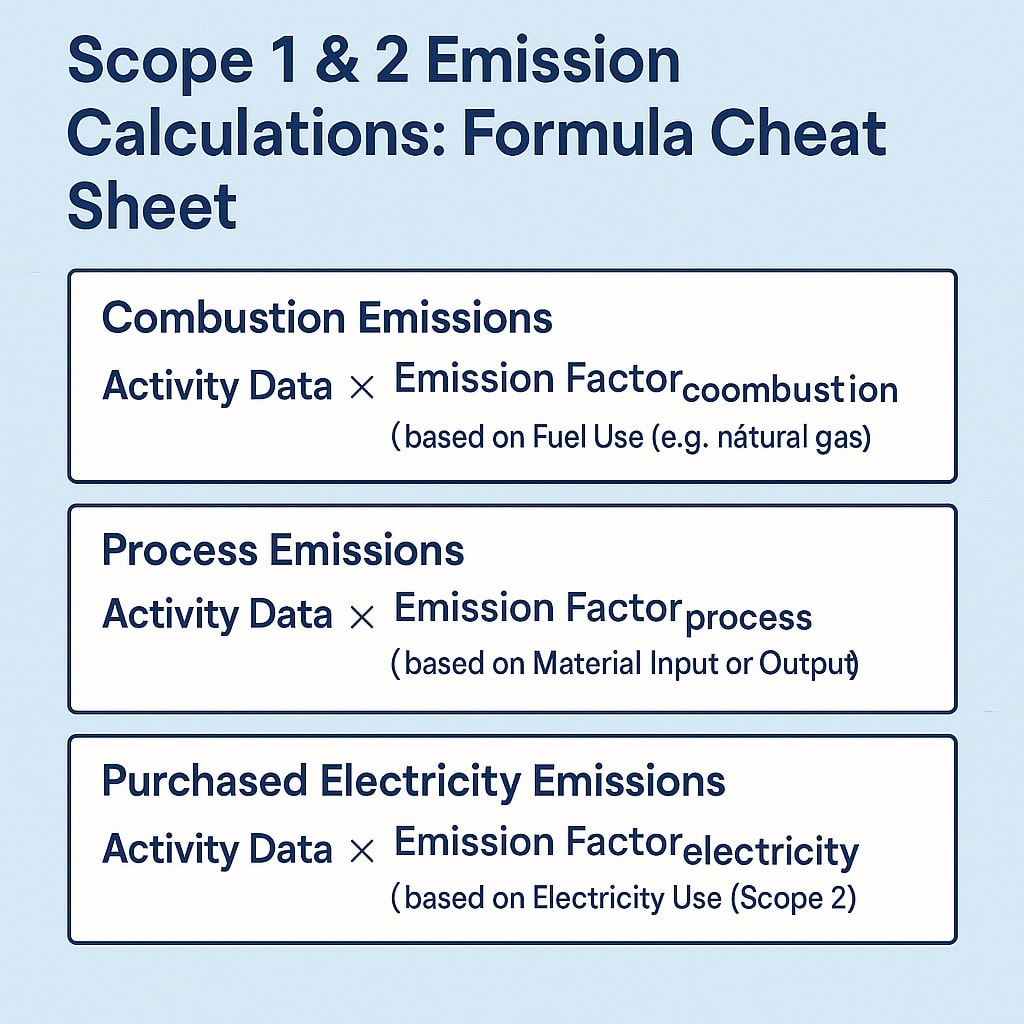
1. The Calculation Cheat‑Sheet
Before diving into sector specifics, let’s frame the generic formulas:
CH₄ and N₂O for fossil‐fuel combustion are normally added as CO₂‑equivalent using their global‑warming potentials (GWPs). We keep them visible in the cement example so you see the mechanics.
Quick tip – Always store ➞ unit conversions in a corner of your spreadsheet: 1 litre diesel ≈ 0.832 kg; 1 kg natural gas ≈ 1.25 scm (depends on calorific value).
2. Case Study 1 – Cement Plant in Andhra Pradesh
2.1 Activity Data Snapshot (FY 2024‑25)
Activity
Unit
Quantity
Diesel for quarry trucks
L
2,500,000
Coal for kiln
t
135,000
Grid electricity
kWh
78,000,000
On‑site WHR* electricity
kWh
12,000,000
*WHR = waste‑heat recovery. Electricity from WHR is counted as zero‑carbon internal generation, not grid purchase.
2.2 Emission Factors Selected
-Diesel: 2.68 kg CO₂/L (IPCC default)
-Coal: 2.42 t CO₂/t (bituminous, India average)
-Grid EF (Southern grid, CEA 2024): 0.72 kg CO₂/kWh
2.3 Scope 1 Calculation – Diesel & Coal
Diesel (mobile)
2,500,000 L × 2.68 kg CO₂/L = 6,700,000 kg CO₂ ≈ 6,700 t
78,000,000 kWh × 0.72 kg CO₂/kWh = 56,160,000 kg = 56,160 t
Scope 2 location‑based: 56,160 t CO₂
No market‑based certificates were purchased, so the market‑based number is the same.
2.5 What Management Learned
– Kiln coal dominates (97 % of Scope 1). Even a 5 % thermal‑efficiency improvement would shave 16,000 t CO₂.
– Switching quarry trucks from diesel to electric would cut ~6,700 t—small in percentage terms but big PR value.
– Installing an extra 8 MW WHR turbine could offset another 40 GWh grid power, saving 28,800 t Scope 2.
3. Case Study 2 – Tier‑III Data Centre, Bengaluru
3.1 Activity Data
Activity
Unit
Quantity
Grid electricity (including cooling)
kWh
42,000,000
Diesel for back‑up generators
L
420,000
3.2 Factors
-Bangalore BESCOM grid EF 2024: 0.79 kg CO₂/kWh
-Diesel EF: 2.68 kg CO₂/L
3.3 Scope 2 First (because it is huge)
42,000,000 × 0.79 = 33,180,000 kg = 33,180 t
3.4 Scope 1 Back‑up Diesel
420,000 L × 2.68 = 1,125,600 kg = 1,126 t
3.5 Outcome & Actions
-Electricity is 30× bigger than diesel. The company signed a 25‑year solar Open‑Access PPA for 30 GWh/yr.
-Market‑based Scope 2 will drop from 33,180 t to roughly 3,318 t once RECs are matched 90 % of the year.
-Diesel gensets run only 80 hours/year. Replacing with li‑ion battery UPS would also reduce Scope 1 spikes during testing.
4. Case Study 3 – Beverage Bottling Plant, Maharashtra
4.1 Activity Data
Activity
Unit
Quantity
LPG for boilers
t
1,200
Purchased steam from neighbour CHP
t steam
85,000
Grid electricity
kWh
18,500,000
4.2 Factors
-LPG EF: 3.00 t CO₂/t LPG (WTT included)
-Steam supplier EF (metered): 0.25 t CO₂/t steam
-Western grid EF 2024: 0.78 kg CO₂/kWh
4.3 Calculations
LPG (Scope 1)
1,200 t × 3.00 = 3,600 t
Purchased Steam (Scope 2 – heat)
85,000 t × 0.25 = 21,250 t
Grid Electricity (Scope 2 – power)
18,500,000 kWh × 0.78 kg/kWh = 14,430 t
4.4 Result Summary
Scope
t CO₂e
1
3,600
2 (power)
14,430
2 (steam)
21,250
Total Scope 2
35,680
Purchased steam is the surprise hotspot. Management is negotiating to co‑locate a biomass boiler that would slash Scope 2 by 70 %.
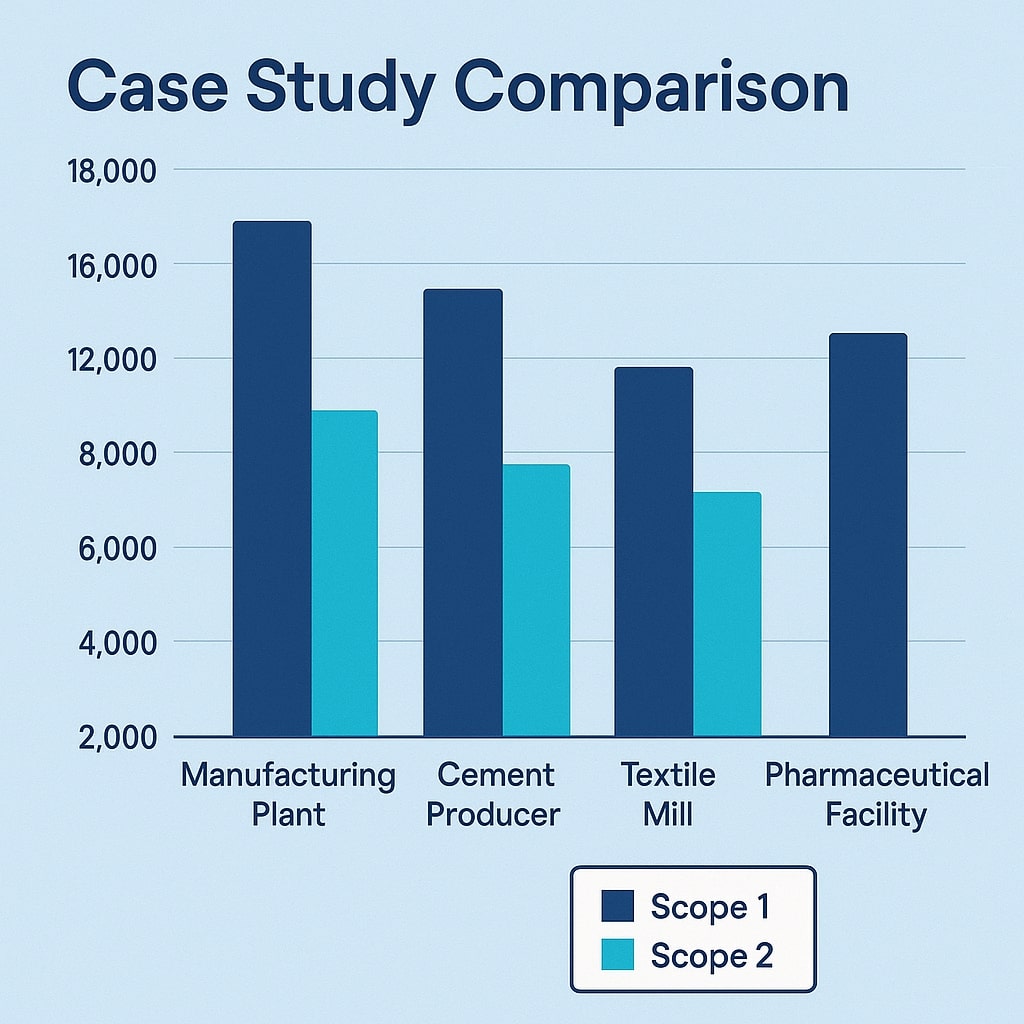
5. Case Study 4 – Textile Dyeing Mill, Tamil Nadu
5.1 Activity Data
Activity
Unit
Quantity
Furnace oil
L
600,000
Grid electricity
kWh
9,600,000
5.2 Factors
-Furnace oil EF: 3.12 kg CO₂/L
-TN grid EF 2024: 0.69 kg CO₂/kWh
5.3 Calculations
Scope 1: Furnace Oil
600,000 L × 3.12 kg/L = 1,872,000 kg = 1,872 t
CH₄, N₂O negligible (<1 %).
Scope 2: Grid Power
9,600,000 kWh × 0.69 kg/kWh = 6,624,000 kg = 6,624 t
5.4 Insights
-Although a small SME, electricity is 3.5× larger than oil. Rooftop solar (2.5 MWp) can offset ~4,000 t Scope 2.
Scope 1 vs Scope 2 Bar Chart
-Switching from furnace oil to LPG reduces both CO₂ and local particulates—useful for compliance with TN PCB.
6. Common Pitfalls When Teaching Scope 1 & 2 Accounting
Mixing units – Litres vs kilograms. Embed conversion factors in your template.
Wrong grid factor vintage – Always cite the reporting year (CEA publishes annually). Investors notice.
Double counting captive renewables – If you own a rooftop solar array, subtract its kWh from grid purchase before applying the grid EF.
Ignoring oxidation factors – Most liquid fuels are 100 %, but coal can be 98 %. Check IPCC tables.
Rounding too early – Keep at least three significant figures through the math; round only in the final report.
7. Bringing It All Together – A Template Walk‑Through
Below is a simplified template header. Copy into Excel/Sheets and replicate rows per source.
Site
Year
Source
Fuel/Utility
Unit
Quantity
EF
EF Source
Scope
t CO₂
Notes
Populate Source with diesel genset, grid power, LPG boiler, etc. The formula for t CO₂ is simply Quantity*EF/1000 if EF is in kg CO₂/unit.
Pro hint – Colour‑code Scope 1 rows red and Scope 2 blue; the pattern helps non‑experts spot which bars must shrink.
8. FAQ – Calculation Edition
Q: Which emission‑factor database is “best” for India? A: The Central Electricity Authority’s regional grid mix is mandatory for BRSR. For fuels, default to IPCC but cross‑check with India GHG Program if available.
Q: Do I count solar power I export? A: Exported electricity is deducted from your grid import before calculating Scope 2. The residual export may be reported as avoided emissions in a footnote, but not subtracted from Scope 1.
Q: How to show location‑ vs market‑based numbers? A: Two separate rows in your disclosure. Make it clear which one ties to targets and which one goes to CDP.
-Visualise the result (bar chart Scope 1 vs Scope 2) so management intuitively grasps priorities.
-Use sector‑relevant stories—cement, data centres, FMCG—because numbers stick when anchored in reality.
-Iterate annually; the more often teams run the calculations, the faster they spot anomalies and savings.
10. Conclusion
Scope 1 and Scope 2 may be “only” the first two slices of the carbon pie, but they often dictate over 90 % of what a company can directly control in the next five years. By mastering the calculations shown above- diesel, coal, LPG, grid electricity, and purchased steam—you arm yourself with a decision‑making compass.
From slashing diesel in quarry trucks to inking renewable‑energy PPAs, the path to lower emissions starts with a spreadsheet and a clear line of sight to each tonne of CO₂. Now roll up your sleeves, grab last year’s utility bills, and teach your team the math.
About Anaxee:
Anaxee is India’s Reach Engine! we are building India’s largest last-mile outreach network of 100,000 Digital Runners (shared feet-on-street, tech-enabled) to help Businesses and Social Organizations scale to rural and semi-urban India, We operate in 26 states, 540+ districts, and 11,000+ pin codes in India. We Help in last-mile execution of projects for (1) Corporates, (2) Agri-focused companies, (3) Climate, and (4) Social organizations. Using technology and people on-the-ground (our Digital Runners), we help in scale and execute projects across 100s of cities and bring 100% transparency in groundwork. We also work in the Tech for Climate domain, providing technology for the execution and monitoring of Nature-Based (NbS) and Community projects. Our technology & processes bring transparency and integrity into carbon projects across various methodologies (Agroforestry, Regen Agriculture, Solar devices, Improved Cookstoves, Water filters, LED lamps, etc.) worldwide.
For More info or query, Connect with sales@anaxee-wp-aug25-wordpress.dock.anaxee.com
Introduction to GHG Accounting: Boundaries & Scope
Greenhouse gas (GHG) accounting sounds technical—and, truth be told, it is a bit technical—but the basic idea is simple: we want to know how much climate‑warming gas an organisation is responsible for and what we can do to shrink that number. Whether you run a small factory in Indore or a multi‑site tech company with offices across India, a clear, consistent GHG inventory is the starting line of any credible climate programme.
In this guide we’ll walk through all the core building blocks—from the global standards and key definitions to the nitty‑gritty of emission factors and data templates—using plain language and plenty of real‑world examples. By the end you should feel confident setting the right boundaries, picking the right scope, and choosing calculation methods that fit your business reality.
1. What Is a GHG Inventory?
If you have ever kept a household budget, you already get the logic: list every source of income and expense, add it up, and see where the big numbers lie. A GHG inventory does the same for carbon—except instead of rupees we measure in tonnes of CO₂‑equivalent (tCO₂e).
Why it matters
✔️ Regulators in many countries, including India’s BRSR reporting, are nudging—or outright demanding—companies to disclose climate impacts.
✔️ Large customers push smaller suppliers to share carbon numbers before placing an order.
✔️ Investors watch the data to judge climate risk.
✔️ Internally, a first inventory often reveals surprising “hidden” hotspots that save real money once tackled.
A credible inventory must be complete, consistent, transparent, accurate, and re‑calculable. Those five words show up again and again in the standards, so keep them close.
2. The Standards: GHG Protocol and ISO 14064 / 14067
2.1 GHG Protocol
The Greenhouse Gas Protocol—developed by WRI and WBCSD—is the de‑facto global playbook. It is split into three main parts:
Corporate Standard (organisational inventories)
Project Protocol (specific projects like a solar farm)
Scope 3 Standard (value‑chain emissions)
It lays out definitions for Scopes 1, 2, and 3, boundary setting, and reporting rules. Most assurance firms in India benchmark your report against this standard, even if you are also using ISO.
2.2 ISO 14064 (Parts 1, 2, 3)
ISO 14064 is a three‑part series:
Part
Focus
Typical User
1
Organisational inventories
Companies, city governments
2
Projects
Carbon offset developers
3
Verification & validation
Auditors
ISO wording is more formal than the GHG Protocol but broadly compatible. Many Indian companies reference both to satisfy international buyers.
2.3 ISO 14067
This is the product carbon footprint cousin—handy when you need a cradle‑to‑grave footprint for a single product line.
Tip: Think of ISO 14064‑1 as company‑wide accounts and ISO 14067 as a product P&L. The math overlaps but the audiences differ.
3. Organizational vs Operational Boundaries
Before crunching numbers, decide whose emissions you include and which activities count.
Organizational boundary deals with ownership and control. If your firm owns 60 percent of a joint venture, do you count 60 percent of that JV’s diesel use or the whole 100? This is where consolidation approaches (next section) come in.
Operational boundary slices emissions into Scope 1, Scope 2, and Scope 3. You might fully own a warehouse (organisational control) but report only Scope 1 diesel generator use and Scope 2 grid electricity, while leaving third‑party trucking in Scope 3.
Getting these two boundaries clear up‑front avoids double‑counting later on.
4. Consolidation Approaches
Equity Share – Account for emissions in proportion to your economic stake. Own 30 % of a plant? Take 30 % of its CO₂.
Control Approaches
Financial Control – If you have the power to direct financial policies (even without full ownership), count 100 % of emissions.
Operational Control – If you run day‑to‑day operations (e.g., dispatch schedules), you take 100 %.
Most multinationals prefer operational control; it lines up neatly with decision‑making power. SMEs with simple structures often use equity share for ease.
How to choose?
-Use financial control when your corporate accounts already consolidate that way—keeps auditors happy.
-Use operational control if sustainability teams drive equipment upgrades but finance sits elsewhere.
Document the reasoning once. Changing approaches mid‑stream creates headaches.
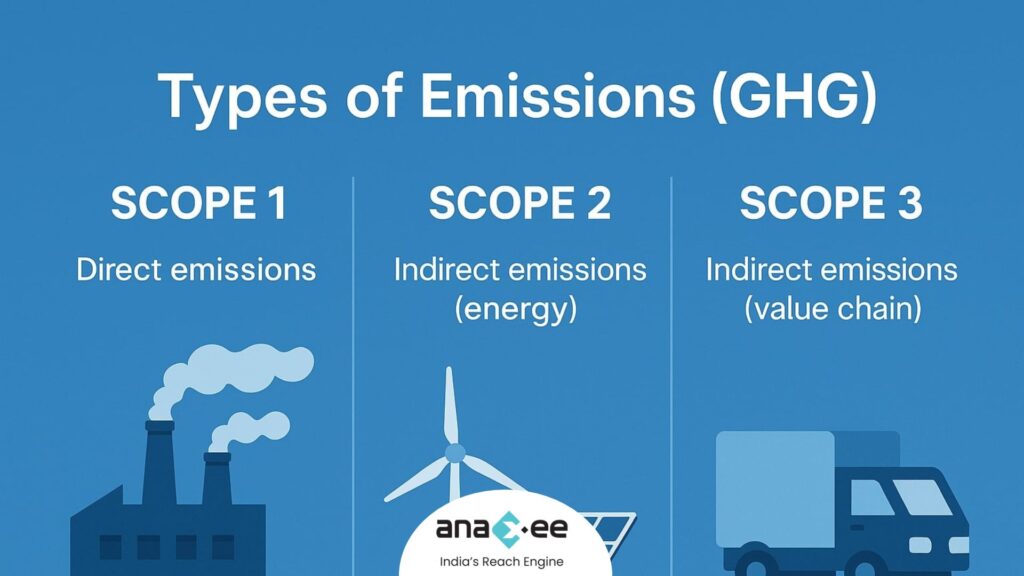
5. Scope 1, Scope 2, Scope 3 Explained
Scope
What it covers
Simple example
Scope 1
Direct emissions from sources you own or control
Fuel burned in your diesel gensets
Scope 2
Indirect emissions from purchased electricity, heat, steam, or cooling
CO₂ from coal‑based power plants that feed your grid electricity
Scope 3
All other indirect emissions across the value chain
Supplier mining of iron ore, business travel, customer product use
Key takeaways
– Scope 1 is usually the smallest in a service company but the largest in heavy industry.
– Scope 2 often spikes if your site sits in a coal‑heavy grid region (think Chhattisgarh, Jharkhand).
– Scope 3 can dwarf the other two—up to 90 %—especially for consumer brands.
Don’t panic if Scope 3 data is messy on Day 1. Most firms phase it in: categories with good data first (business travel, purchased electricity); harder ones later (supplier primary data).
6. Emission Source Identification
Start with a brainstorm. Sit with facility managers, procurement folks, and a floor operator. List all activities that release GHGs. Common culprits:
Activity Data can be litres of diesel or kWh of LNG.
7.2 Process Emissions
For limestone calcination in a cement kiln:
Clinker Produced (t) × CaCO₃ Content (%) × Stoichiometric CO₂ Ratio
7.3 Fugitive Emissions
Refrigerant top‑up method:
(Refrigerant added during year) × GWP100 of gas
If equipment inventory is spotty, use mass‑balance or screening factors from IPCC.
8. Worked Examples
Example 1: Diesel Combustion
Factory generator used 12,000 litres of diesel in FY 2024‑25.
-IPCC default EF: 2.68 kg CO₂/litre
-Oxidation factor: 1 (diesel combusts fully)
12,000 L × 2.68 kg/L = 32,160 kg CO₂ = **32.16 tCO₂**
Add minor CH₄ and N₂O using defaults to get CO₂‑equivalent.
Example 2: HFC‑134a Leakage
Three chillers each charged with 12 kg HFC‑134a. Average annual leak rate: 12 %.
Charge (12 kg × 3) × Leak Rate 0.12 = 4.32 kg HFC‑134a
-GWP100 for HFC‑134a: 1,430
4.32 kg × 1,430 = 6,177.6 kg CO₂e ≈ **6.18 tCO₂e**
9. Emission Factors & Tiers
The IPCC and GHG Protocol talk about Tiers—basically the confidence level of your emission factor.
Tier
Source of Factor
Typical Use Case
1
Global or national default
Early‑stage inventories, SMEs
2
Technology‑specific factors
Sector averages (e.g., coal vs gas power plants)
3
Direct measurement or supplier‑specific data
Mature programmes, regulated facilities
Pro tip: Start Tier 1, graduate to Tier 2 for big hotspots, and aim for Tier 3 where it matters (e.g., steel billets, power plants).
10. Scope 2: Location‑Based vs Market‑Based
-Location‑based: Uses the average grid emission factor where your site sits. Good for benchmarking and mandatory disclosure.
-Market‑based: Lets you account for renewable energy purchases (RECs, PPAs) at supplier‑specific factors.
If you buy solar under an open‑access PPA, market‑based Scope 2 can drop dramatically—even to near‑zero—while location‑based stays unchanged. Many sustainability reports show both numbers side‑by‑side to avoid confusion.
11. Data Templates That Actually Work
A clean spreadsheet beats fancy software during the first year. Core columns to include:
Activity
Unit
Quantity
Emission Factor
Factor Source
Scope
Evidence
Diesel – Generator
L
12,000
2.68 kg CO₂/L
IPCC 2021
1
Purchase invoices
Use dropdown lists for units and scopes to cut entry errors. Link evidence (PDF invoices, meter photos) inside the sheet or a shared drive.
Once volume grows, tools like Anaxee Carbon Track or Sphera can automate factor look‑ups, but don’t underestimate a tidy Excel.
Implementing all eight pillars turns GHG accounting from an annual chore into a strategic decision tool.
13. Conclusion
GHG accounting may feel overwhelming at first, but remember: the heaviest lift is simply getting started. Nail your boundaries, pick sensible emission factors, and be transparent about assumptions. As data quality improves, your reduction roadmap writes itself.
At Anaxee, we help organisations across India navigate this journey—whether it’s choosing a consolidation approach or setting up cloud‑based templates that cut reporting time in half. Ready to transform your carbon reporting into climate action? Get in touch today.
Frequently Asked Questions (FAQs)
Q1. Do I need third‑party verification?
Verification isn’t mandatory in India for all sectors yet, but large corporates seeking CDP leadership scores or international financing should budget for it.
Q2. How often should I update emission factors?
Best practice is annually. Grid factors, for instance, change as renewable capacity grows.
Q3. Are biogenic CO₂ emissions counted?
Report them separately. They don’t add to the fossil CO₂ total but must be disclosed.
Q4. Can I exclude de minimis sources?
Yes, but clearly define the threshold (e.g., <1 % of total emissions) and list what you left out.
About Anaxee:
Anaxee is India’s Reach Engine! we are building India’s largest last-mile outreach network of 100,000 Digital Runners (shared feet-on-street, tech-enabled) to help Businesses and Social Organizations scale to rural and semi-urban India, We operate in 26 states, 540+ districts, and 11,000+ pin codes in India. We Help in last-mile execution of projects for (1) Corporates, (2) Agri-focused companies, (3) Climate, and (4) Social organizations. Using technology and people on-the-ground (our Digital Runners), we help in scale and execute projects across 100s of cities and bring 100% transparency in groundwork. We also work in the Tech for Climate domain, providing technology for the execution and monitoring of Nature-Based (NbS) and Community projects. Our technology & processes bring transparency and integrity into carbon projects across various methodologies (Agroforestry, Regen Agriculture, Solar devices, Improved Cookstoves, Water filters, LED lamps, etc.) worldwide.
For More info or query, Connect with sales@anaxee-wp-aug25-wordpress.dock.anaxee.com
Climate change used to sound like a distant risk. In 2025 it is the daily context for business, policy and personal life. From record‑shattering heatwaves in India’s pre‑monsoon season to surging insurance costs after back‑to‑back cyclones, the signals are no longer abstract. This article unpacks the science and policy landscape behind those signals, using the latest publicly available numbers and reports so you can ground decisions in fact, not hype.
1. What Is Climate Change?
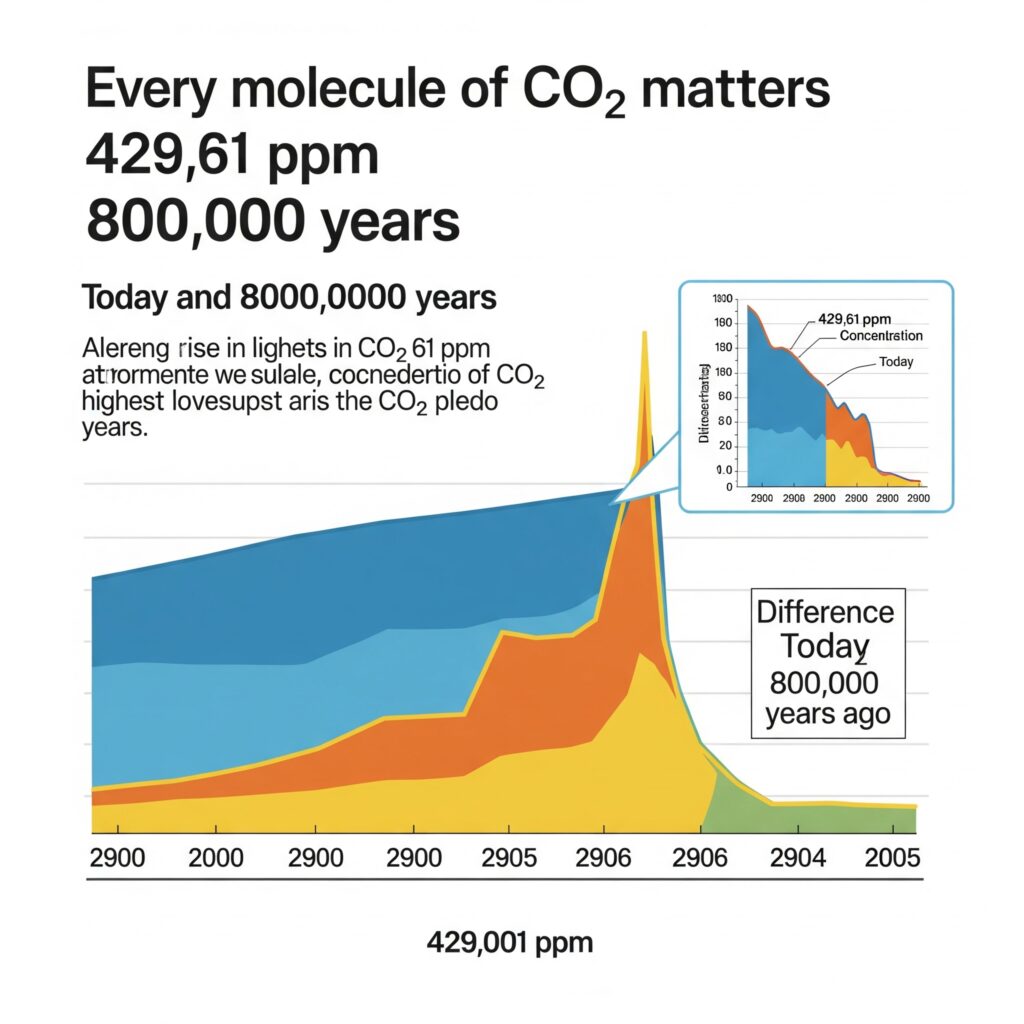
At its core, climate change is the long‑term shift in average weather patterns caused mainly by the accumulation of heat‑trapping gases in the atmosphere. Carbon dioxide (CO₂) is the headline molecule because it persists for centuries. NOAA’s Mauna Loa Observatory measured an average concentration of 429.61 ppm in June 2025, the highest in at least 800,000 years. Weekly data show levels staying above 428 ppm through mid‑July.
If those numbers feel abstract, NASA’s recent high‑resolution GEOS model animation makes them visceral by tracking CO₂ plumes in three dimensions over an entire year – reds swirling out of industrial belts, greens pulsing as forests inhale and exhale. The takeaway: every tonne emitted stays in circulation far longer than any of us will live, ratcheting the planetary thermostat upward.
2. Global Warming – From Numbers to Real‑World Heat
“Global warming” is the symptom most people feel: higher land and ocean temperatures. NASA’s global temperature series shows Earth is now about 1.5 °C warmer than the 1951‑1980 baseline. That may sound small, but a single degree globally translates into extremes locally: a 50 °C heat index in Delhi, record coral bleaching in the Caribbean, and shrinking Himalayan glaciers feeding the Ganga. Ocean heat content has climbed relentlessly since the 1950s, storing the energy that later fuels stronger cyclones.
Sea level follows suit. Satellite altimetry records reveal an accelerating rise, driven by melting ice sheets and thermal expansion. Meanwhile, September Arctic sea‑ice extent is contracting by 12.2 % per decade. Add in NASA’s GRACE data on hydrological extremes, and the pattern is clear: we have entered an age of “hydro‑climatic whiplash,” swinging from drought to flood with little warning.
3. Global & National Emissions Snapshot (2024 Data)
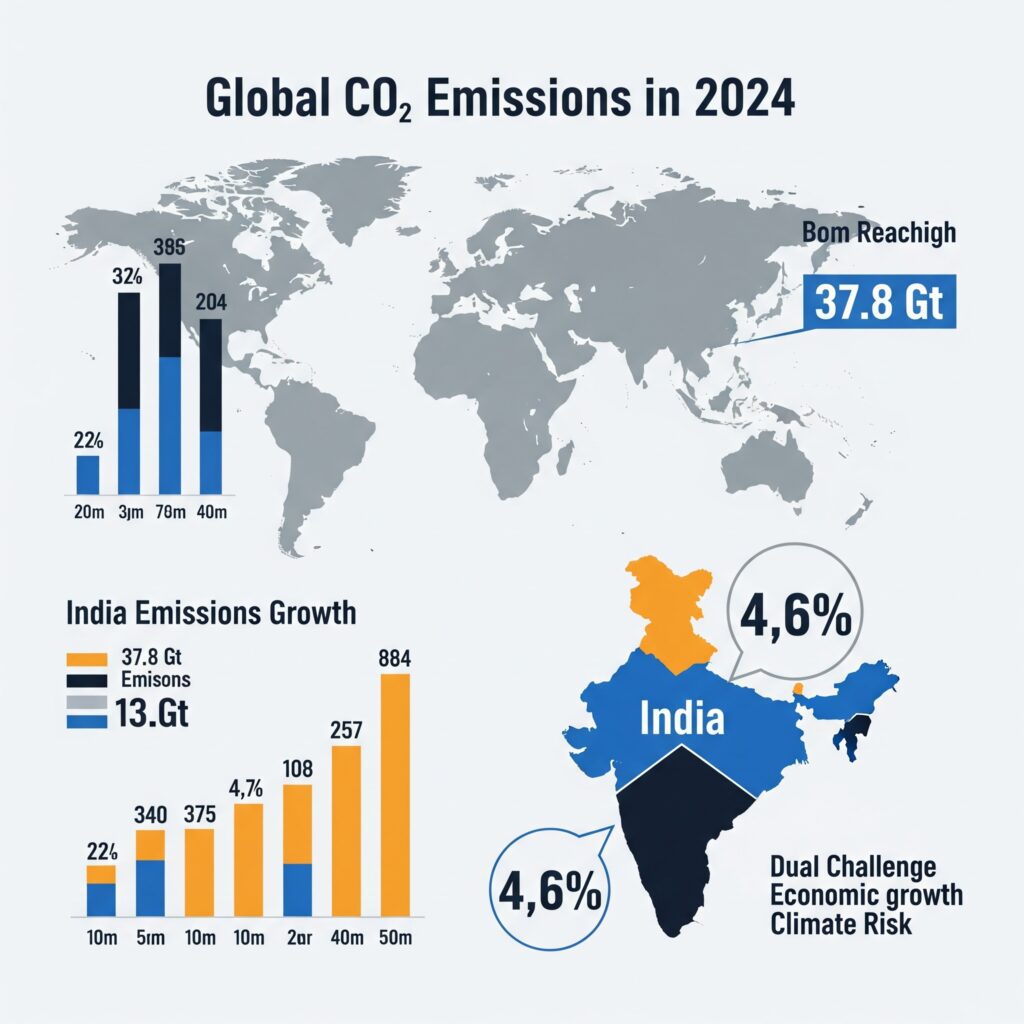
Energy‑related CO₂ emissions hit 37.8 Gt in 2024 – an 0.8 % rise and another all‑time high according to the IEA’s Global Energy Review 2025. The Global Carbon Project puts total fossil‑fuel CO₂ at 41.2 Gt, noting record wildfire contributions.
-China & USA still account for 45 % of fuel‑combustion CO₂, but India’s emissions grew 4.6 % in 2024, reflecting rapid power and transport demand.
-The EU and US declined slightly, proving that decoupling is possible but not yet fast enough.
India’s absolute energy‑sector CO₂ is now roughly 2.6 Gt CO₂‑eq, fourth globally, with coal still dominant but solar posting record additions. For Indian businesses, this duality – growth plus rising climate risk – frames every supply‑chain and investment decision.
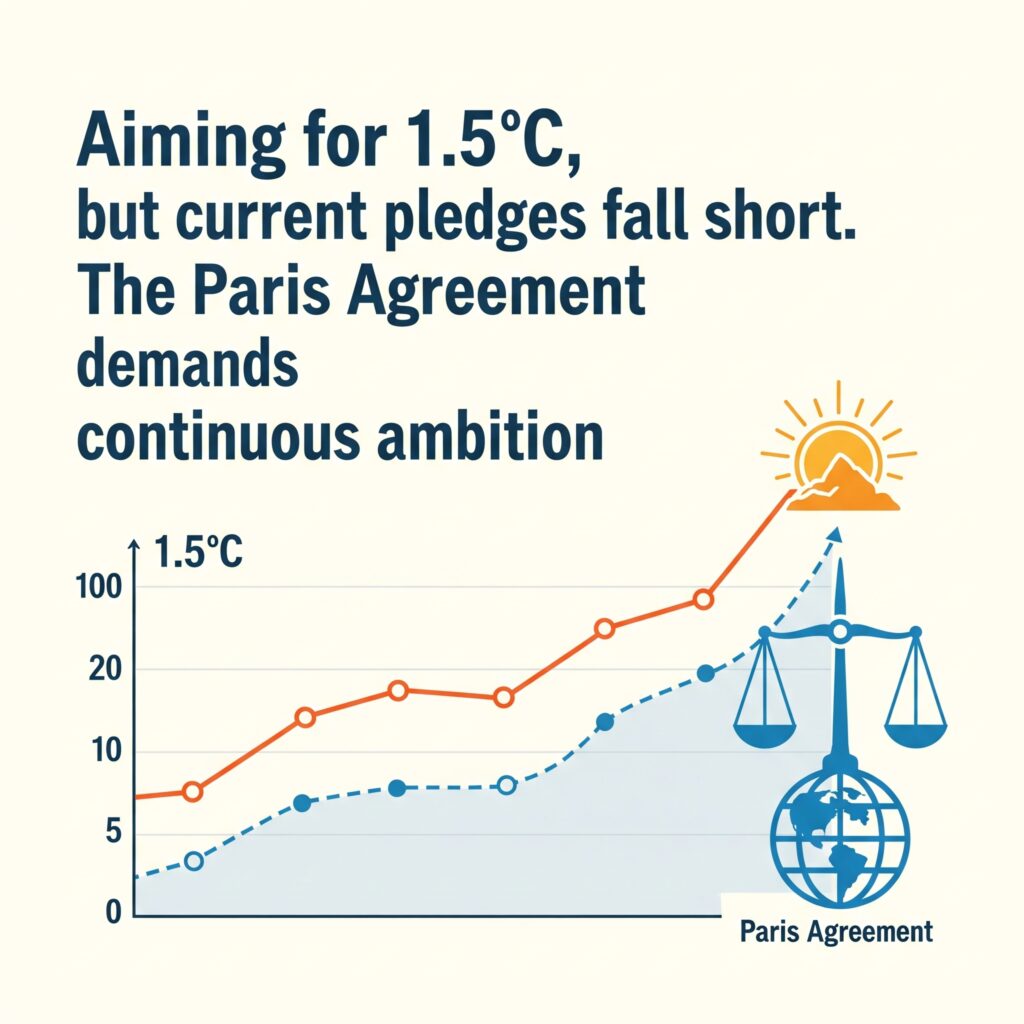
4. The Paris Agreement – A Living Framework
Signed in 2015, the Paris Agreement’s central aim is to hold warming “well below 2 °C” and ideally to 1.5 °C. Virtually every nation is a Party, meaning nearly 100 % of global GDP is covered. Yet UNEP’s emissions‑gap assessments show current pledges point toward ~2.5‑2.7 °C this century, even if fully implemented. The Agreement’s strength lies in its five‑year ambition cycle: each round of Nationally Determined Contributions (NDCs) must enhance or expand previous targets.
5. NDC & LT‑LEDS – Roadmaps, Not Wish‑Lists
NDCs set short‑ to mid‑term (5‑ to 10‑year) targets; Long‑Term Low‑Emission Development Strategies (LT‑LEDS) sketch pathways to mid‑century neutrality. As of September 2024, the UNFCCC had logged 168 latest NDCs covering 95 % of 2019 emissions. Since then, more updates have trickled in and the secretariat reminds Parties that “NDC 3.0” submissions are due by the end of 2025, shaped by the first global stock‑take.
On LT‑LEDS, 78 Parties (including big emitters like China, the EU, the US and most recently Peru and Equatorial Guinea) have tabled strategies as of June 2025. While these plans vary in detail, they give investors signals about future carbon pricing and renewable‑energy opportunities.
6. IPCC’s National Accounting Approach – Getting the Numbers Right
Behind every headline figure is a rigorous methodology. The IPCC’s 2006 Guidelines (refined in 2019) provide the default framework for national greenhouse‑gas inventories, defining sectors, gases, tiers of complexity and default emission factors. Inventory agencies must:
Cover all gases: CO₂, CH₄, N₂O and fluorinated gases.
Avoid double counting between sectors (e.g., land‑use and energy).
Continuously improve accuracy through higher‑tier methods as data allow.
This “national accounting” may sound bureaucratic, but without it we would not know whether climate actions are real or merely press releases.
7. Greenhouse Gases – The Official Classification
The IPCC groups heat‑trapping gases into four principal buckets:
Between 1990 and 2019, CO₂ from fossil fuels grew 67 %, CH₄ 29 %, N₂O 33 %, while F‑gases skyrocketed 254 % albeit from a small base. Each gas has a “global warming potential” expressing its heat‑trapping punch over 100 years; SF₆, for instance, is over 23,000 times stronger than CO₂.
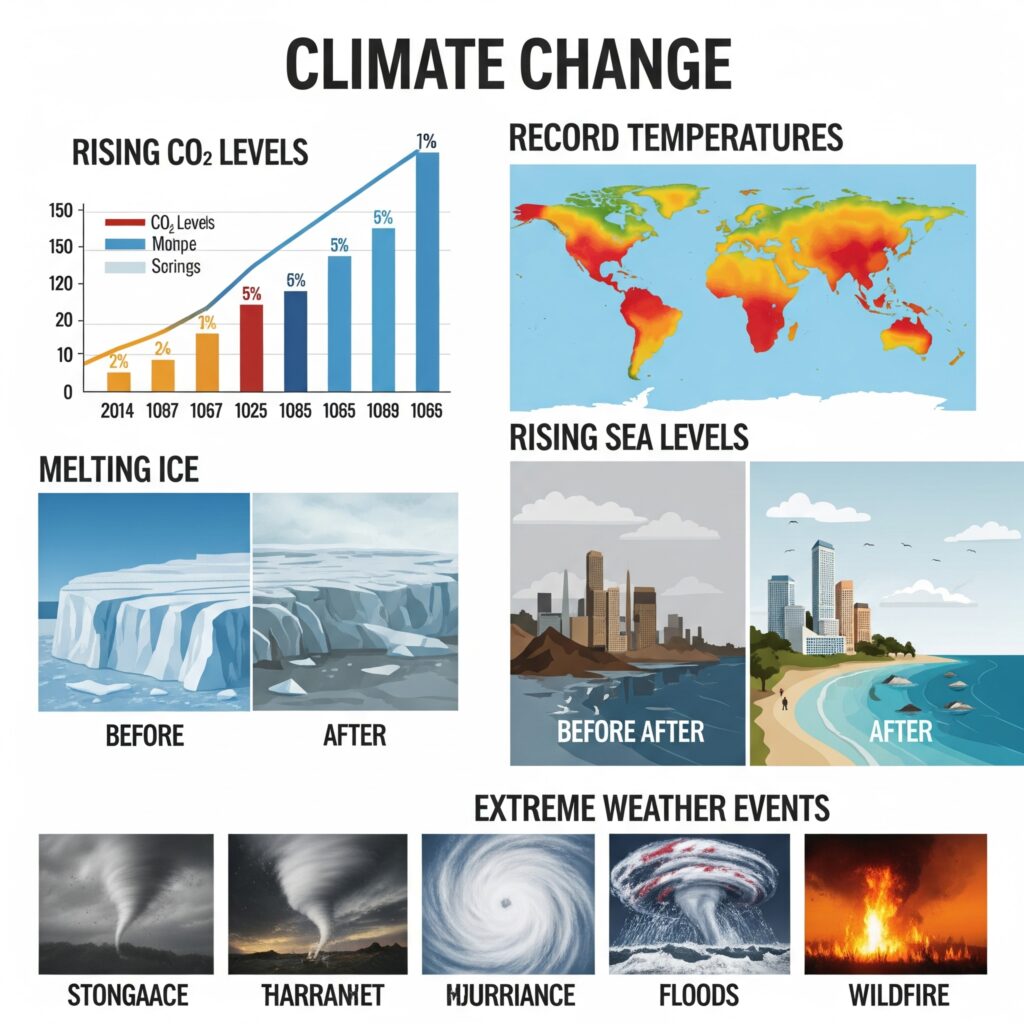
8. Evidence of Climate Change – The Smoking Gun(s)
Multiple, independent lines of observation converge:
-Temperature – 2024 became the hottest year on record, with every month since June 2023 exceeding the 1.5 °C threshold briefly.
-Cryosphere – Arctic summer ice retreating 12 % per decade; Greenland and Antarctica losing mass at accelerating rates.
-Sea level – Rising faster than at any period in the last 2,500 years.
-Extreme weather – NASA’s GRACE data show a doubling in the frequency of severe drought‑flood swings in the last five years.
Together, these datasets demolish the notion that recent warming is “natural variability.”
9. Status of NDC Submissions (July 2025)
Despite a UN deadline earlier this year, only about a dozen Parties accounting for 16.2 % of global emissions met the cut‑off, prompting the secretariat to prioritise quality over speed. Monaco’s fresh 2025 NDC arrived on 16 July, illustrating how updates are still landing almost weekly. Analysts expect a late‑2025 surge as major economies finalize their post‑stock‑take targets; whether ambition rises fast enough is the make‑or‑break question heading into COP 31.
Conclusion – What Comes Next?
The science leaves no doubt: the physical climate system is changing in lock‑step with rising greenhouse‑gas concentrations. Policy instruments like the Paris Agreement, NDCs and LT‑LEDS provide a governance scaffold, but their effectiveness hinges on honest accounting and rapid implementation.
For businesses operating in India and beyond, the direction of travel is clear: carbon‑intensive growth strategies face mounting physical and regulatory risks, while low‑carbon solutions unlock growing markets and capital flows. The companies that align now – auditing supply‑chain emissions, investing in renewables, backing nature‑based solutions – will be the ones still competitive when the next round of NDCs tightens the screws.
Stay tuned: the next 18 months, culminating in NDC 3.0, will set the trajectory for global emissions through 2035. Whether we write a story of managed transition or chaotic disruption depends on choices being made today.
About Anaxee:
Anaxee is India’s Reach Engine! we are building India’s largest last-mile outreach network of 100,000 Digital Runners (shared feet-on-street, tech-enabled) to help Businesses and Social Organizations scale to rural and semi-urban India, We operate in 26 states, 540+ districts, and 11,000+ pin codes in India. We Help in last-mile execution of projects for (1) Corporates, (2) Agri-focused companies, (3) Climate, and (4) Social organizations. Using technology and people on-the-ground (our Digital Runners), we help in scale and execute projects across 100s of cities and bring 100% transparency in groundwork. We also work in the Tech for Climate domain, providing technology for the execution and monitoring of Nature-Based (NbS) and Community projects. Our technology & processes bring transparency and integrity into carbon projects across various methodologies (Agroforestry, Regen Agriculture, Solar devices, Improved Cookstoves, Water filters, LED lamps, etc.) worldwide.
For More info or query, Connect with sales@anaxee-wp-aug25-wordpress.dock.anaxee.com
India’s Paper Industry and the Carbon Market: CCTS 2025 Explained:
What’s Happening?
With the CCTS Draft Notification of June 2025, India’s government has put a hard number on how much CO₂ the biggest industrial plants are allowed to emit- measured in GHG Emission Intensity (GEI). This includes the pulp & paper industry, which now joins steel, cement, and fertilizers under India’s formal carbon market umbrella.
Each listed paper unit has been:
-Assigned a baseline GEI (tonnes of CO₂ per tonne of paper produced),
-And a reduction target for the next two years: 2025–26 and 2026–27.
If they go above the target — they’ll have to buy carbon credits. If they beat it — they can earn and sell credits.
Simple rules. Big implications.
Why the Paper Industry?
Paper may look clean, but the process behind it is energy-heavy and carbon-intensive.
Here’s why India’s pulp and paper sector matters for climate action:
Factor
Impact
Biomass & Coal
Many plants still rely on solid fuels for steam & heat.
Water-heavy process
Adds energy use via pumping, treating, heating.
Captive power
Many have internal plants running on coal or furnace oil.
Process emissions
Pulping, bleaching, and drying steps are GHG intensive.
India’s paper sector is estimated to emit 10–15 million tonnes of CO₂ annually. That’s more than the entire emissions of Bhutan.
Full List: India’s Major Paper Plants Under CCTS 2025
Here’s a table of the 20 paper & pulp plants across India included in the CCTS Draft. This includes both private and government-linked manufacturers.
No
Plant
State
Baseline_Output_tonnes
Baseline_GEI_tCO2_per_t
Target_GEI_2025_26
Target_GEI_2026_27
1
Ballarpur Industries – Ballarpur Unit
Maharashtra
137222
2.38
2.34
2.31
2
JK Paper Ltd – Rayagada Unit
Odisha
136226
2.13
2.1
2.07
3
West Coast Paper Mills – Dandeli
Karnataka
167432
2.42
2.38
2.35
4
Tamil Nadu Newsprint & Papers Ltd (TNPL)
Tamil Nadu
385688
1.88
1.85
1.82
5
Century Pulp & Paper – Lalkuan
Uttarakhand
375523
2.56
2.52
2.48
6
ITC Ltd – Bhadrachalam Paperboards
Telangana
122296
2.12
2.09
2.06
7
Emami Paper Mills – Balasore
Odisha
156139
2.86
2.82
2.77
8
Naini Papers – Kashipur
Uttarakhand
249081
1.66
1.64
1.61
9
Yash Pakka Ltd – Ayodhya
Uttar Pradesh
309747
1.75
1.72
1.7
10
NR Agarwal Industries Ltd – Vapi
Gujarat
176575
2.71
2.67
2.63
11
Kuantum Papers Ltd – Saila Khurd
Punjab
175399
1.22
1.2
1.18
12
Orient Paper & Industries Ltd – Amlai
Madhya Pradesh
254457
2.27
2.24
2.2
13
Star Paper Mills Ltd – Saharanpur
Uttar Pradesh
347243
1.35
1.33
1.31
14
Seshasayee Paper & Boards – Erode
Tamil Nadu
176673
2.43
2.39
2.36
15
Andhra Paper Ltd – Rajahmundry
Andhra Pradesh
101315
1.52
1.5
1.47
16
The Andhra Pradesh Paper Mills – Kadiyam
Andhra Pradesh
143852
2.69
2.65
2.61
17
Abhishek Industries – Trident Paper Division
Punjab
368839
1.43
1.41
1.39
18
Bindals Papers Mills Ltd – Muzaffarnagar
Uttar Pradesh
243992
2.89
2.85
2.8
19
Genus Paper & Boards Ltd – Moradabad
Uttar Pradesh
305774
1.8
1.77
1.75
20
Pudumjee Paper Products – Pune
Maharashtra
352265
2.45
2.41
2.38
What the Table Tells Us
-GEI values range from 1.0 to 3.0 tCO₂/t — a huge variation showing gaps in technology.
-The biggest plants (like TNPL, ITC Bhadrachalam, Century Pulp) have better economies of scale and likely lower GEI.
-Several Uttar Pradesh units (Muzaffarnagar, Moradabad) appear on the list—this region is paper-dense but tech-light.
-Odisha and Tamil Nadu dominate the east and south belt.
If carbon price is ₹1,200 per tonne → ₹93.6 lakh liability But if they beat the target? That’s ₹93.6 lakh in credit revenue.
Multiply that by 20 plants and 2 years — the total opportunity/liability is in hundreds of crores.
What Can Paper Plants Do?
You can’t just “green” a paper mill overnight. But here’s what leading units are doing:
1. Switch to Cleaner Fuel
-Biomass → Biogas → Green hydrogen (long term) -TNPL has shifted to 100% biomass boiler ops in some units.
2. Heat Recovery & Cogeneration
-Steam traps, condensate recovery, waste heat boilers -Century Pulp saved ~11% of energy this way.
3. Switch to Renewable Electricity
-3–5 MW solar for daytime pulp section -Paper drying still remains hard to decarbonize
4. Water & Effluent Optimization
-Energy saved per kL treated = ~0.5–0.8 kWh -Naini Papers has reduced water use by 30% over 5 years.
5. Apply for Offset Credits
-Agroforestry (in sourcing regions) -Biochar (from paper sludge waste) -Wastewater methane recovery
Who Might Struggle?
Plant
Risk Factor
Bindals (Muzaffarnagar)
Older tech, lower automation
Genus Paper (Moradabad)
Wastepaper recycling may still emit
Orient Paper (MP)
High coal usage, legacy system
Who Could Be Sellers?
Plant
Why?
TNPL
Biomass-fed, green-energy leaning
Century Pulp
High efficiency, newer systems
JK Paper
Consistent upgrade cycles, RE investments
What’s the Role of Anaxee?
Anaxee can help these plants earn credits, monitor emissions, and verify offsets with its all-India last-mile network. Especially for:
-Agroforestry credit documentation
-Paper sludge → biochar projects
-Capturing ground-level RE projects for MRV
-GPS & timestamped field data for validation
📍 Your verifier needs field photos? 📍 Need to geo-tag saplings at 200 locations? 📍 Want to track methane from sludge lagoons?
Anaxee does it—digitally, on time, at scale.
Final Thoughts
India’s paper mills are stepping into carbon accounting for the first time. The CCTS framework is a wake-up call, but also an opportunity.
Companies that embrace energy efficiency and credit tracking early will profit.
Those who delay? They’ll be stuck buying credits from those who didn’t.
Want to Track Your Carbon & Earn Credits?
If you’re a paper manufacturer or a consultant working with mills — talk to Anaxee’s Climate Team, at sales@anaxee-wp-aug25-wordpress.dock.anaxee.com
We’ll help you:
-Monitor your GEI
-Launch a real offset project (Nature based Projects)
-And verify everything, ground-up.
About Anaxee: Anaxee is India’s Reach Engine! we are building India’s largest last-mile outreach network of 100,000 Digital Runners (shared feet-on-street, tech-enabled) to help Businesses and Social Organisations scale to rural and semi-urban India, We operate in 26 states, 540+ districts, and 11,000+ pin codes in India.
We Help in last-mile execution of projects for (1) Corporates, (2) Agri-focussed companies, (3) Climate, and (4) Social organizations. Using technology and people on-the-ground (our Digital Runners), we help in scale and execute projects across 100s of cities and bring 100% transparency in groundwork. We also work in the Tech for Climate domain, providing technology for the execution and monitoring of Nature-Based (NbS) and Community projects. Our technology & processes bring transparency and integrity into carbon projects across various methodologies (Agroforestry, Regen Agriculture, Solar devices, Improved Cookstoves, Water filters, LED lamps, etc.) worldwide.
Anaxee Digital Runners Private Limited 303, Right-wing, (use Lift#1) New IT Park Building 3rd floor, Pardesi Pura Main Rd, Electronic Complex, Sukhlia, Indore,
Madhya Pradesh 452003