Download the India CSR Data Pack (FY2024-25): the national CSR trend, spending by state, by sector and the top corporate spenders – compiled from the MCA National CSR Portal and reconciled to the national totals. Free, in one CSV.
Free download: the India CSR Data Pack (FY2024-25) – the national CSR trend from FY2014-15 to FY2024-25, spending by state, spending by sector, and the top corporate spenders, as an Excel workbook (.xlsx), one sheet per table. Every figure is compiled from the Ministry of Corporate Affairs National CSR Portal and reconciled to the national total of ₹40,794 crore. No cost – just tell us where to send it.
What is inside
5 data tables · FY2014-15 to FY2024-25 · 37 states/UTs · 28 sectors · top corporate spenders · source: MCA National CSR Portal
Govt data, reconciledOpens in ExcelFree
India companies spent ₹40,794 crore on CSR in FY2024-25 – up roughly four times in a decade. We pulled the Ministry of Corporate Affairs public CSR data into one tidy, reconciled file so you do not have to stitch it together from annexures and portals yourself. It is the same dataset behind our CSR spending in India hub and interactive dashboard – now yours to download and work with.
What is in the data pack
National CSR trend – total CSR spend every year from FY2014-15 (₹10,066 Cr) to FY2024-25 (₹40,794 Cr).
Spending by state – the top 15 states/UTs by CSR spend, with each state share of the national total, plus the ₹1,606 Cr Pan India (unmapped) line.
Spending by sector – all 28 Schedule VII heads for FY2024-25, from education (₹13,877 Cr) down to technology incubators.
Top CSR companies – the biggest corporate spenders, FY2023-24 (all-company basis) and FY2024-25 (NSE main-board provisional), each on its own clearly-labelled basis.
Sources and notes – every table is sourced, single-basis, and reconciled to the national total so you can cite it with confidence.
Get the India CSR Data Pack – free
Tell us where to send it and we will email you the download link in about 20 seconds.
Where the numbers come from
Everything in the pack is built from the Ministry of Corporate Affairs National CSR Portal (csr.gov.in) and the MCA disclosures companies file under Section 135 of the Companies Act. We reconcile each cut to the national totals (₹35,918 crore for FY2023-24, ₹40,794 crore for FY2024-25), keep every table on a single basis, and exclude the Grand Total, Pan India and Not Elsewhere Classified rows from the per-state ranking so nothing is double-counted. Where two years use different bases – the FY2024-25 company figures are NSE main-board provisional, the FY2023-24 figures all-company – we label it, so you never compute a misleading share.
The one number the data cannot show
Open data tells you how much was spent and where it was booked. It cannot tell you whether the school was built, the health camp ran, or the asset reached the village – and under Rule 8(3) of the CSR Rules, large projects must be independently assessed by an agency that is not the implementer. That is the gap between reported spend and verified delivery.
Anaxee is the independent field layer that closes it: our Digital Runners stand in front of the asset, confirm it exists and is in use, and capture it geo-tagged and timestamped – across 540 districts, 11,000+ pincodes and 26 states. We verify; we are not the implementer, and we do not audit or certify.
Running a CSR programme and need the delivery verified? Let us put independent, geo-tagged field verification behind your numbers.
Data note. The data pack compiles public CSR figures from the Ministry of Corporate Affairs National CSR Portal (csr.gov.in), MCA AOC-4 / Section 135 disclosures, and PRIME Database (FY2024-25 NSE provisional) for reference and convenience. All amounts in ₹ crore. Figures reconcile to the national totals; verify against the official source before relying on them. Anaxee Digital Runners compiles and field-verifies CSR delivery – it does not audit or certify CSR.
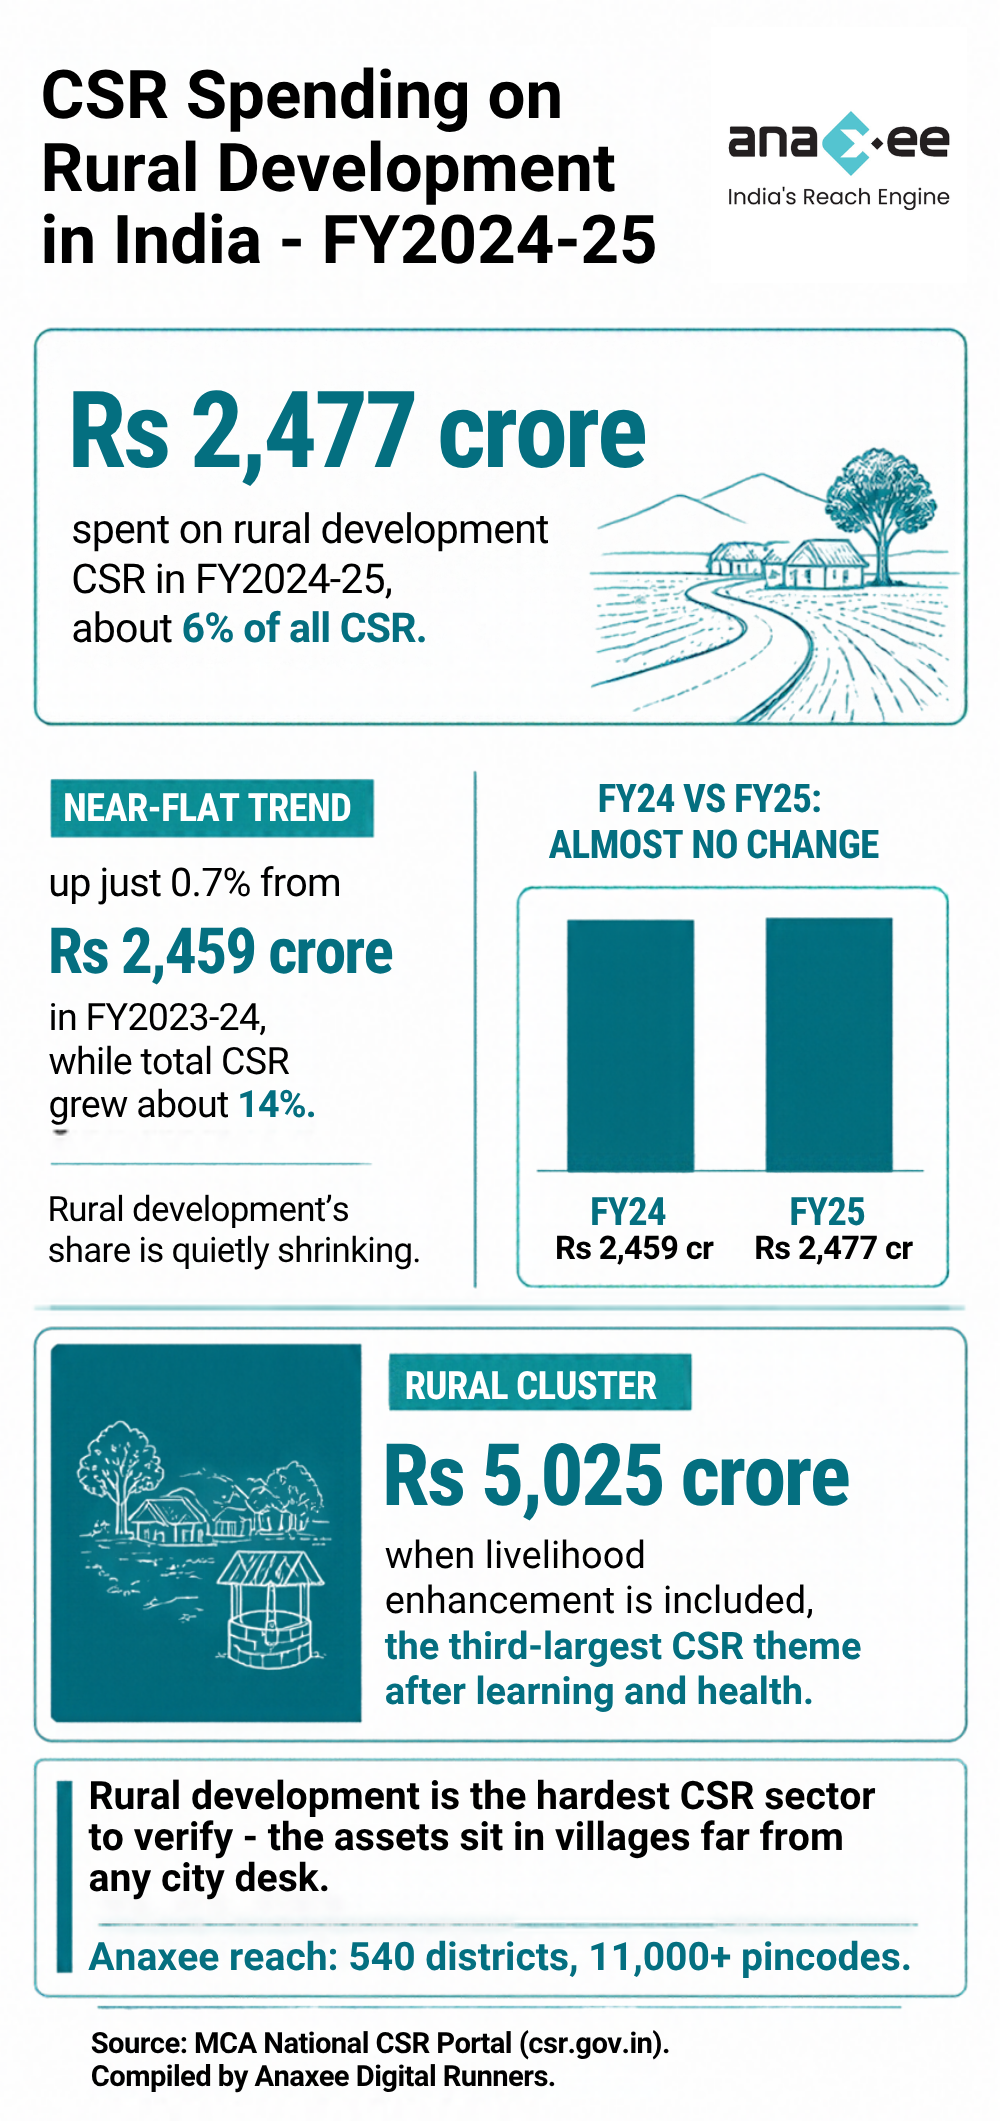
India spent Rs 2,477 crore of CSR on rural development in FY2024-25 – essentially flat year-on-year while total CSR grew ~14%. With livelihood enhancement, the rural cluster is Rs 5,025 crore, the third-largest after learning and health – and the hardest to verify from a city desk.
In short: India spent ₹2,477 crore of CSR on rural development in FY2024-25 – about 6% of all CSR, and almost exactly what it spent the year before (₹2,459 crore). While total CSR grew about 14%, rural development stood still, so its share is quietly shrinking. Paired with livelihood enhancement (₹2,548 crore), the rural cluster is roughly ₹5,025 crore – the third-largest theme after learning and health, and the single hardest to confirm from a city desk.
At a glance – rural development CSR
FY2024-25: ₹2,477 crore · ~6% of national CSR · up just 0.7% from ₹2,459 cr · rural cluster ₹5,025 cr with livelihoods · source: MCA National CSR Portal
Follow India’s CSR money into the villages and the picture changes. Education and health care are surging; rural development is not. Companies reported ₹2,477 crore of CSR on rural development projects in FY2024-25 – roads, water, community assets, rural infrastructure – which is within a whisker of the ₹2,459 crore they spent the previous year. In a year when the national CSR pool grew by nearly a seventh, a flat rural number means the countryside is getting a smaller slice. And rural development is precisely the sector where spend is hardest to see: the assets sit in villages a long way from any head office. Here is what the Ministry of Corporate Affairs data shows. For the full ranking, see our CSR spending by sector analysis.
CSR spending on rural development in India, FY2024-25 (₹ crore). Source: MCA National CSR Portal. Infographic by Anaxee Digital Runners.
How much CSR goes to rural development?
Rural development CSR was ₹2,458.57 crore in FY2023-24 and ₹2,476.96 crore in FY2024-25 – a rise of just 0.7%, effectively flat. Against a national total that climbed from ₹35,918 crore to ₹40,794 crore (about 14%), rural development slipped from roughly 6.8% of all CSR to about 6.1%. The money did not fall; it simply stopped keeping pace.
Rural development CSR
₹2,459 Cr → ₹2,477 Cr
Rural development CSR expenditure, FY2023-24 vs FY2024-25 (₹ crore) – barely changed.
Rural development plus livelihoods: the third pillar
Rural development rarely travels alone. Counting the closely related head – livelihood enhancement – the rural cluster comes to about ₹5,025 crore in FY2024-25. That makes it the third-largest theme in Indian CSR after the learning cluster (about ₹16,246 crore) and health (about ₹9,312 crore with water and sanitation), and ahead of environment. Add women empowerment (₹521 crore) and the rural-economy cluster is closer to ₹5,546 crore.
Rural head (FY2024-25)
CSR (₹ Cr)
Livelihood Enhancement
2,548
Rural Development Projects
2,477
Rural cluster total
5,025
Women Empowerment (add-on)
521
Livelihood enhancement grew faster – from ₹2,409 crore to ₹2,548 crore, about 6% – which hints that companies are tilting from building rural assets toward raising rural incomes. See the full ranking in our sector-wise CSR breakdown, or the national overview in the CSR spending in India hub.
Why rural development CSR is the hardest to verify
A rural development project is defined by its distance. A check dam, a village road, a solar streetlight, a community water point, an SHG income programme – these sit scattered across blocks and panchayats that no city-based team can reasonably reach. The report says the asset was built; confirming it means standing in front of it. Under Rule 8(3) of the CSR Rules, a large rural project must be independently assessed by an agency that is not the implementer – and that assessment is only as credible as its ability to actually get to the village.
This is exactly what a distributed field network is for: Anaxee’s Digital Runners can reach the panchayat, stand in front of the asset, confirm the work was done and is in use, and capture it geo-tagged and timestamped – across 540 districts and 11,000+ pincodes, not a convenient sample near the highway.
Village-level verification – geo-tagged confirmation that the asset or programme exists, was delivered, and is in use, deep in rural interiors. See our field coverage.
Independent by design – Anaxee verifies, it does not run the programmes, as Rule 8(3) requires.
Tech + AI evidence – timestamped, photo-backed capture with AI-assisted checks that make large multi-state rural programmes consistent and auditable.
Running a CSR rural development or livelihoods programme? Whether it is rural infrastructure, community assets, water, or income-generation, let’s put independent, geo-tagged field verification behind the numbers.
How much CSR does India spend on rural development?
In FY2024-25, Indian companies spent ₹2,477 crore on rural development projects – about 6% of all CSR, and almost unchanged from ₹2,459 crore in FY2023-24. (Source: MCA National CSR Portal.)
Is rural development CSR growing?
Barely. Rural development spend rose just 0.7% year-on-year while total CSR grew about 14%, so its share of the national pool is shrinking – from roughly 6.8% to about 6.1%. Livelihood enhancement, the related head, grew faster at about 6%.
What counts as rural development CSR?
Rural infrastructure and roads, drinking water and check dams, community assets, and projects that improve living conditions in villages. It is often reported alongside livelihood enhancement and women empowerment, which together form the rural-economy cluster of about ₹5,546 crore.
Why does rural development CSR need independent verification?
Because the assets sit in villages far from any corporate office, rural development is the hardest sector to confirm. Independent, village-level field verification checks that the asset exists, was delivered, and is in use – which Rule 8(3) requires for large projects.
Where does the rural development CSR data come from?
From the Ministry of Corporate Affairs’ National CSR Portal (csr.gov.in), built from company disclosures under Section 135. Figures are sector-wise reported CSR expenditure and reconcile to the national total.
Data note. Rural development, livelihood enhancement and women empowerment figures (FY2023-24 and FY2024-25) are sector-wise reported CSR from the Ministry of Corporate Affairs’ National CSR Portal (csr.gov.in) and reconcile to the national totals (₹35,918 cr FY23-24; ₹40,794 cr FY24-25). All amounts in ₹ crore. Compiled and field-verified by Anaxee Digital Runners.
Telangana is India’s 9th-largest CSR state at 1,446 crore in FY2024-25, up 14.2x in a decade – one of the fastest. Why Hyderabad’s concentration makes field verification matter.
In short: Telangana recorded ₹1,446 crore in CSR in FY2024-25 – the ninth-highest of any state, 3.5% of national CSR, up a striking 14.2x from ₹102 crore a decade earlier, among the fastest growth of any large state. That surge is powered by Hyderabad’s pharma, IT and biotech economy – which also means the money concentrates sharply in and around the capital, while the state’s rural districts are a different story. Closing that gap is where on-ground verification matters.
At a glance – CSR in Telangana
FY2024-25: ₹1,446 crore · rank 9 of 37 · 3.5% of national CSR · 14.2x growth in a decade · source: MCA National CSR Portal
Govt data, reconciledField reach across TelanganaIndependent verification
Telangana is India’s youngest major state and one of its fastest-rising CSR economies. The engine is Hyderabad: bulk-drug and pharma giants, a dense IT and biotech corridor, and a growing base of financial-services and manufacturing head offices. Their CSR budgets have pushed the state’s total up more than fourteen-fold in a decade. But the same concentration that drives the growth is also its blind spot – the spend clusters in Hyderabad and its neighbouring districts, while the former Telangana-movement grievance, uneven rural development, still shapes districts far from the capital. For a company funding CSR in Telangana, the total is impressive; proving it reaches beyond the city is the real question. Here is what the Government’s National CSR Portal shows for Telangana. For the national picture, see our CSR spending in India hub.
How much CSR does Telangana receive?
Telangana’s CSR has risen from ₹102 crore in FY2014-15 to ₹1,446 crore in FY2024-25 – a 14.2x increase over the decade, one of the steepest climbs of any state, led by Hyderabad’s pharma, IT, biotech and financial-services corporates.
Telangana CSR spend
₹102 Cr → ₹1,446 Cr
Telangana CSR expenditure, FY2014-15 vs FY2024-25 (₹ crore).
At ₹1,446 crore, Telangana is the ninth-largest CSR recipient among 37 states and UTs, 3.5% of the national total – just behind the resource states of Rajasthan and Odisha, and narrowly ahead of neighbouring Andhra Pradesh.
Rank
State / UT
CSR FY2024-25 (₹ Cr)
7
Rajasthan
1,620
8
Odisha
1,575
9
Telangana
1,446
10
Haryana
1,386
11
Andhra Pradesh
1,384
Telangana’s rank understates its momentum – its 14.2x decade growth is far steeper than the resource states just above it. See how every state compares in our CSR spending by state analysis, or explore it in the interactive dashboard.
Why on-ground verification matters in Telangana
Telangana’s CSR is unusually concentrated. A large share is generated and spent in and around Hyderabad – Rangareddy, Medchal, Sangareddy – where the pharma, IT and biotech campuses sit. Yet the districts that most need development spend, the erstwhile-backward belts of the north and south such as Adilabad, Mahbubnagar, Nalgonda and Khammam, are hours from the city. A programme reported as delivered in Telangana can mean a well-served peri-urban ward or a remote rural mandal, and the two are not the same. Under Rule 8(3) of the CSR Rules, large projects must be independently assessed by an agency that is not the implementer – and in Telangana the question that matters is whether the capital’s CSR actually reaches the rural districts.
This is where a field network earns its keep: Anaxee’s Digital Runners operate across Telangana and 540 districts nationwide, so a programme in a remote mandal is verified with the same geo-tagged, timestamped proof as one on Hyderabad’s doorstep.
Field reach across Telangana – verification into the rural north and south, not just the Hyderabad corridor. See our field coverage across India.
Independent by design – Anaxee does not run the programmes it verifies, as Rule 8(3) requires.
Geo-tagged evidence – timestamped, photo-backed capture auditors and boards can rely on.
Running a CSR programme in Telangana? Let’s put independent, district-level field verification behind it – for impact assessment, plantation or farmer-programme verification.
Telangana recorded ₹1,446 crore in CSR in FY2024-25, up from ₹102 crore in FY2014-15 – a 14.2x rise over the decade, one of the fastest of any state. (Source: MCA National CSR Portal.)
Where does Telangana rank in CSR spending?
Telangana is the ninth-largest CSR recipient among 37 states and UTs, taking about 3.5% of national CSR – behind Rajasthan and Odisha, and just ahead of Andhra Pradesh.
What drives Telangana’s CSR?
Hyderabad’s economy – bulk-drug and pharma, IT and biotech, and financial services – is the main CSR engine, which is why the spend is concentrated around the capital.
Why is field verification important in Telangana?
CSR is heavily concentrated in and around Hyderabad, while the greatest development needs are in the rural, formerly backward districts – so confirming that programmes reach beyond the capital is the main challenge.
Where does the Telangana CSR data come from?
From the Ministry of Corporate Affairs’ National CSR Portal (csr.gov.in), built from company disclosures under Section 135. Figures are state-wise reported CSR expenditure.
Data note. Telangana figures (FY2014-15 to FY2024-25) are from the Ministry of Corporate Affairs’ National CSR Portal (csr.gov.in), state-wise reported CSR expenditure. All amounts in ₹ crore. Compiled and field-verified by Anaxee Digital Runners.
Odisha is India’s 8th-largest CSR state at 1,575 crore in FY2024-25, up 6.2x in a decade – mining, metals and PSUs led. Why its tribal interior makes field verification matter.
In short: Odisha recorded ₹1,575 crore in CSR in FY2024-25 – the eighth-highest of any state, 3.9% of national CSR, up 6.2x from ₹252 crore a decade earlier. It is one of India’s great resource states: mining, steel, aluminium and a heavy base of public-sector units anchor the CSR pool. But that money clusters in the mineral belt, while the hardest needs sit in the tribal interior – and that gap is exactly where on-ground verification matters.
At a glance – CSR in Odisha
FY2024-25: ₹1,575 crore · rank 8 of 37 · 3.9% of national CSR · 6.2x growth in a decade · source: MCA National CSR Portal
Govt data, reconciledField reach across OdishaIndependent verification
Odisha’s CSR is built on what lies under its ground. The state holds a large share of India’s iron ore, bauxite, coal and chromite, and the mining, steel, aluminium and power companies working those reserves – many of them public-sector units – fund a substantial CSR pool. The catch is geography: that spend concentrates around the mineral belt of the north and east, while the sharpest development needs are in the tribal south and west. For a company running a CSR programme in Odisha, or a foundation funding work in its districts, the total is healthy; proving it reaches the interior is the real question. Here is what the Government’s National CSR Portal shows for Odisha. For the national picture, see our CSR spending in India hub.
How much CSR does Odisha receive?
Odisha’s CSR has risen from ₹252 crore in FY2014-15 to ₹1,575 crore in FY2024-25 – a 6.2x increase over the decade, led by mining, metals, steel, aluminium and the public-sector units that dominate the state’s industrial base.
Odisha CSR spend
₹252 Cr → ₹1,575 Cr
Odisha CSR expenditure, FY2014-15 vs FY2024-25 (₹ crore).
At ₹1,575 crore, Odisha is the eighth-largest CSR recipient among 37 states and UTs, 3.9% of the national total – just behind Rajasthan, another resource-heavy state, and ahead of Telangana.
Rank
State / UT
CSR FY2024-25 (₹ Cr)
6
Uttar Pradesh
2,213
7
Rajasthan
1,620
8
Odisha
1,575
9
Telangana
1,446
10
Haryana
1,386
Odisha and Rajasthan sitting side by side is no accident – both are resource states where mining and metals anchor the CSR base. See how every state compares in our CSR spending by state analysis, or explore it in the interactive dashboard.
Why on-ground verification matters in Odisha
The paradox of Odisha CSR is distributional. The money is generated in the mineral districts – Keonjhar, Sundargarh, Angul, Jajpur, Jharsuguda – where the mines and plants sit, yet some of the state’s deepest development needs are in the tribal and aspirational districts of the south and west, including the KBK region of Kalahandi, Balangir and Koraput. A programme reported as delivered in Odisha can mean a mine-periphery township or a remote tribal block hours from the nearest highway. Under Rule 8(3) of the CSR Rules, large projects must be independently assessed by an agency that is not the implementer – and in Odisha the binding constraint is reaching the interior to confirm what actually landed.
This is where a field network earns its keep: Anaxee’s Digital Runners operate across Odisha and 540 districts nationwide, so projects in the tribal interior and the mining belt alike can be verified with geo-tagged, timestamped proof – not just the sites that are easy to reach.
Field reach across Odisha – verification into the tribal south and west, not just the mineral belt. See our field coverage across India.
Independent by design – Anaxee does not run the programmes it verifies, as Rule 8(3) requires.
Geo-tagged evidence – timestamped, photo-backed capture auditors and boards can rely on.
Running a CSR programme in Odisha? Let’s put independent, district-level field verification behind it – for impact assessment, plantation or farmer-programme verification.
Odisha recorded ₹1,575 crore in CSR in FY2024-25, up from ₹252 crore in FY2014-15 – a 6.2x rise over the decade. (Source: MCA National CSR Portal.)
Where does Odisha rank in CSR spending?
Odisha is the eighth-largest CSR recipient among 37 states and UTs, taking about 3.9% of national CSR – just behind Rajasthan and ahead of Telangana.
What drives Odisha’s CSR?
Mining and metals – iron ore, bauxite, coal and chromite – along with steel, aluminium, power and a heavy base of public-sector units are the main CSR-funding industries.
Why is field verification important in Odisha?
CSR spend concentrates in the mineral belt of the north and east, while the deepest development needs are in the tribal south and west (including the KBK region) – so confirming that programmes reach the interior is the main challenge.
Where does the Odisha CSR data come from?
From the Ministry of Corporate Affairs’ National CSR Portal (csr.gov.in), built from company disclosures under Section 135. Figures are state-wise reported CSR expenditure.
Data note. Odisha figures (FY2014-15 to FY2024-25) are from the Ministry of Corporate Affairs’ National CSR Portal (csr.gov.in), state-wise reported CSR expenditure. All amounts in ₹ crore. Compiled and field-verified by Anaxee Digital Runners.
Healthcare is India’s 2nd-biggest CSR cause – 8,531 crore in FY2024-25, up 16%. The government data, and why health camps and assets need independent field verification.
In short: Healthcare is India’s second-largest CSR cause, after education. Companies spent ₹8,531 crore on health in FY2024-25 – about 21% of all CSR – and it is growing faster than education, up 16% on the year. Much of it is delivered as camps, mobile units, equipment and nutrition programmes in rural areas, which are events and assets, not line items – and exactly the kind of spend that needs someone on the ground to confirm it happened.
At a glance – healthcare CSR
FY2024-25: ₹8,531 crore · ~21% of national CSR · up 16.1% from ₹7,345 cr · #2 sector · source: MCA National CSR Portal
After education, health is where CSR goes. Hospitals and diagnostics, mobile medical units, health and eye camps, nutrition and maternal-health programmes, medical equipment and ambulances, and water and sanitation – all of it funded from corporate CSR budgets, and increasingly aimed at rural and underserved districts. The Ministry of Corporate Affairs data shows both the scale and the momentum: health is the fastest-growing of India’s two biggest CSR sectors. Here is what the National CSR Portal shows for healthcare. For the full sector picture, see our CSR spending by sector analysis.
CSR spending on healthcare in India, FY2024-25 (₹ crore). Source: MCA National CSR Portal. Infographic by Anaxee Digital Runners.
How much CSR goes to healthcare?
Health CSR rose from ₹7,345 crore in FY2023-24 to ₹8,531 crore in FY2024-25 – a 16.1% increase, faster than education’s 11% and well above the overall growth of CSR. It is now about 21% of every CSR rupee.
Healthcare CSR
₹7,345 Cr → ₹8,531 Cr
7,3458,531FY24FY25
Healthcare CSR expenditure, FY2023-24 vs FY2024-25 (₹ crore).
The closely related water-and-sanitation heads add to the health footprint: in FY2024-25, Sanitation (₹439 Cr) and Safe Drinking Water (₹342 Cr) together carried another ₹781 crore of public-health spend. Taken with health care, the broad health-and-WASH cluster is over ₹9,300 crore.
Health-related head (FY2024-25)
CSR (₹ Cr)
Health Care
8,531
Sanitation
439
Safe Drinking Water
342
Poverty, Hunger & Malnutrition
1,647
Nutrition and anti-hunger programmes (₹1,647 Cr) overlap heavily with health delivery in practice. For the full ranking across every sector, see our sector-wise CSR analysis, or the national overview in the CSR spending in India hub.
Why healthcare CSR is hard to verify on the ground
Health CSR is unusually event- and asset-based. A reported number can mean a hundred health camps across a district, a fleet of mobile medical units, diagnostic equipment installed in rural clinics, or nutrition kits distributed to thousands of households. None of that is self-evidencing: a camp either happened or it did not; a machine was either delivered and works or it did not; a beneficiary was either seen or was not. Under Rule 8(3) of the CSR Rules, large projects must be independently assessed by an agency that is not the implementer – and for health programmes that means verifying events and assets where they actually took place.
This is where a field network earns its keep: Anaxee’s Digital Runners can confirm a health camp ran and who attended, verify that equipment and ambulances were delivered and are in use, and survey beneficiaries – geo-tagged and timestamped, across 540 districts rather than a convenient sample.
Camp & event verification – independent confirmation that health camps, screenings and drives actually happened, with attendance evidence. See our field coverage.
Asset & equipment verification – geo-tagged checks that equipment, ambulances and clinic infrastructure were delivered, installed and are in use.
Independent + tech-enabled – Anaxee verifies rather than implements (as Rule 8(3) requires), with timestamped, AI-assisted field capture.
Running a CSR healthcare programme? Whether it is camps, mobile units, equipment or nutrition, let’s put independent, geo-tagged field verification behind the numbers.
In FY2024-25, Indian companies spent ₹8,531 crore on health care – about 21% of all CSR and the second-largest sector, up 16% from ₹7,345 crore in FY2023-24. (Source: MCA National CSR Portal.)
Is healthcare CSR growing?
Yes – health is the fastest-growing of India’s two biggest CSR sectors, up 16.1% in FY2024-25, faster than education’s 11% and faster than overall CSR growth.
What does healthcare CSR fund?
Hospitals and diagnostics, mobile medical units, health and eye camps, maternal and child health, nutrition programmes, medical equipment and ambulances, and water and sanitation – much of it aimed at rural and underserved districts.
Why does healthcare CSR need independent verification?
Because it is largely event- and asset-based – camps, equipment, distributions – which are not self-evidencing. Independent field verification confirms that camps ran, assets were delivered and in use, and beneficiaries were real, as Rule 8(3) requires for large projects.
Where does the healthcare CSR data come from?
From the Ministry of Corporate Affairs’ National CSR Portal (csr.gov.in), built from company disclosures under Section 135. Figures are sector-wise reported CSR expenditure and reconcile to the national total.
Data note. Health care, sanitation, safe drinking water and nutrition figures (FY2023-24 and FY2024-25) are sector-wise reported CSR from the Ministry of Corporate Affairs’ National CSR Portal (csr.gov.in) and reconcile to the national totals (₹35,918 cr FY23-24; ₹40,794 cr FY24-25). All amounts in ₹ crore. Compiled and field-verified by Anaxee Digital Runners.
Education is India’s single biggest CSR cause – 13,877 crore in FY2024-25, 34% of all CSR. The government data, and why reaching the rural classroom needs field verification.
In short: Education is India’s single largest CSR cause by a wide margin. In FY2024-25 companies spent ₹13,877 crore on education – 34% of all CSR, up about 11% on the year. Add vocational skills and special education and the learning-and-skilling cluster crosses ₹16,000 crore. But education spend is spread across lakhs of schools and students, which makes the rural and remote end of it the hardest to confirm actually reached the classroom.
At a glance – education CSR
FY2024-25: ₹13,877 crore · 34% of national CSR · up 10.9% from ₹12,508 cr · #1 sector · source: MCA National CSR Portal
If you follow the money, India’s CSR is, more than anything, an education programme. Year after year the largest single share of corporate social responsibility goes to schools, scholarships, digital classrooms and teacher training – well ahead of health, environment or livelihoods. The Ministry of Corporate Affairs data makes the scale clear, and it also frames the harder question: a reported education number covers everything from a city school lab to a one-room rural school, and only the second kind is difficult to verify. Here is what the National CSR Portal shows for education. For the full sector picture, see our CSR spending by sector analysis.
CSR spending on education in India, FY2024-25 (₹ crore). Source: MCA National CSR Portal. Infographic by Anaxee Digital Runners.
How much CSR goes to education?
Education CSR rose from ₹12,508 crore in FY2023-24 to ₹13,877 crore in FY2024-25 – a 10.9% increase, and a steady 34% of the national total. It is the one head that every kind of company, in every state, reliably funds.
Education CSR
₹12,508 Cr → ₹13,877 Cr
12,50813,877FY24FY25
Education CSR expenditure, FY2023-24 vs FY2024-25 (₹ crore).
Education plus skilling: the real learning cluster
Education does not sit alone. Counting the directly related heads – vocational skills and special education – the full learning-and-skilling cluster comes to about ₹16,246 crore, roughly 40% of all CSR in FY2024-25. No other theme comes close.
Learning head (FY2024-25)
CSR (₹ Cr)
Education
13,877
Vocational Skills
1,945
Special Education
423
Learning cluster total
16,246
For comparison, the next single sector – Health Care – is ₹8,531 crore. Education alone outspends it by more than 60%. See the full ranking in our sector-wise CSR breakdown, or the national overview in the CSR spending in India hub.
Why education CSR is hard to verify on the ground
An education programme is easy to describe and hard to confirm. A single CSR report can cover scholarships to thousands of students, digital labs in hundreds of schools, teacher-training across districts, and infrastructure in villages a day’s travel from the nearest town. The city end is visible; the rural end – where the need and the leakage risk are both highest – is not. Under Rule 8(3) of the CSR Rules, a large education project must be independently assessed by an agency that is not the implementer, and that assessment is only as good as its reach into the actual schools.
This is where a field network earns its keep: Anaxee’s Digital Runners can visit the schools, confirm the lab or the toilet block exists, check that the scholarship reached the student, and capture it all geo-tagged and timestamped – across 540 districts, not a convenient sample near the city.
School-level verification – geo-tagged confirmation that classrooms, labs, toilets and infrastructure exist and are in use, and that beneficiaries are real. See our field coverage.
Independent by design – Anaxee verifies, it does not run the programmes, as Rule 8(3) requires.
Tech + AI evidence – timestamped, photo-backed capture with AI-assisted checks that make large multi-state school programmes consistent and auditable.
Running a CSR education programme? Whether it is scholarships, digital classrooms, school infrastructure or teacher training, let’s put independent, geo-tagged field verification behind the numbers.
In FY2024-25, Indian companies spent ₹13,877 crore on education – 34% of all CSR and the single largest sector, up from ₹12,508 crore in FY2023-24. (Source: MCA National CSR Portal.)
Is education the biggest CSR sector in India?
Yes. Education is the largest single CSR head by a wide margin – 34% of the total, well ahead of the second sector, health care (₹8,531 crore). With vocational skills and special education added, the learning cluster is about ₹16,246 crore.
What does education CSR fund?
Scholarships, school infrastructure, digital classrooms and e-learning, teacher training, vocational and skilling programmes, and special education – across government and low-income private schools, in cities and villages alike.
Why does education CSR need independent verification?
Because it is spread across lakhs of schools and students, the rural and remote end is the hardest to confirm. Independent, school-level field verification checks that infrastructure exists, is in use, and that beneficiaries are real – which Rule 8(3) requires for large projects.
Where does the education CSR data come from?
From the Ministry of Corporate Affairs’ National CSR Portal (csr.gov.in), built from company disclosures under Section 135. Figures are sector-wise reported CSR expenditure and reconcile to the national total.
Data note. Education, vocational skills and special education figures (FY2023-24 and FY2024-25) are sector-wise reported CSR from the Ministry of Corporate Affairs’ National CSR Portal (csr.gov.in) and reconcile to the national totals (₹35,918 cr FY23-24; ₹40,794 cr FY24-25). All amounts in ₹ crore. Compiled and field-verified by Anaxee Digital Runners.
In short: Foundations, philanthropies, CSR foundations and development programmes are increasingly asked to prove not just that activities happened, but that they changed something. A programme evaluation answers that — against a baseline, with independent field evidence, not the implementer’s own count. Anaxee is the independent field layer built for it: a network reaching 540 districts, 11,000+ pincodes and 26 states that runs the baseline, midline and endline data collection and beneficiary verification an evaluation stands on. For grant-makers and programme teams that need credible outcome evidence from the field, this is the ground layer.
At a glance — development programme evaluation
Baseline / midline / endline · outcome & beneficiary verification · independent of the implementer · 540 districts / 11,000+ pincodes / 26 states · geo-tagged, AI-checked field data
FoundationsNGOs & programmesOutcome evidenceIndependent field layer
In the development sector, money increasingly comes with a question attached: what changed because of it? Funders, boards and grant committees want evidence of outcomes — incomes raised, enrolment improved, health or yields moved — not just a tally of activities delivered. A programme evaluation is how that question gets answered credibly, and the credible version rests on real data gathered from the field against a baseline. This page is for the foundation, philanthropy, CSR foundation or programme team that owns that evidence problem, and explains where an independent field layer like Anaxee fits.
What a development programme evaluation is
An evaluation measures a programme against what it set out to achieve — and asks whether the change can be credited to the programme. Done properly it combines a baseline (the starting position), midline and endline measurement, independent verification of who was actually reached, and an honest read of outcomes against the programme’s own goals or theory of change. It is different from routine monitoring, which tracks whether activities are happening as planned. Monitoring tells you the training ran; evaluation tells you whether incomes rose afterwards — and both need data that actually comes from the field.
Who commissions an evaluation
The need shows up across the sector, usually driven by accountability to whoever funds the work:
Foundations & philanthropies — confirming that grant money produced the outcomes a grantee reported.
NGOs & implementing partners — demonstrating results to their funders and renewing grants on the strength of credible evidence.
Development & government-linked programmes — evaluating delivery and outcomes at scale across districts.
Corporate CSR foundations — evaluating the programmes they fund, often alongside the independent impact assessment large CSR projects legally require.
Evaluation, monitoring and TPM — how they differ
These terms get used interchangeably, and keeping them straight decides what you actually need:
What it answers
When
Monitoring (M&E)
Are activities happening as planned?
Continuously, during the programme
Evaluation
Did outcomes actually change, against a baseline?
At milestones / end, for learning & accountability
Third-party monitoring (TPM)
Is a funded programme real, checked by an independent party?
During delivery, commissioned by the funder
Impact assessment (CSR)
Did a large CSR project produce its intended impact?
After, independently, where Rule 8(3) applies
They overlap and often run together, but they are distinct jobs. For the implementer-side data function see monitoring & evaluation data collection; for funder-commissioned checks see third-party monitoring; for the statutory CSR version see CSR impact assessment. What they share is a dependence on trustworthy field data — which is Anaxee’s layer.
What Anaxee brings to an evaluation
Anaxee runs an independent, tech-enabled field network built to collect and verify data at national scale — the part of an evaluation that is hardest to get right because it happens in scattered villages, not at a desk:
Baseline, midline & endline surveys — structured data collected to a defined protocol, so change is measured against a real starting point, not a guess.
Independent beneficiary verification — confirming the people a programme claims to have reached exist and received the benefit, with evidence that holds up.
Nationwide reach — 540 districts, 11,000+ pincodes and 26 states, so an evaluation covers the whole programme footprint rather than an accessible sample.
Geo-tagged, AI-checked data — every record carries GPS, a timestamp and photos, with AI flags on anything that does not add up, on a live dashboard.
The honest framing: Anaxee’s strength is independent, large-scale field measurement and verification — the primary evidence an evaluation stands on. Where a programme needs specialist evaluation design (a control group, an econometric or academic method), Anaxee provides the field data that work depends on rather than replacing it. The ground truth comes first; the analysis is only as good as it.
Where Anaxee fits
Anaxee is not an NGO implementer and not a desk-based consultancy writing a report from secondary data. It is the independent field-execution and verification layer underneath an evaluation — running the surveys, reaching the beneficiaries, and producing structured, source-tagged data a funder, board or evaluation partner can rely on. Because it does not implement the programmes it evaluates, its evidence has no outcome to flatter, which is exactly what makes it worth commissioning.
Need to evaluate a programme and prove outcomes? Whether it is a foundation grant, an NGO programme or a development initiative, let’s talk about putting independent field evidence behind the results.
What is the difference between monitoring and evaluation?
Monitoring tracks whether activities are happening as planned, during the programme; evaluation measures whether outcomes actually changed, usually against a baseline, for accountability and learning. A complete approach does both — see M&E data collection for the ongoing data function.
Does Anaxee design the evaluation or just collect the data?
Anaxee’s core strength is the independent field layer — baseline/endline surveys, beneficiary verification and outcome data at national scale. It can run the field evaluation end to end, and where a programme needs a specialist evaluation design (control group, econometric method), Anaxee provides the primary field evidence that analysis rests on.
Who uses development programme evaluation?
Foundations and philanthropies, NGOs and implementing partners, development and government-linked programmes, and corporate CSR foundations — anyone who has to show a funder or board that a programme produced real outcomes, not just activities.
How is this different from third-party monitoring?
Third-party monitoring is commissioned by the funder to independently check that a programme is being delivered; evaluation assesses whether it achieved its outcomes, and can be commissioned by the funder or the implementer. See third-party monitoring. Anaxee’s field network serves both.
Can Anaxee evaluate a programme across the whole country?
Yes — the field network reaches 540 districts, 11,000+ pincodes and 26 states, so an evaluation can cover a whole programme footprint rather than a convenient subset. That nationwide reach is the core advantage over desk-based or regional evaluators.
Informational reference. This page describes Anaxee’s independent field data collection, verification and evaluation-support services for the development sector. Figures cited (network reach; documented programme volumes) are from Anaxee’s own programmes and may change. Anaxee Digital Runners is an independent field data and verification provider and does not implement the programmes it evaluates. Nothing here is legal or compliance advice.
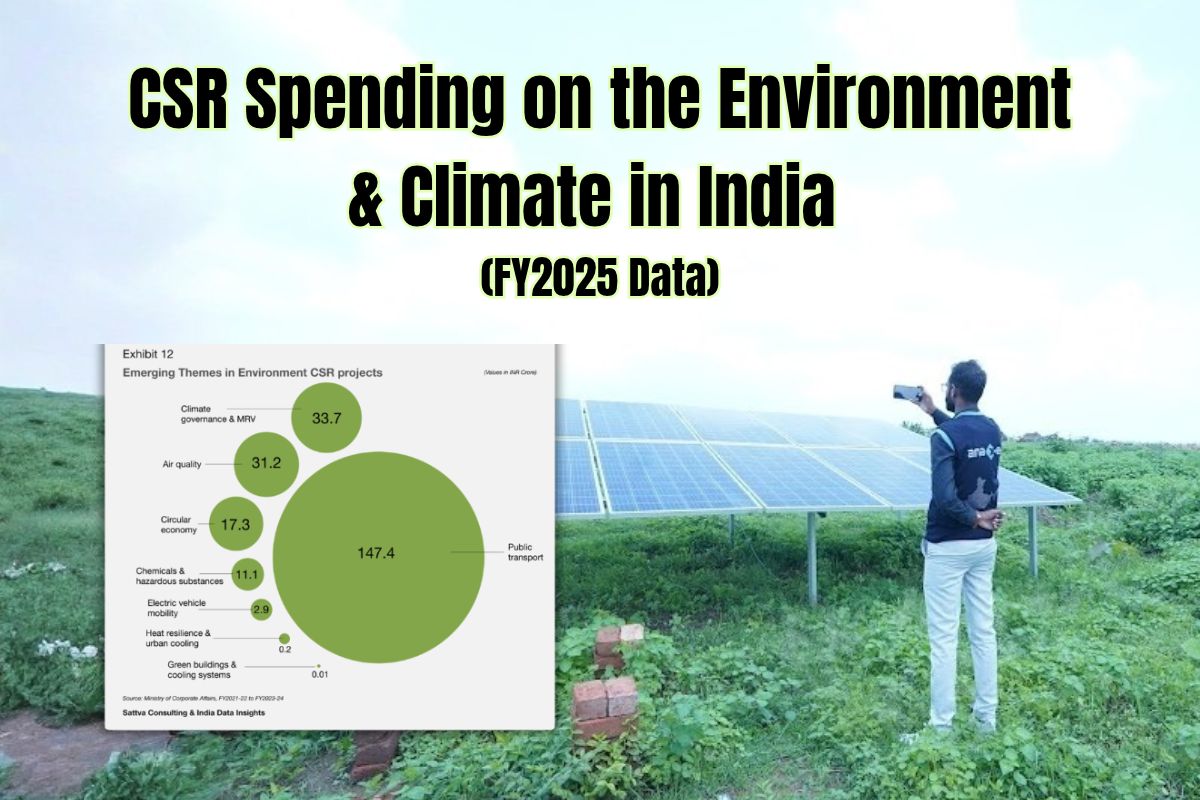
Environment, conservation and agroforestry draw under 10% of India’s CSR – about 3,911 crore of 40,794 crore. The green-CSR data, and why it is the hardest to verify.
In short: Of the ₹40,794 crore Indian companies spent on CSR in FY2024-25, the environment got a small share. Environmental sustainability, conservation and agroforestry together came to about ₹3,911 crore – under 10% of all CSR. Education and health alone drew nearly six times as much. Green CSR is also the hardest money to verify, because it lives in plantations, soil and water spread across thousands of remote sites – which is exactly where field evidence matters.
At a glance – environment & climate CSR
FY2024-25: green cluster ≈₹3,911 crore · under 10% of national CSR · agroforestry ₹88 crore (up from ₹75 cr) · source: MCA National CSR Portal
For all the urgency around climate, the environment is still a minority line in India’s CSR. The Ministry of Corporate Affairs data shows companies pouring the bulk of their CSR into education and health, while environmental sustainability, conservation and agroforestry – the heads most directly tied to climate and nature – together stay under a tenth of the total. For a company funding tree-planting, water or regeneration from its CSR budget, or a foundation backing nature-based work, this is the landscape; and it is the corner of CSR where proving the money landed is genuinely difficult. Here is what the National CSR Portal shows for green CSR. For the full sector picture, see our CSR spending by sector analysis.
How much CSR goes to the environment?
The core environmental heads – environmental sustainability, conservation of natural resources and agroforestry – add up to roughly ₹3,911 crore, about 9.6% of national CSR in FY2024-25. By comparison, education and health together took ₹22,408 crore – nearly six times the entire green cluster.
Environment cluster, FY2024-25
≈ ₹3,911 Cr · under 10%
Environmental sustainability + conservation + agroforestry, as a share of the ₹40,794 crore national CSR total.
Here is how the environmental and closely related heads break down:
Development head (FY2024-25)
CSR (₹ Cr)
Environmental Sustainability
3,397
Conservation of Natural Resources
426
Safe Drinking Water
342
Agro Forestry
88
Clean Ganga Fund
19
Agroforestry is tiny in absolute terms, but it is growing – up from ₹75 crore in FY2023-24 to ₹88 crore in FY2024-25, a 17% rise – and it is the head most aligned with nature-based climate work and farmer livelihoods.
Agroforestry CSR
₹75 Cr → ₹88 Cr
7588FY24FY25
Agroforestry CSR expenditure, FY2023-24 vs FY2024-25 (₹ crore).
Environmental CSR is not written on a balance sheet – it is planted in the ground. A reforestation grant becomes thousands of saplings across scattered plots; a watershed project becomes check-dams down a valley; a regenerative-agriculture programme becomes practices on hundreds of farms. None of that is visible from a desk, and much of it is in exactly the remote, rural terrain where a reported number is easiest to inflate and hardest to check. Under Rule 8(3) of the CSR Rules, large projects must be independently assessed by an agency that is not the implementer – and for a plantation or nature programme, that assessment only means something if someone actually reaches the sites.
This is Anaxee’s home ground: geo-tagged tree counts, plantation-survival checks, and MRV-grade field data across 540 districts – the ground truth that turns a green CSR number into verifiable evidence of trees that exist and farmers that were reached.
Plantation & tree-count verification – geo-tagged, timestamped survival and census checks on the ground. See our CSR plantation geo-tagging and tree census services.
Independent by design – Anaxee verifies, it does not implement or certify the programmes – exactly what Rule 8(3) requires.
Tech + AI MRV – field capture with AI-assisted checks that make large, scattered environmental programmes measurable and consistent. See our climate & MRV work.
Funding plantation, agroforestry or nature-based CSR? Let’s put geo-tagged, independent field verification behind it – so the trees, the farmers and the outcomes are proven, not just reported.
In FY2024-25, the core environmental heads – environmental sustainability (₹3,397 Cr), conservation of natural resources (₹426 Cr) and agroforestry (₹88 Cr) – came to about ₹3,911 crore, under 10% of the ₹40,794 crore national CSR total. (Source: MCA National CSR Portal.)
Why is environmental CSR so low compared to education and health?
Education and health are long-established, easy-to-deploy CSR heads and together take 55% of all CSR. Environmental and nature-based programmes are harder to run and verify, and have historically drawn a much smaller share – under 10% in FY2024-25.
How much CSR goes to agroforestry?
Agroforestry drew about ₹88 crore in FY2024-25, up from ₹75 crore in FY2023-24 – small in absolute terms but growing, and closely tied to nature-based climate work and farmer livelihoods.
Why is environmental CSR hard to verify?
Green CSR lives in plantations, soil, water and farms spread across thousands of remote sites, not in a document. Confirming that trees survived, structures were built or farmers were reached needs people on the ground – which is why independent field verification matters most here.
Where does the environment CSR data come from?
From the Ministry of Corporate Affairs’ National CSR Portal (csr.gov.in), built from company disclosures under Section 135. Figures are FY2024-25 provisional sector-wise reported CSR expenditure and reconcile to the national total.
Data note. Figures are FY2024-25 provisional sector-wise CSR from the Ministry of Corporate Affairs’ National CSR Portal (csr.gov.in) and reconcile to the national total of ₹40,794 crore. The “environment cluster” here sums environmental sustainability, conservation of natural resources and agroforestry; water, sanitation and Clean Ganga are shown for context and counted under their own heads. All amounts in ₹ crore. Compiled and field-verified by Anaxee Digital Runners.
Rajasthan’s CSR reached ₹1,620 crore in FY2024-25. District-wise, Jaipur, Udaipur, Ajmer and Jodhpur took 51.8%; Barmer grew 4x in a year. Full data for 36 districts and the aspirational-district share.
In short: Rajasthan recorded ₹1,620 crore in CSR in FY2024-25 – the seventh-highest of any state, 4.0% of national CSR, up 5.4x from ₹300 crore a decade earlier. Much of it comes from mining, cement, zinc and fast-growing solar – sectors spread across a state that is India’s largest by area. That combination, high spend across enormous distances, is what makes reaching and verifying every district the real test in Rajasthan.
At a glance – CSR in Rajasthan
FY2024-25: ₹1,620 crore · rank 7 of 37 · 4.0% of national CSR · 5.4x growth in a decade · source: MCA National CSR Portal
Govt data, reconciledField reach across RajasthanIndependent verification
Rajasthan’s CSR story is tied to the land itself: mining and metals in the Aravallis, cement across the north and south-east, and one of India’s largest solar build-outs in the western desert. Those industries fund a substantial CSR pool – but they sit far apart, in a state so large that reaching every project site is itself the hard part. For a company running a CSR programme in Rajasthan, or a foundation funding work across its districts, the total is healthy; proving where it lands, across those distances, is the challenge. Here is what the Government’s National CSR Portal shows for Rajasthan. For the national picture, see our CSR spending in India hub.
How much CSR does Rajasthan receive?
Rajasthan’s CSR has risen from ₹300 crore in FY2014-15 to ₹1,620 crore in FY2024-25 – a 5.4x increase over the decade, led by mining, metals, cement and a rapidly growing renewable-energy sector.
Rajasthan CSR spend
₹300 Cr → ₹1,620 Cr
Rajasthan CSR expenditure, FY2014-15 vs FY2024-25 (₹ crore).
At ₹1,620 crore, Rajasthan is the seventh-largest CSR recipient among 37 states and UTs, 4.0% of the national total – just ahead of Odisha, another mining-heavy state.
Rank
State / UT
CSR FY2024-25 (₹ Cr)
5
Tamil Nadu
2,738
6
Uttar Pradesh
2,213
7
Rajasthan
1,620
8
Odisha
1,575
9
Telangana
1,446
Rajasthan and Odisha sitting side by side is no coincidence – both are resource states where mining and metals anchor the CSR base. See how every state compares in our CSR spending by state analysis, or explore it in the interactive dashboard.
CSR spending by district in Rajasthan
The state total hides how unevenly the money lands. The Ministry of Corporate Affairs’ district-wise figures for FY2024-25, tabled in the Lok Sabha on 20 July 2026, show that four districts took 51.8% of Rajasthan’s CSR: Jaipur (₹347.79 crore), Udaipur (₹249.83 crore), Ajmer (₹134.13 crore) and Jodhpur (₹106.83 crore).
Top 10 districts by CSR, FY2024-25
4 districts = 51.8%
CSR expenditure by district, Rajasthan, FY2024-25 (₹ crore).
Udaipur jumped 2.5x in a year – from ₹99.47 crore to ₹249.83 crore, consolidating the southern mining and metals belt as Rajasthan’s second CSR centre.
The west is rising fast. Barmer grew 4x in a year (₹18.93 crore to ₹75.65 crore), Jodhpur 3.1x (₹34.30 to ₹106.83 crore) and Bikaner 3x (₹20.02 to ₹59.27 crore).
The aspirational districts get 7.1%. Rajasthan’s five Aspirational Districts (NITI Aayog) – Baran, Dholpur, Jaisalmer, Karauli and Sirohi – received ₹115 crore together, up from ₹74 crore the year before.
A relatively broad base. 12 of 36 districts received under ₹10 crore – together 2.8% of the state’s CSR. The median district got ₹21.4 crore.
Reporting has improved sharply. In FY2020-21, ₹282 crore – 42.1% of Rajasthan’s CSR – was booked to ‘district not classified’. In FY2024-25 it was ₹1.93 crore (0.1%).
Single years mislead. Jalore recorded ₹47.85 crore in FY2022-23 and ₹12.94 crore the next year. Read districts over several years.
Fun fact: Jaipur’s CSR has grown almost 6x in five years – from ₹59.13 crore in FY2020-21 to ₹347.79 crore in FY2024-25.
See all 36 districts – CSR in Rajasthan, FY2020-21 to FY2024-25 (₹ crore)
District
FY21
FY22
FY23
FY24
FY25
Jaipur
59.13
110.12
184.59
256.96
347.79
Udaipur
101.53
88.03
195.92
99.47
249.83
Ajmer
4.45
9.35
11.09
87.39
134.13
Jodhpur
11.47
25.42
37.58
34.30
106.83
Alwar
35.88
51.18
59.16
74.92
104.76
Barmer
24.55
15.74
18.56
18.93
75.65
Bhilwara
7.30
41.64
107.96
54.28
66.94
Bikaner
4.89
16.22
22.36
20.02
59.27
Kota
7.90
11.05
12.19
22.97
56.09
Sirohi
3.12
9.65
50.97
20.67
40.60
Pali
10.53
16.92
21.40
33.63
36.26
Rajsamand
23.68
22.78
15.39
15.03
34.05
Bharatpur
17.17
5.06
17.91
16.34
33.53
Chittorgarh
4.97
23.31
8.38
14.63
28.18
Baran
6.25
6.81
11.95
16.53
27.39
Churu
2.82
5.58
16.88
39.49
26.12
Jaisalmer
4.28
5.44
12.24
28.01
25.22
Sikar
6.95
20.87
25.63
22.69
22.31
Dungarpur
2.52
4.04
11.17
15.33
20.39
Jhunjhunu
5.52
7.73
13.73
13.91
17.90
Nagaur
8.01
5.82
7.87
13.85
15.82
Jalore
6.29
7.31
47.85
12.94
15.73
Dholpur
2.85
3.37
1.72
4.39
14.54
Banswara
2.40
1.49
5.55
7.62
13.71
Sawai Madhopur
3.43
2.52
1.02
1.56
9.91
Karauli
10.62
12.09
16.66
4.68
6.93
Tonk
0.99
5.25
3.47
2.07
6.26
Dausa
3.60
4.50
3.00
2.45
6.11
Ganganagar
2.18
0.84
1.75
2.35
6.11
Bundi
0.06
0.42
2.51
3.96
4.44
Pratapgarh
0.18
0.06
–
–
2.61
Hanumangarh
0.06
0.31
0.49
1.67
1.82
Jhalawar
2.39
3.27
2.63
3.88
1.01
Didwana-Kuchaman
–
–
0.29
0.05
–
Khairthal-Tijara
–
–
–
0.24
–
Kotputli-Behror
–
–
–
0.06
–
District not classified
282.01
169.67
173.29
209.45
1.93
Total (Rajasthan)
670.00
713.85
1,123.16
1,176.73
1,620.16
Sorted by FY2024-25. Source: Ministry of Corporate Affairs, Lok Sabha Starred Question No. 3, 20 July 2026, Annexure-III (data up to 31 March 2026, Corporate Data Management Cell). ‘-‘ = nil reported.
Why on-ground verification matters in Rajasthan
Rajasthan is the largest state in India by area, and its CSR-funding industries are dispersed across it – zinc and marble in the south and Aravallis, cement in the north and south-east, solar parks in the western desert. A programme reported as delivered in Rajasthan can be hundreds of kilometres from the next, across terrain that makes a quick site visit anything but quick. Under Rule 8(3) of the CSR Rules, large projects must be independently assessed by an agency that is not the implementer – and in a state this vast, the binding constraint is simply reaching every site to check it.
This is where a field network earns its keep: Anaxee’s Digital Runners operate across Rajasthan and 540 districts nationwide, so even projects scattered across the desert and the Aravallis can be verified with geo-tagged, timestamped proof – without flying a team to each one.
Field reach across Rajasthan – verification into the remote desert and Aravalli districts, not just the industrial towns. See our field services in Rajasthan.
Independent by design – Anaxee does not run the programmes it verifies, as Rule 8(3) requires.
Geo-tagged evidence – timestamped, photo-backed capture auditors and boards can rely on.
Running a CSR programme in Rajasthan? Let’s put independent, district-level field verification behind it – for impact assessment, plantation or farmer-programme verification.
Rajasthan recorded ₹1,620 crore in CSR in FY2024-25, up from ₹300 crore in FY2014-15 – a 5.4x rise over the decade. (Source: MCA National CSR Portal.)
Where does Rajasthan rank in CSR spending?
Rajasthan is the seventh-largest CSR recipient among 37 states and UTs, taking about 4.0% of national CSR – just ahead of Odisha.
What drives Rajasthan’s CSR?
Mining and metals (including zinc), cement, and a fast-growing solar and renewable-energy sector are the main CSR-funding industries, spread across the state.
Why is field verification harder in Rajasthan?
It is India’s largest state by area, and CSR-funded projects are dispersed across great distances – from the western desert to the Aravallis – so simply reaching every site to verify it is the main challenge.
Where does the Rajasthan CSR data come from?
From the Ministry of Corporate Affairs’ National CSR Portal (csr.gov.in), built from company disclosures under Section 135. Figures are state-wise reported CSR expenditure.
Which district in Rajasthan gets the most CSR?
Jaipur, with ₹347.79 crore in FY2024-25, followed by Udaipur (₹249.83 crore), Ajmer (₹134.13 crore), Jodhpur (₹106.83 crore) and Alwar (₹104.76 crore). The top four took 51.8% of Rajasthan’s CSR. (Source: Ministry of Corporate Affairs, Lok Sabha Starred Q. 3, 20 July 2026.)
How much CSR does Udaipur receive?
Udaipur received ₹249.83 crore of CSR in FY2024-25, up from ₹99.47 crore in FY2023-24 – second in Rajasthan after Jaipur.
How much CSR goes to Rajasthan’s aspirational districts?
Baran, Dholpur, Jaisalmer, Karauli and Sirohi received ₹115 crore in FY2024-25 – 7.1% of Rajasthan’s CSR.
Data note. Rajasthan figures (FY2014-15 to FY2024-25) are from the Ministry of Corporate Affairs’ National CSR Portal (csr.gov.in), state-wise reported CSR expenditure. District-wise figures (FY2020-21 to FY2024-25) are from the Ministry of Corporate Affairs’ reply to Lok Sabha Starred Question No. 3 (20 July 2026), Annexure-III, data up to 31 March 2026; Aspirational Districts per NITI Aayog. All amounts in ₹ crore. Compiled and field-verified by Anaxee Digital Runners.
Tamil Nadu is India’s 5th-largest CSR state at 2,738 crore in FY2024-25. A mature industrial base – and why delivery beyond the manufacturing corridors needs verification.
In short: Tamil Nadu recorded ₹2,738 crore in CSR in FY2024-25 – the fifth-highest of any state, 6.7% of national CSR, up 5.1x from ₹540 crore a decade earlier. That multiple is the smallest among the top states, but only because Tamil Nadu started from a high base: it was already an industrial CSR heavyweight. The open question is whether the spend reaches beyond the Chennai-Coimbatore-Hosur manufacturing belt into the delta and interior districts.
At a glance – CSR in Tamil Nadu
FY2024-25: ₹2,738 crore · rank 5 of 37 · 6.7% of national CSR · 5.1x growth in a decade · source: MCA National CSR Portal
Govt data, reconciledField reach across TNIndependent verification
Tamil Nadu is one of India’s oldest industrial economies – automobiles around Chennai and Hosur, textiles and knitwear in Coimbatore and Tiruppur, electronics and heavy engineering across the state. That deep corporate base is why it has long been a top CSR state, and why its decade growth looks modest next to states that started near zero. For a company running a CSR programme in Tamil Nadu, or a foundation funding work across its districts, the state total is healthy; where it reaches is the question worth asking. Here is what the Government’s National CSR Portal shows for Tamil Nadu. For the national picture, see our CSR spending in India hub.
How much CSR does Tamil Nadu receive?
Tamil Nadu’s CSR has risen from ₹540 crore in FY2014-15 to ₹2,738 crore in FY2024-25 – a 5.1x increase. The multiple is lower than fast-growing states because Tamil Nadu was already among the largest CSR recipients at the start of the decade.
Tamil Nadu CSR spend
₹540 Cr → ₹2,738 Cr
Tamil Nadu CSR expenditure, FY2014-15 vs FY2024-25 (₹ crore).
At ₹2,738 crore, Tamil Nadu is the fifth-largest CSR recipient among 37 states and UTs, 6.7% of the national total – just behind Delhi and ahead of Uttar Pradesh.
Rank
State / UT
CSR FY2024-25 (₹ Cr)
3
Karnataka
3,395
4
Delhi
2,753
5
Tamil Nadu
2,738
6
Uttar Pradesh
2,213
7
Rajasthan
1,620
Tamil Nadu’s position reflects a broad, long-established industrial base rather than a single boom sector. See how every state compares in our CSR spending by state analysis, or explore it in the interactive dashboard.
Why on-ground verification matters in Tamil Nadu
Tamil Nadu’s industry – and therefore its CSR – clusters along a few corridors: the Chennai automotive and electronics belt, the Coimbatore-Tiruppur textile cluster, Hosur, and the southern port and energy hubs. That leaves the Cauvery delta, the dry interior and the far-southern districts receiving far less, even though they carry much of the state’s agrarian and development need. A programme reported as delivered in Tamil Nadu may be concentrated in the industrial clusters while those districts go unchecked. Under Rule 8(3) of the CSR Rules, large projects must be independently assessed by an agency that is not the implementer – which here means verifying delivery across the whole state, not just the factory corridors.
This is where a field network earns its keep: Anaxee’s Digital Runners operate across Tamil Nadu and 540 districts nationwide, turning a reported CSR number into geo-tagged, timestamped proof that a school, plantation or farmer programme actually exists on the ground – in the delta and interior as readily as the industrial corridors.
Field reach across Tamil Nadu – verification into the delta and interior districts, not just the industrial clusters. See our field coverage across India.
Independent by design – Anaxee does not run the programmes it verifies, as Rule 8(3) requires.
Geo-tagged evidence – timestamped, photo-backed capture auditors and boards can rely on.
Running a CSR programme in Tamil Nadu? Let’s put independent, district-level field verification behind it – for impact assessment, plantation or farmer-programme verification.
Tamil Nadu recorded ₹2,738 crore in CSR in FY2024-25, up from ₹540 crore in FY2014-15 – a 5.1x rise over the decade. (Source: MCA National CSR Portal.)
Where does Tamil Nadu rank in CSR spending?
Tamil Nadu is the fifth-largest CSR recipient among 37 states and UTs, taking about 6.7% of national CSR – just behind Delhi.
Why is Tamil Nadu’s CSR growth multiple lower than other states?
Because it started from a high base – Tamil Nadu was already a top CSR state a decade ago thanks to its deep industrial economy, so its 5.1x growth reflects scale, not weakness.
Does Tamil Nadu’s CSR reach beyond its industrial corridors?
CSR concentrates around the Chennai, Coimbatore-Tiruppur and Hosur industrial clusters, so the delta and interior districts are exactly where independent, district-level field verification adds the most value.
Where does the Tamil Nadu CSR data come from?
From the Ministry of Corporate Affairs’ National CSR Portal (csr.gov.in), built from company disclosures under Section 135. Figures are state-wise reported CSR expenditure.
Data note. Tamil Nadu figures (FY2014-15 to FY2024-25) are from the Ministry of Corporate Affairs’ National CSR Portal (csr.gov.in), state-wise reported CSR expenditure. All amounts in ₹ crore. Compiled and field-verified by Anaxee Digital Runners.