How to Accurately Calculate Your Personal, Travel & Business Carbon Emissions

1. Introduction: 

Imagine you’re planning a sales trip across three cities—or booking a vacation—and you pause to ask: What’s the carbon cost of this journey? For most individuals and even businesses, that question doesn’t get asked, let alone answered with data. That’s where this blog steps in—no jargon, no abstract theory. Just clear, actionable steps to measure your emissions and understand your levers for change.

You’ll walk away knowing:

-The difference between Scope 1, 2, and 3 emissions.

-How to calculate your personal carbon footprint from daily life and travel.

-How businesses measure travel-related emissions—and streamline data challenges.

-The best tools available, and where they fall short.

-How to critically assess results and plot meaningful reductions.

Let’s start with the basics.
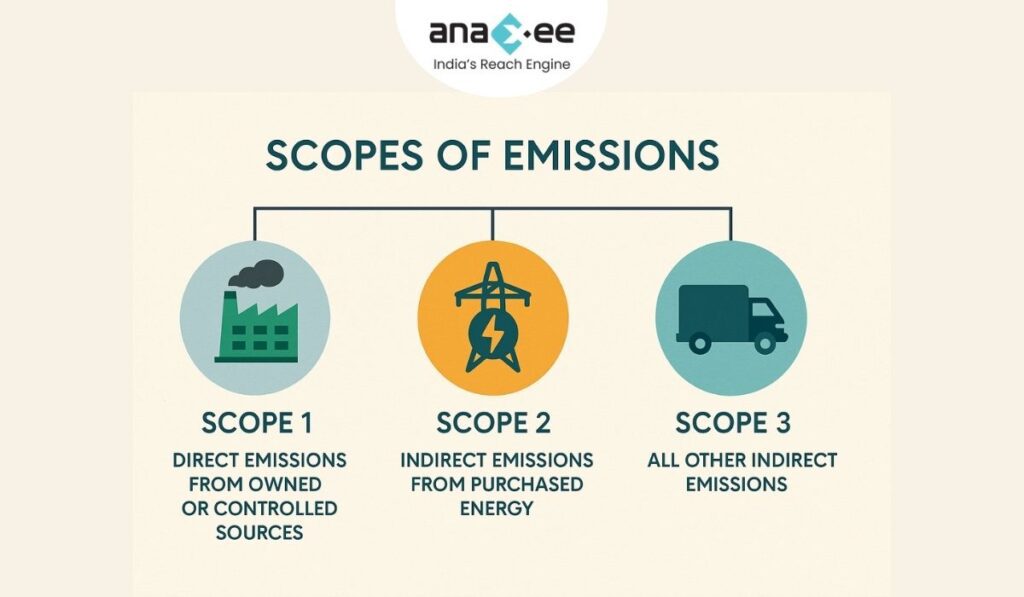
Scope of emissions


2. Understanding the Scopes of Emissions

-Scope 1 (Direct): Emissions you directly produce—driving your car or heating your home.

-Scope 2 (Indirect Energy): Emissions from energy you purchase—e.g. your home’s electricity or office power.

-Scope 3 (Other Indirect): Everything else you’re responsible for but don’t have control over—like business travel, flights you didn’t book directly, or rented vehicles.

This breakdown isn’t just bureaucratic: Scope 3 often dwarfs the others, especially for businesses reliant on travel. Too many individuals and companies ignore it. But airline trips, hotel stays, and third-party logistics are major carbon contributors—and in business, often the low-hanging fruit for real impact.


3. Calculating Personal Emissions

Home, Energy & Lifestyle

Use calculators like:

-EPA Carbon Footprint Calculator (home energy, transport, waste)

-UN Carbon Footprint Calculator (household, transport, lifestyle)

-Nature.org Calculator (simple and behavior-driven)

These tools categorize your inputs—electricity use, waste generation, daily travel—and give you a CO₂e estimate.

Travel & Commute

Prefer walking or cycling where possible. A European study found cyclists emitted 84% less per daily trip than motorists—and switching one car trip per day reduces your annual mobility emissions by about 0.5 tonnes.

Public transport generally emits less CO₂ per passenger than driving—especially if the mode is electric or high-capacity.

Flights

-ICAO Carbon Emissions Calculator is quick and official for airfare

-Atmosfair goes deeper—factoring in non-CO₂ effects like contrails and plane type. Their multipliers can mean 3–5× more warming impact than CO₂ alone.

Note: Carbon calculators vary. For instance, Travalyst’s TIM model once underestimated emissions—but has since revised estimates to account for non-CO₂ effects. Be cautious: every model makes assumptions.


4. Calculating Business Travel Emissions

Your simplest path: fuel-based, distance-based, or spend-based calculations.

-Fuel-based: Total fuel used × emission factor (CO₂ per liter).

-Distance-based: Kilometers traveled × per‑km emission factor. Collect mode- and region-specific data (air, rail, taxi, etc.)

-Spend-based: Use economic-based proxies when data is missing—e.g., expense × average emission per dollar.

For Scope 3, Category 6 (business travel), GHG Protocol offers structured guidance. Practical steps? Follow this:

  1. Collect data from booking tools or expense platforms: mode, distance, class, hotel nights.

  2. Categorise by transport mode & hotel type.

  3. Apply emission factors from sources like DEFRA, ICAO, or Green Stay.

  4. Translate to CO₂e, including methane and N₂O.

  5. Aggregate by department/location for reporting

Also, tools like Deloitte’s Travel Emissions Calculator can provide quick forecasts suited for projects or events.


5. Tools & Resources at a Glance


6. Reducing Emissions & Best Practices

-Travel Smart: Walk, cycle, or use public transport where feasible. Walk and cycle reduce emissions drastically—cycling interactions result in 84% lower daily emissions.

-Flight Efficiency: Prefer direct, economy flights. Offset responsibly (Gold Standard, Cool Effect, etc.)

-Corporate Practices: Use video calls instead of flying, optimize itineraries, prioritize eco-certified hotels, and source renewable energy.

-Lifestyle Impact: Reduce consumption. A Time study of four families found that purchasing behavior (online orders, food) drove most emissions, not just travel—choices like vegetarian diets and renewable energy lowered footprints.

-Advocacy Counts: Small changes matter. Cutting meat, supporting policy shifts, resource-conscious buying—all add up.


7. A Critical Perspective

Don’t accept numbers uncritically. Tools often approximate:

-Contrail effects are frequently ignored.

-Regional energy mixes (coal vs renewables) skew averages.

-Occupancy rates (e.g., how full a flight is) change per-passenger emissions.

-Models like Google’s carbon estimates have been disputed by airlines and agricultural sectors for inconsistency.

Bottom line: Use the most granular data you can, understand assumptions, and track changes over time—not absolutes.


8. Quick 5-Step Guides

For Individuals:

  1. Gather utility bills, commute distances, flight details.

  2. Use a personal calculator (EPA, UN, etc.).

  3. Identify top emission sources.

  4. Reduce (walk more, eat plant-based, cut waste).

  5. Offset if needed.

For Businesses:

  1. Pull travel data and categorize.

  2. Choose a calculation method (distance or spend-based).

  3. Use emission factors or reliable calculators.

  4. Aggregate by trip type or region.

  5. Set science-based reduction goals and report transparently.


9. Conclusion & Call to Action

Measuring your emissions isn’t busywork—it’s foundational to future-focused decision-making. Knowing your footprint, even imperfectly, allows you to act so you don’t look back with regret. Start with one calculator today. Share your insights. Challenge assumptions. Pinpoint where your greatest gains lie.

At Anaxee, we believe that accountability drives innovation—not corporate greenwashing. If you want to dig deeper, consider our sustainability audit services or monthly digest on emerging tools and metrics. The future favors those who measure up—literally.

About Anaxee:

Anaxee drives large-scale, country-wide Climate and Carbon Credit projects across India. We specialize in Nature-Based Solutions (NbS) and community-driven initiatives, providing the technology and on-ground network needed to execute, monitor, and ensure transparency in projects like agroforestry, regenerative agriculture, improved cookstoves, solar devices, water filters and more. Our systems are designed to maintain integrity and verifiable impact in carbon methodologies. 

Beyond climate, Anaxee is India’s Reach Engine- building the nation’s largest last-mile outreach network of 100,000 Digital Runners (shared, tech-enabled field force). We help corporates, agri-focused companies, and social organizations scale to rural and semi-urban India by executing projects in 26 states, 540+ districts, and 11,000+ pin codes, ensuring both scale and 100% transparency in last-mile operations.
 

How to Calculate Your Carbon Footprint: Step-by-Step Guide

How Do I Calculate My Carbon Footprint? A Complete Step-by-Step Guide


Introduction: Why Your Carbon Footprint Matters

When we talk about climate change, we often hear the term “carbon footprint.” But what does it really mean, and why should you care about calculating yours?

Your carbon footprint is essentially the total amount of greenhouse gases (GHGs)—mainly carbon dioxide (CO₂), methane (CH₄), and nitrous oxide (N₂O)—that are emitted into the atmosphere as a result of your actions. This could be from driving a car, heating your home, eating certain foods, manufacturing products, or even using digital services.

Understanding your footprint isn’t just a “green lifestyle” gimmick—it’s a critical step in knowing how much you’re contributing to global emissions and where you can make the biggest impact in reducing them.

If you don’t measure it, you can’t manage it. That’s true for your household, your business, and even at a national level. This guide will help you not only calculate your carbon footprint step-by-step, but also understand the common tools, pitfalls, and ways to take action.
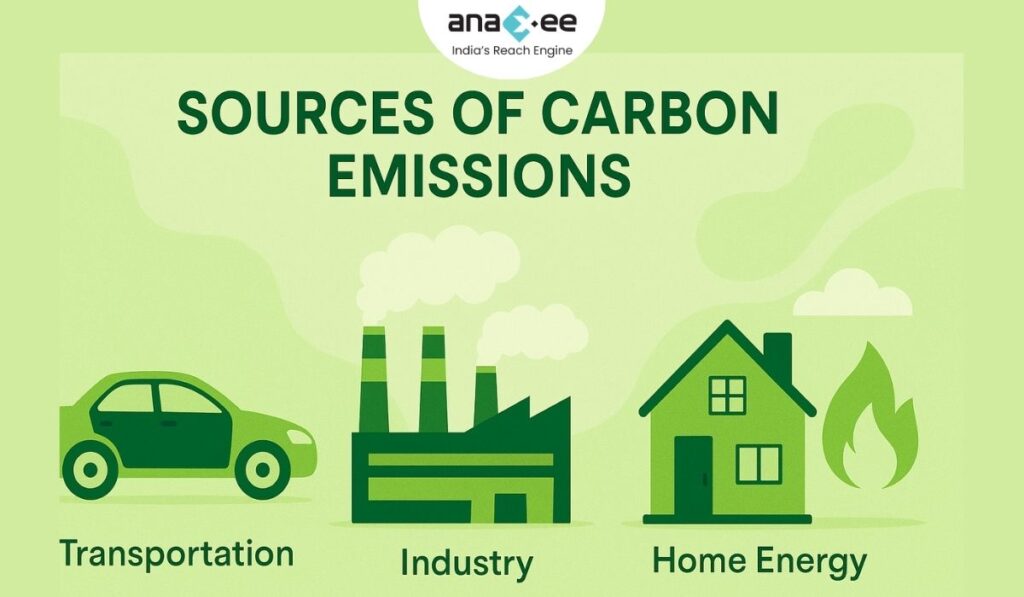
Graphics of Sources of Carbon Emissions


What is a Carbon Footprint?

In simple terms: Your carbon footprint is the sum total of all greenhouse gas emissions you generate, directly and indirectly, over a certain period of time.

-Direct emissions (Scope 1): The emissions you directly cause, such as burning petrol in your car or gas for heating.

-Indirect emissions from energy (Scope 2): Emissions caused by producing the electricity or heat you consume.

-Other indirect emissions (Scope 3): Emissions from the wider supply chain, such as the production of the clothes you buy or the waste you generate.

For example:

-Driving a petrol car emits CO₂ from fuel combustion (Scope 1).
-Using electricity from coal-fired power plants creates emissions indirectly (Scope 2).
-Ordering a fast fashion item shipped from another country adds emissions from manufacturing and transportation (Scope 3).


Why Should You Calculate It?

  1. Identify problem areas: Know which activities contribute most to your footprint.

  2. Set realistic reduction targets: Data beats guesswork.

  3. Track progress: See year-on-year improvement.

  4. Meet regulations and certifications: Many businesses require it for ESG reporting or carbon credit eligibility.

  5. Support global climate goals: Every ton of CO₂ avoided matters.


Step-by-Step: How to Calculate Your Carbon Footprint

The calculation process is more straightforward than most people think—if you follow a structured approach.


Step 1: Decide the Scope

Are you calculating for:

-An individual? (Personal travel, diet, home energy use)
-A household? (All residents’ combined usage)
-A business or organization? (All operations, supply chain, and product life cycles)

This will determine the level of detail and the type of data you’ll need.


Step 2: Gather Your Data

You’ll need accurate numbers for a given time period (usually a year):

For individuals/households:

-Electricity consumption (kWh from bills)
-Gas, LPG, or heating oil usage
-Water usage
-Car mileage and fuel consumption
-Public transport use (bus, train, metro)
-Flights (number, distance, class)
-Waste generation and recycling rates
-Diet type (meat-heavy, vegetarian, vegan)

For businesses:

-Fuel usage for company vehicles or machinery
-Electricity and heat consumption
-Freight and logistics records
-Employee commuting patterns
-Procurement data for goods and services
-Waste management data
-Production volumes


Step 3: Choose a Calculation Method

There are three main approaches:

1. Activity-based method

-Most accurate.
-Multiply your activity data by official emission factors.
Example: Litres of petrol × CO₂ factor per litre.

2. Spend-based method

-Simpler, uses money spent as a proxy.
Example: ₹10,000 spent on clothing × average emission factor per rupee.

Less precise because prices don’t always reflect carbon intensity.

3. Hybrid method

-Combines both approaches for a more balanced and realistic result.
-Recommended for businesses with partial data.


Step 4: Use a Reliable Calculator or Tool

Some trusted online calculators:

-CarbonFootprint.com – Suitable for individuals and small businesses.

-EPA Carbon Footprint Calculator – U.S.-focused but good for global estimates.

-Nature Conservancy’s Calculator – User-friendly, for individuals.

-Gold Standard Tools – Often used for project verification in carbon credit markets.

-Custom dMRV tools – For businesses, use tech platforms (like Anaxee’s Climate Command Centre) for ongoing tracking.


Step 5: Apply the Formula

The general equation is:

Carbon footprint = Activity data × Emission factor

Example for car travel:

-You drive 15,000 km/year.
-Your car consumes 6 litres per 100 km → 900 litres/year.
-Emission factor for petrol ≈ 2.31 kg CO₂/litre.
Result: 900 × 2.31 = 2,079 kg CO₂/year (≈ 2.08 tons CO₂).


Step 6: Sum It Up

Add all categories: energy use, transport, waste, products, and services. This gives you your total annual carbon footprint.


Real-World Examples

-Average Indian footprint: ~2 tons CO₂ per person/year.
-Global average: ~4.7 tons CO₂/year.
-U.S. average: ~16 tons CO₂/year.

A single return flight from Delhi to London in economy can add over 1 ton of CO₂ to your personal total.


Common Pitfalls in Calculation

-Incomplete data – Estimating too much leads to inaccuracy.
-Ignoring Scope 3 emissions – This often forms the majority for businesses.
-Using outdated emission factors – Always use the latest from recognized sources.
-Over-relying on spend-based methods – They mask real differences in carbon intensity.


Beyond Measurement: How to Reduce Your Footprint

  1. Switch to renewable energy – Solar, wind, or certified green electricity.

  2. Travel smart – Use public transport, carpool, or go electric.

  3. Change your diet – Reduce meat, especially beef and lamb.

  4. Buy less, buy better – Opt for quality, long-lasting goods.

  5. Waste less – Repair, reuse, recycle.

  6. Offset what’s left – Invest in verified carbon offset projects.


Business Benefits of Carbon Accounting

For organizations, calculating and reporting your carbon footprint can:

-Improve brand image and customer trust.
-Reduce operational costs through efficiency.
-Meet regulatory requirements.
-Access green finance or carbon markets.
-Strengthen ESG reporting.


Tools & Standards Worth Knowing

-GHG Protocol – The global standard for GHG accounting.
-ISO 14064 – International standard for emissions reporting.
-Life Cycle Assessment (LCA) – For product-level carbon footprints.


Call to Action

At Anaxee, we help individuals, corporates, and project developers measure, monitor, and reduce carbon footprints using our on-ground data collection and digital monitoring tools. Whether you want to understand your own footprint or track it across a large-scale project, we can make it accurate, transparent, and actionable.


Ready to measure yours?
Start with a trusted calculator today—and take your first step toward a smaller footprint.


About Anaxee:

Anaxee drives large-scale, country-wide Climate and Carbon Credit projects across India. We specialize in Nature-Based Solutions (NbS) and community-driven initiatives, providing the technology and on-ground network needed to execute, monitor, and ensure transparency in projects like agroforestry, regenerative agriculture, improved cookstoves, solar devices, water filters and more. Our systems are designed to maintain integrity and verifiable impact in carbon methodologies.

Beyond climate, Anaxee is India’s Reach Engine- building the nation’s largest last-mile outreach network of 100,000 Digital Runners (shared, tech-enabled field force). We help corporates, agri-focused companies, and social organizations scale to rural and semi-urban India by executing projects in 26 states, 540+ districts, and 11,000+ pin codes, ensuring both scale and 100% transparency in last-mile operations.



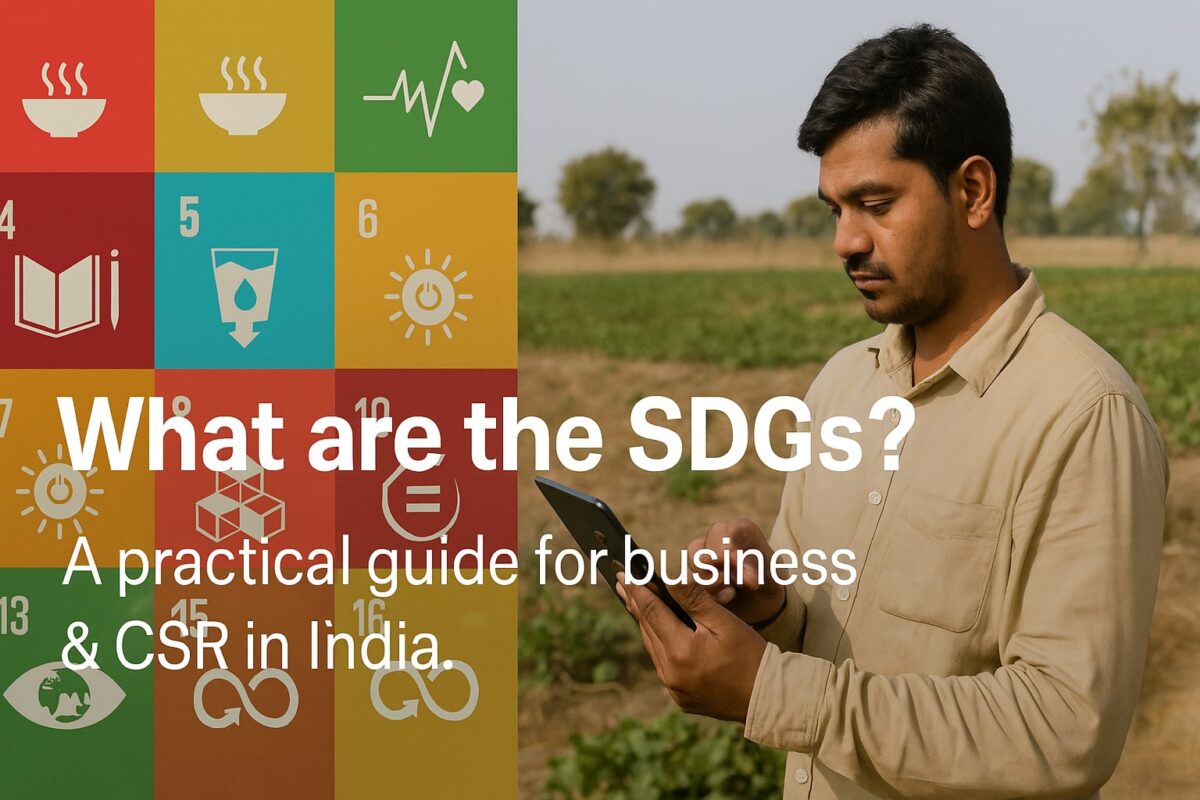
What are the Sustainable Development Goals? A Practical Guide for Businesses & CSR in India

What are the Sustainable Development Goals?

(A practical guide for companies, investors, and CSR/ESG teams in India)

The Sustainable Development Goals (SDGs) are 17 globally agreed targets adopted by all UN Member States in 2015 to be achieved by 2030. They cover poverty, health, education, gender equality, water, energy, jobs, industry, cities, climate, biodiversity, and governance. Progress is real but off-track overall; the 2025 UN status report shows persistent gaps and a multi-trillion-dollar annual financing shortfall. India measures SDGs state-by-state using the SDG India Index; the 2023–24 edition reports a national score of 71 with notable gains on poverty reduction, jobs, climate action, and life on land. For companies, SDG-aligned projects translate into risk reduction, access to finance, compliance readiness, and measurable impact—provided there’s credible dMRV and last-mile execution.

1) The basics—what the SDGs are (and what they’re not)

Definition. The Sustainable Development Goals (SDGs) are 17 global goals and 169 targets adopted under the 2030 Agenda for Sustainable Development in 2015. Every UN Member State signed on, making the SDGs the most widely accepted development framework in history.

Purpose. The SDGs are a blueprint to end extreme poverty, reduce inequality, and protect the planet while sustaining economic growth and good governance. This is not a charity wishlist; it is a policy-and-metrics framework that helps governments and markets pull in the same direction.

Measurement. The SDGs are tracked through a global indicator framework that’s periodically updated. As of 10 April 2025, the UN system classifies 161 indicators as Tier I (methodology and data widely available) and 60 as Tier II (methodology clear, data not universal), among others—meaning the technical underpinnings are mature for most key metrics.

What SDGs are not. They’re not a single certification logo, not a replacement for local laws, and not a one-size KPI set for every organization. They’re a public good: a global scoreboard governments, companies, financiers, and civil society can align to.


2) The 17 Goals—one-line summaries for decision makers

  1. No Poverty (SDG 1): End poverty everywhere.

  2. Zero Hunger (SDG 2): Food security, better nutrition, and resilient agriculture.

  3. Good Health & Well-being (SDG 3): Universal health coverage, maternal/child health.

  4. Quality Education (SDG 4): Inclusive, equitable learning for all.

  5. Gender Equality (SDG 5): End discrimination/violence; ensure participation and rights.

  6. Clean Water & Sanitation (SDG 6): Safe water, sanitation, hygiene, and watershed management.

  7. Affordable & Clean Energy (SDG 7): Universal access to modern, renewable energy.

  8. Decent Work & Economic Growth (SDG 8): Jobs, SME growth, productivity, safety.

  9. Industry, Innovation & Infrastructure (SDG 9): Sustainable industrialization, R&D, resilient infrastructure.

  10. Reduced Inequalities (SDG 10): Inclusion across income, age, gender, migration.

  11. Sustainable Cities & Communities (SDG 11): Housing, mobility, pollution, resilience.

  12. Responsible Consumption & Production (SDG 12): Resource efficiency, waste prevention.

  13. Climate Action (SDG 13): Mitigation, adaptation, finance, capacity-building.

  14. Life Below Water (SDG 14): Oceans, fisheries, pollution control.

  15. Life on Land (SDG 15): Forests, land degradation, biodiversity.

  16. Peace, Justice & Strong Institutions (SDG 16): Rule of law, transparency, anti-corruption.

  17. Partnerships for the Goals (SDG 17): Finance, technology, trade, data, and collaboration.

Board takeaway: Think of the 17 goals as a risk map + opportunity pipeline. Each goal touches a material ESG category with clear policy momentum and—importantly—tracking indicators you can report against.


3) Where the world stands in 2025—progress, but not enough

Status check. The UN SDG Report 2025 flags two truths: (1) millions of lives have improved since 2015 (e.g., access to electricity, mobile broadband, some health outcomes), (2) but the world remains off-track on most targets—especially on climate, biodiversity, food security, and financing. Macroeconomic headwinds and debt overhangs in developing countries are slowing progress.

The money gap. The annual SDG financing gap for developing countries is now estimated at ~$4 trillion—a jump from pre-pandemic levels. This is why blended finance, MDB reform, tax cooperation, and private capital mobilization dominate the policy conversation.

Political reality. International negotiations in 2025 continue to wrestle with development finance and governance. Outcomes matter because they influence concessional funding, debt terms, and the policy environment for corporate projects.

So what? Expect rising disclosure demands (on impact, nature, and value chain), more results-based finance, and a premium on credible data. Organizations that can prove delivery at the last mile will get funded faster.


4) India’s SDG picture—signals that matter for business

India tracks progress through the SDG India Index, published by NITI Aayog. The 2023–24 edition reports a national composite score of 71, up from 66 (2020–21) and 57 (2018 baseline). Gains are strongest on SDG 1 (No Poverty), SDG 8 (Decent Work), SDG 13 (Climate Action), and SDG 15 (Life on Land). State/UT scores range 57–79. Translation: policy and program alignment is rising, and procurement/CSR windows are opening around climate and livelihoods.

Implication for corporates/CSR: There’s a policy-backed, measurable pathway to fund and implement nature-based, livelihood, and health/education interventions—if you can deliver verifiable outputs and outcomes.


5) How the SDGs are measured—targets, indicators, tiers (and why this matters to your CFO)

Each SDG has targets and indicators. Indicators are grouped by Tier:

Tier I: Methodology and data widely available (low reporting friction).

Tier II: Methodology clear; data not regularly produced by many countries (medium friction).

Multiple Tiers / Pending review: Complex metrics or components under evaluation.

As of April 10, 2025, the UN lists 161 Tier I and 60 Tier II indicators (plus a small set with mixed tiers/pending review). For companies, this means more mature KPIs to align with—reducing the risk of “impact-washing” and making CFO-grade reporting feasible.


6) Why companies should care—hard benefits, not soft PR

Capital access: Development banks, impact funds, and sustainability-linked instruments increasingly tie terms to SDG-relevant outcomes—energy access, climate resilience, biodiversity, livelihoods. Strong projects can lower cost of capital.

Compliance readiness: SDG-aligned reporting dovetails with evolving disclosure regimes and supply-chain expectations (scope emissions, nature, human rights).

Market expansion: SDG-aligned products tap new demand (clean energy devices, water filters, climate-smart ag inputs) and unlock public co-funding.

Talent & brand: Evidence-backed impact attracts talent and partners—increasingly a procurement prerequisite, not a nice-to-have.

Caveat: None of this works without proof—geo-tagged data, independent QA, permanent traceability, and on-ground feedback loops.


7) From SDGs to execution—what credible projects look like

A credible SDG-aligned project should demonstrate:

  1. Clear problem → measurable outcome (e.g., “X households receive clean cooking devices; Y% reduction in PM2.5 exposure; Z tCO₂e avoided”).

  2. Target–indicator mapping to at least one SDG (primary) and secondary co-benefits.

  3. dMRV (digital Measurement, Reporting, Verification) with geo-evidence, time stamps, and beneficiary consent.

  4. Last-mile operations with trained local teams; not just one-time deployments.

  5. Independent QA and audit trails.

  6. Data governance and grievance mechanisms (relevant to SDG 16).

  7. Transition plan—maintenance, repairs, engagement beyond Day 0.

These aren’t buzzwords; they’re how you survive scrutiny from auditors, financiers, and the public.


8) Mapping common project types to SDGs (examples Anaxee can execute)

-Agroforestry on smallholder landsSDG 13 & 15 (climate and biodiversity), SDG 1 & 8 (farmer incomes, jobs). Requires baseline/census, survivability audits, and seasonally tuned field ops.

-Clean energy devices (solar lanterns, SHS)SDG 7, co-benefits for SDG 3 (health), SDG 4 (study hours), SDG 13. Needs device registry and after-sales service logs.

-Clean cookingSDG 3 & 7, SDG 5 (gender/time savings), SDG 13. Track usage data, fuel displacement, health proxies.

-Water filters / water ATMsSDG 6, SDG 3. Requires water-quality logs, uptime monitoring, replacement cycles.

-Beneficiary identification & targeting → Cross-cutting; essential for SDG 1, 2, 3, 4, 5 and 16 (inclusion, accountability).

-Digitization of climate data (dMRV) → Enabler for SDG 13, 15 and reporting across the board.

(All SDG goal definitions and linkages per UN goal descriptions.)


9) The financing conversation you can’t avoid

Reality check: The $4T+/year SDG financing gap won’t close with philanthropy alone; private capital is now central. Expect performance-based contracts, blended structures, and stronger due diligence around data quality and permanence of outcomes. Projects that prove additionality, durability, and social safeguards will move first.

What to prepare:

-3–5 year impact pro-forma with conservative baselines.

-Indicator mapping (UN indicator codes where relevant) to shorten diligence.

-Ops manual: SOPs for enrollment, training, maintenance, and exit.

-Risk register (seasonality, supply chain, beneficiary attrition) with mitigation plans.

-Independent QA plan and data sharing terms.


10) India strategy—align with the SDG India Index

Since the SDG India Index scores states/UTs, align proposals with state priorities that are already trending up (e.g., climate action, poverty reduction, life on land). This improves buy-in, co-funding odds, and speed. Use the index to justify geographic focus and set realistic targets without overpromising.


11) How Anaxee de-risks SDG-aligned projects (execution, not jargon)

Why this matters: Many projects fail not on ideas, but on weak ground execution—missing baselines, poor training, data holes, and zero follow-up.

What we do differently:

-Last-mile workforce at scale: trained local digital runners with live feedback loops from a central 125+ member team coordinating checks, corrections, and escalation.

-Census-based enrollment (not estimates), polygon mapping, and tree/device registries with unique IDs, geo-tags, and time stamps.

-dMRV stack: mobile apps, QC dashboards, audit logs, and photo/video protocols tied to SDG indicator logic where relevant.

-QA & re-verification: randomized back-checks, survivability audits, and grievance channels.

-Partner-ready data: datasets structured for financiers and auditors.

Bottom line: If you need SDG-aligned results you can defend, you need verifiable data and trained teams that don’t disappear after deployment.


12) Frequently asked questions (straight answers)

Q1. Is “doing SDGs” just CSR?
No. The SDGs are a global policy and measurement framework. CSR is one vehicle to fund SDG-aligned work. Many SDG projects are commercial or blended finance.

Q2. Which SDGs should my company prioritize?
Start with materiality: your supply chain risks and core strengths. Then choose a primary SDG and 1–2 co-benefits where you can actually measure outcomes.

Q3. How do we report?
Map activities to UN indicators where possible, set baselines, and use verifiable dMRV. Avoid vanity metrics.

Q4. What’s new in 2024–2025?
Updated indicator tiers, a clear financing gap number that’s driving MDB reform debate, and ongoing policy focus on results-based funding. Translation: strong data beats glossy decks.


13) A simple, SDG-aligned corporate action plan (90 days)

Weeks 1–2: Prioritize & baseline

-Pick 1–2 SDGs aligned to your business.
-Define indicators and data you can feasibly collect.
-Commission a rapid baseline (geo-tagged).

Weeks 3–6: Pilot design

-Choose 2–3 districts and a single intervention (e.g., agroforestry bundles or water filters).
-Lock SOPs for training, deployment, and QA.
-Pre-wire reporting templates to match UN indicator logic (where applicable).

Weeks 7–12: Launch & verify

-Train local teams; push live checklists.
-Capture data in dMRV; run back-checks.
-Publish a concise results note with photos, geo-evidence, and beneficiary feedback.

Day 90: Decide to scale or refine; line up co-funding or performance-based contracts.


14) Common mistakes to avoid

-Counting activities instead of outcomes. Handing out devices isn’t impact; sustained usage is.
-Ignoring seasonality. Agroforestry done off-season = survivability risk.
-No maintenance budget. Water filters and clean cookstoves fail without service cycles.
-Data holes. If it’s not geo-tagged/time-stamped with QA, expect pushback.
-Over-claiming co-benefits. Tie claims to specific indicators or keep them conservative.


15) The road to 2030—pragmatic optimism

We’re past the halfway mark. The world is off-track at the macro level, but credible, verifiable projects can still move the needle—especially in climate-nature-livelihood intersections where India has scaled programs and state-level prioritization. The organizations that combine operational depth with clean data will shape outcomes—and capture the upside.

If you want SDG results you can publish without hedging, partner with teams that can execute and verify on the ground.

About Anaxee:

Anaxee drives large-scale, country-wide Climate and Carbon Credit projects across India. We specialize in Nature-Based Solutions (NbS) and community-driven initiatives, providing the technology and on-ground network needed to execute, monitor, and ensure transparency in projects like agroforestry, regenerative agriculture, improved cookstoves, solar devices, water filters and more. Our systems are designed to maintain integrity and verifiable impact in carbon methodologies.

Beyond climate, Anaxee is India’s Reach Engine- building the nation’s largest last-mile outreach network of 100,000 Digital Runners (shared, tech-enabled field force). We help corporates, agri-focused companies, and social organizations scale to rural and semi-urban India by executing projects in 26 states, 540+ districts, and 11,000+ pin codes, ensuring both scale and 100% transparency in last-mile operations.
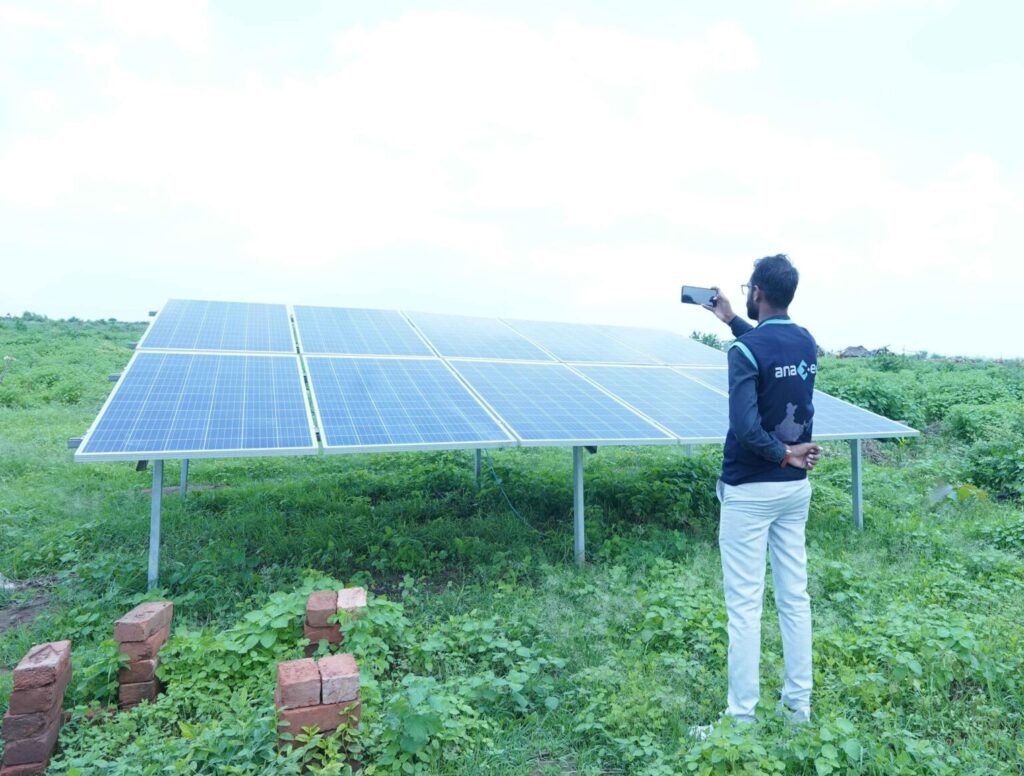
An Anaxee field worker photographs a ground-mounted solar panel array in a lush farm, documenting a solar-agriculture pilot in rural India.

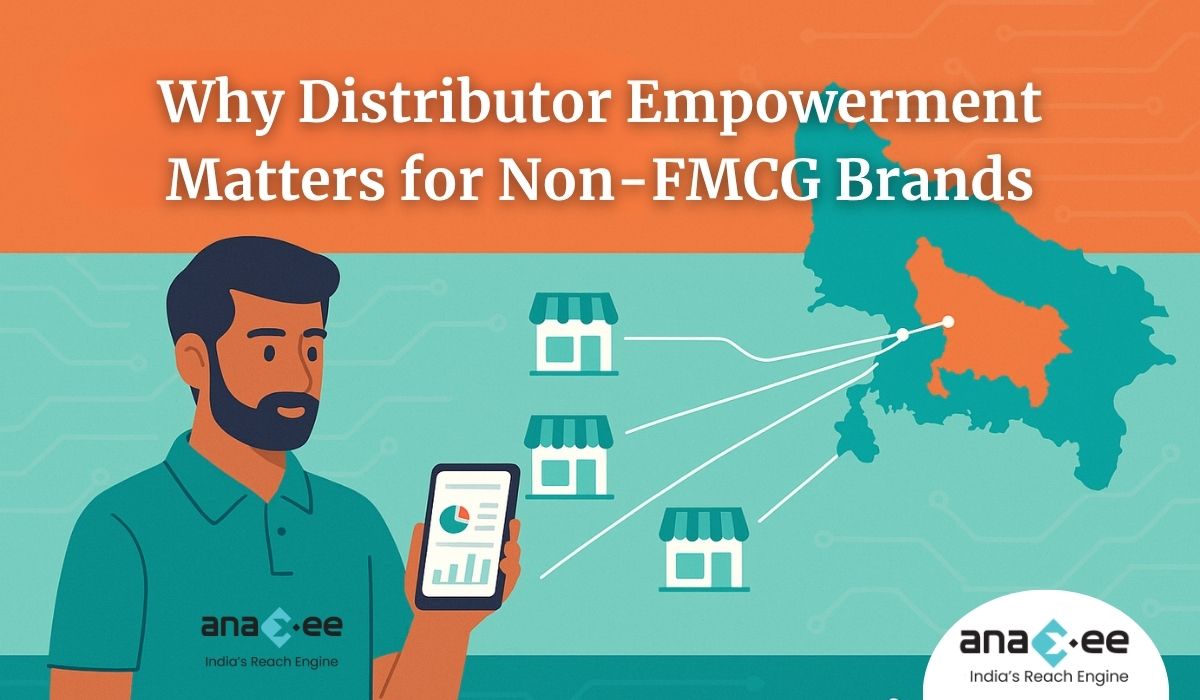
Why Distributor Empowerment Matters for Non-FMCG Brands | Anaxee’s Go to Market Strategy

Why Distributor Empowerment Matters for Non-FMCG Brands

“The reason behind the success of top FMCG companies in India is their focus on supporting distributors and helping them in generating sales.”

Electronics, automotive spares, cookware, footwear- India’s vast “non-FMCG” universe moves through the same dusty godowns, two-ton Eicher trucks, and corner stores that sell toothpaste. Yet most non-FMCG brands treat distribution as a cost centre, not a growth lever. The result? Patchy presence, lopsided shelf share, month-end fire-sales, and a constant scramble for new channel partners.

This blog digs into:

  1. The structural limits distributors face in non-FMCG sectors

  2. Why “empowerment” beats “management”

  3. How Anaxee Digital Runners converted Prestige’s reach in East Uttar Pradesh from thin lines on a map to a living sales engine

  4. A practical playbook you can lift-and-shift for your own brand

Language is deliberately plain and factual—no corporate fluff, no robotic AI prose.


1. Distributors: The Limits No One Talks About

Most brands hire a C&F agent, appoint one or two district distributors, and move on. Here are the hidden constraints inside that model:

All of this is echoed in the GTM deck: distributors miss uniform monthly sales, full district potential, and expansion to nearby towns/talukas , while juggling competing brands and limited visibility . In short, even the most motivated partner is shackled by structure.


2. Empowerment vs. Management

Traditional “distributor management” = meeting at a dhaba, scolding about targets, dumping more stock. Empowerment flips the lens:

Anaxee condenses empowerment into a three-step GTM engineMarket Mapping, Retailer Profiling, Order Taking. The tech core removes guesswork; the human core (Digital Runners) removes inertia.


3. Case Study- Prestige in Eastern Uttar Pradesh

Before we show dashboards, remember the terrain: 9 districts, mixed Hindi dialects, dense retail clusters around tehsils, and roads that turn to slush in monsoon. Prestige, famous for pressure cookers and small appliances, wanted width and depth—meaning more outlets per district and higher category billing per outlet.

3.1 Market Mapping

-Top five districts alone (Deoria, Gorakhpur, Sultanpur, Jaunpur, Prayagraj) held 2,791 stores—over 35 % of the region’s potential

-2000 shops mapped across East UP in one blitz month

We tagged every outlet’s GPS, class (A/B/C), and appliance categories. The Prestige team saw, often for the first time, a heat-map of “white spaces” in their Excel territory plan.

3.2 Retailer Profiling

Inside each store our runner captured:

-Existing brands (Bajaj, Orient, Greenchef, Prestige)

-Purchase source (wholesale or direct distributor)

Willingness to stock new SKUs

Owner’s mobile + WhatsApp (for order confirmation)

A sample profile from Maharajganj illustrates the depth.

3.3 Order Taking

Using the Anaxee app, runners began structured visits:

-Average 4 visits to convert fence-sitters

-First-order ticket often ₹ 5,000–₹ 25,000 for small appliances

-SKU focus: convert induction-stove sellers to add mixers & grinders, widening catalogue penetration

By month three, previously “silent” districts like Gonda and Chandauli started reporting predictable lift.

3.4 What Changed for Distributors
  1. Uniform Demand Curves – Weekly app-orders created stock visibility, smoothing peaks and troughs.

  2. New Retail Footprint – Distributors delivered to outlets that had never asked for Prestige.

  3. Less Cashflow Stress – Data on retailer credit cycles let them stagger invoicing.

  4. Competitive Moat – Shelf presence rose; rivals faced higher switch cost to dislodge Prestige.


4. The Anaxee Toolbox for Distributor Empowerment

In plainer words: we give distributors data dashboards, trained field runners, and ready-to-ship orders– a cocktail that even the best FMCG majors took decades to perfect.


5. Building Your Own Empowerment Programme- A Step-by-Step Template

  1. Audit Current Reach
    Take a pen and list every taluka where your sales are <50 % of state average. Those are your phase-one zones.

  2. Adopt Market Mapping
    Shoot for 100 % shop census, not sample studies. A half map is an uncharted jungle.

  3. Profile Retailers Meticulously
    Capture owner phone, categories, shelf metre length, and willingness score (0–5).

  4. Create a Runner Cadre
    Whether you partner with Anaxee or DIY, you need local language field reps armed with a phone, not a brochure.

  5. Design Order-taking Cadence
    Four visits convert most non-brand retailers; log each visit reason and next action.

  6. Share Data in Real-time
    Transparency is the carrot for distributors; let them see pending orders and ageing stock daily.

  7. Layer Promotions After Baseline Sales
    Once width is fixed, run depth offers—mixers with induction stoves, helmets with bikes, etc.


6. Frequently Asked Questions

Q. “My distributors fear losing control if I bring an external team.”
In UP, 90 % of distributors warmed up once they saw pre-paid retailer orders queued in the app.

Q. “Isn’t this expensive?”
It Depends on the Shops, but repeat order recovers that.

Q. “Will retailers talk to a runner they don’t know?”
Anaxee runners are local—often a friend of the retailer’s nephew. Adoption is faster than out-of-town SOs.


7. Key Takeaways

-Distributors are growth partners, not just intermediaries.

-Empowerment needs data + local human touch + repeatable process.

-Prestige’s story proves that even crowded categories can carve new share with a field-first, tech-backed model.

-The earlier you map, profile, and enable, the cheaper your category conquest becomes.


Conclusion & Call-to-Action

The highways of non-FMCG commerce are still dominated by independiente distributors who juggle multiple brands and razor-thin margins. When you give them visibility, velocity, and validation, they return the favour with loyalty and volume.

Ready to turn your distributor chain into a growth engine? Talk to Anaxee at sales@anaxee-wp-aug25-wordpress.dock.anaxee.com

About Anaxee:

Anaxee is India’s Reach Engine- building the country’s largest last-mile outreach network of 100,000 Digital Runners (shared, tech-enabled feet-on-street). We enable brands, corporates, and agri-focused companies to break distribution barriers and scale their presence into rural and semi-urban India, covering 26 states, 540+ districts, and 11,000+ pin codes. Our technology-driven GTM solutions deliver on-ground activations, customer acquisition, lead generation, and project execution at unmatched speed and scale- while ensuring complete visibility and control over last-mile operations.

Alongside commercial execution, Anaxee also leads large-scale Climate and Carbon Credit projects nationwide. We provide the tech and field infrastructure to implement and monitor Nature-Based Solutions (NbS) and community projects like agroforestry, regenerative agriculture, and clean energy interventions, bringing transparency and verifiable impact to global carbon markets.

Want to scale your business or explore GTM partnerships?
Contact us: sales@anaxee-wp-aug25-wordpress.dock.anaxee.com

Anaxee's Field team in Indian Market

Inside Anaxee’s Climate Command Centre: How We Execute Carbon Projects at Scale with Precision

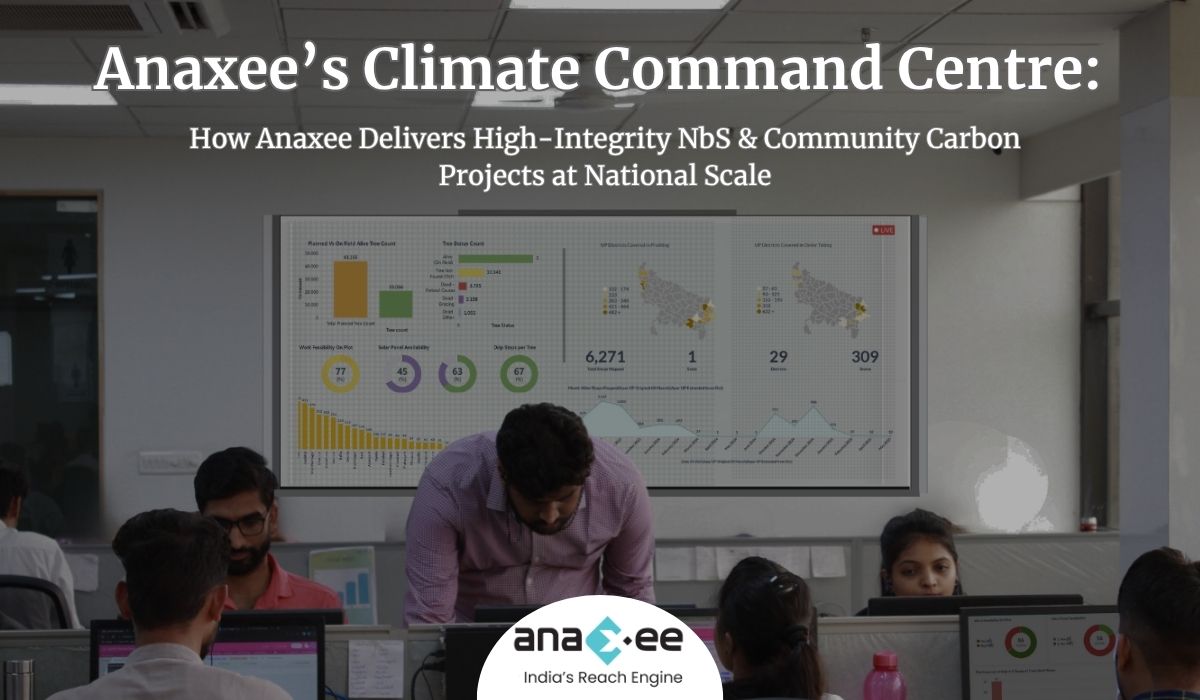
Anaxee’s Climate Command Centre: Carbon Projects with Precision and Scale

When most people think about carbon credit projects, they imagine forests being planted or cookstoves being distributed. But what they often overlook is the backend engine- the systems, people, and technology that make sure these projects are done correctly, at scale, and with trust. That engine, at Anaxee, is called the Climate Command Centre.

Let’s take you inside.

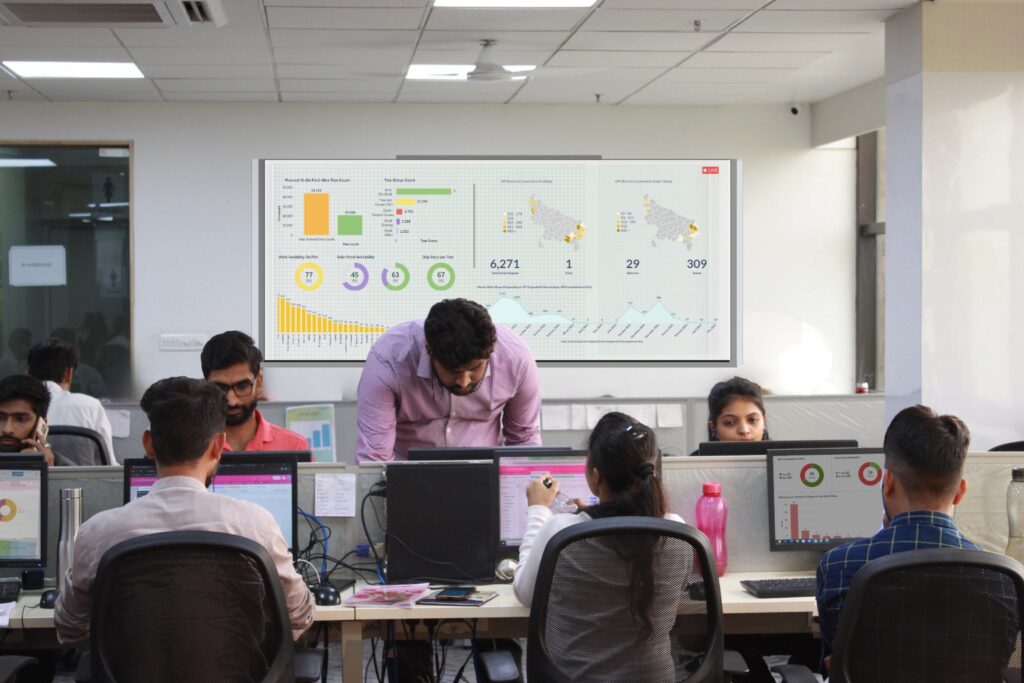
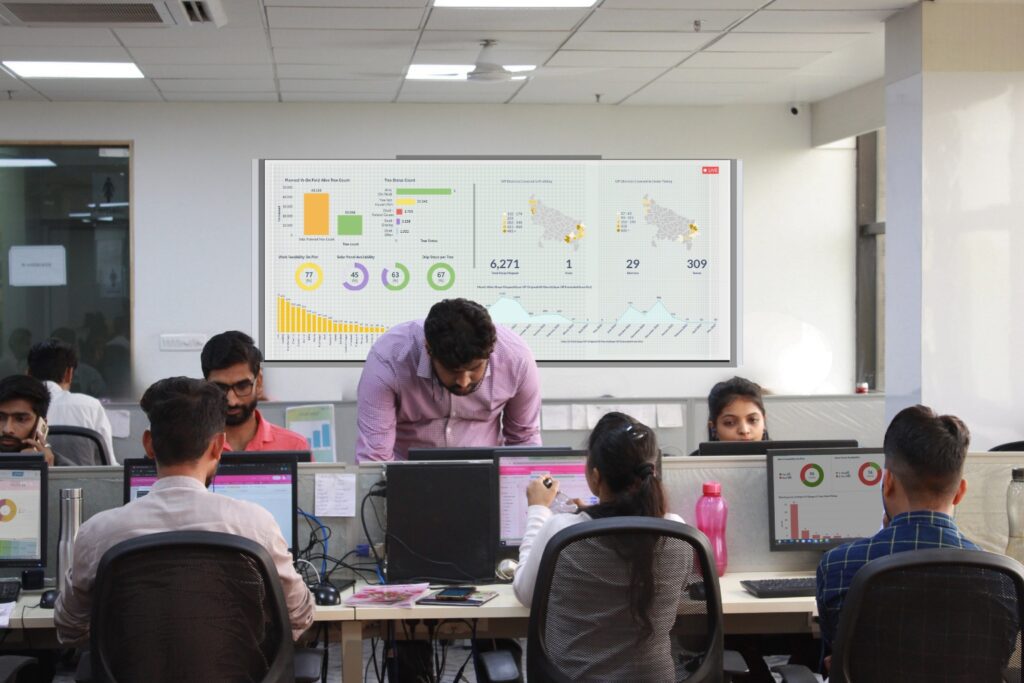
Dashborad on Wall, Anaxee's Climate Command Centre

What is the Climate Command Centre?

Anaxee’s Climate Command Centre is a centralised project management hub built to monitor and execute climate projects across thousands of locations in India. From tribal villages in Odisha to farming belts in Maharashtra, our Climate Command Centre operates like a control tower. It coordinates a workforce of 100,000+ Digital Runners, backed by a dedicated team of 125+ employees stationed at our headquarters.

While our Digital Runners collect ground-level data and engage with communities, our internal team reviews, guides, and manages the end-to-end lifecycle of each project.

We handle:

-Project planning & deployment

-Real-time monitoring of ground activity

-Continuous training

-Quality checks

-Data validations

-Beneficiary onboarding

-Dashboards and Reporting

Let’s break down how it all works.


Our Secret Weapon: 125+ Team Members Coordinating Every Step

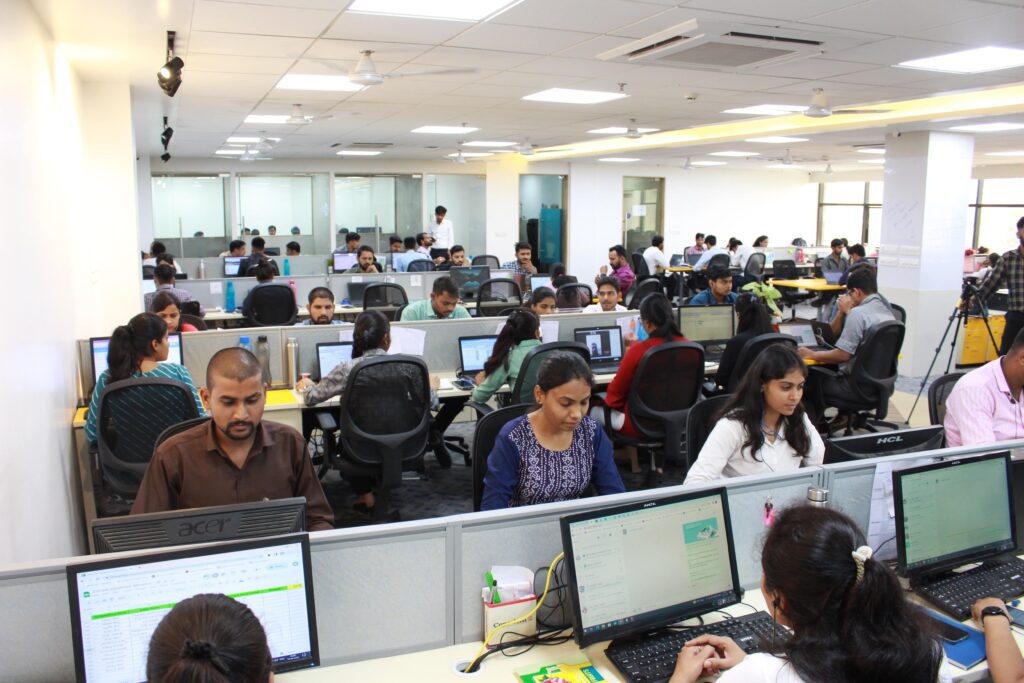
Office Staff Sitting/working in office for Carbon Climate Project

Executing a carbon project isn’t just about planting trees or delivering clean cookstoves. It’s about ensuring that every tree is planted at the right depth, every stove reaches a genuine beneficiary, and every piece of data is auditable. That level of precision is possible because of our dedicated 125+ team members, each assigned to specific processes.

Their work includes:

-Tracking Digital Runner activity in real-time

-Monitoring data uploads and location tagging

-Assigning and reassigning tasks based on data gaps

-Resolving field-level issues instantly

-Flagging quality issues for correction

Example: Agroforestry Monitoring

In agroforestry, Digital Runners geo-tag tree pits, click pre- and post-plantation photos, and record species-level data. Our internal team validates if the pits meet depth requirements (e.g., 1x1x1 ft), reviews timestamped photos, and ensures sapling count matches the project design. If any issue arises, immediate feedback is sent to the Runner with corrective instructions.

This is project management at the micro level, scaled up across 5000+ villages.


Localized Power: Why Digital Runners Are Key

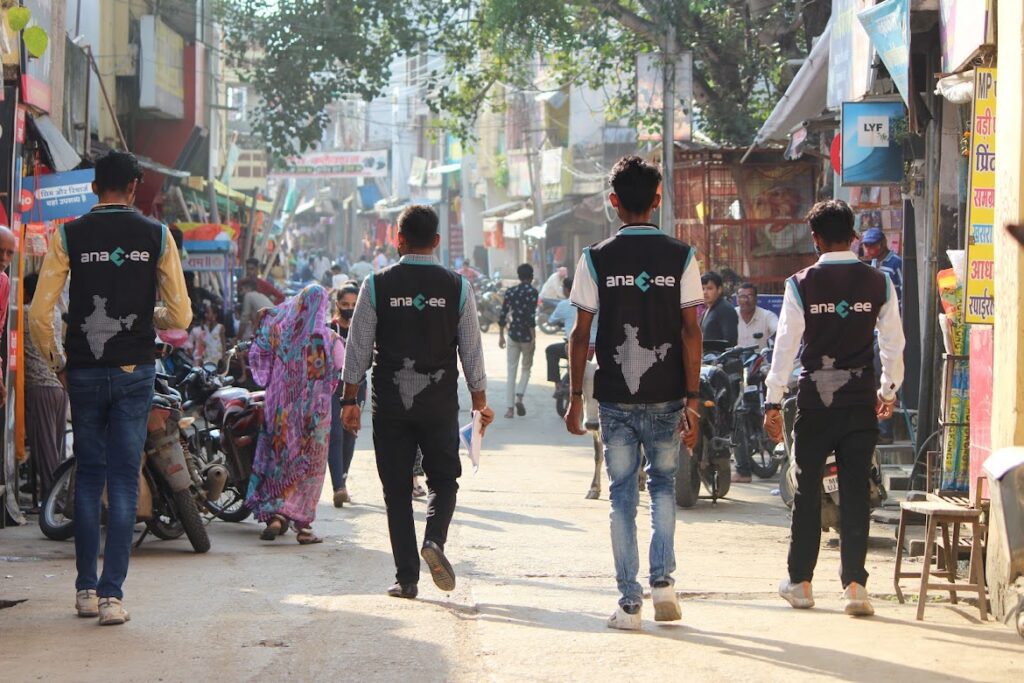
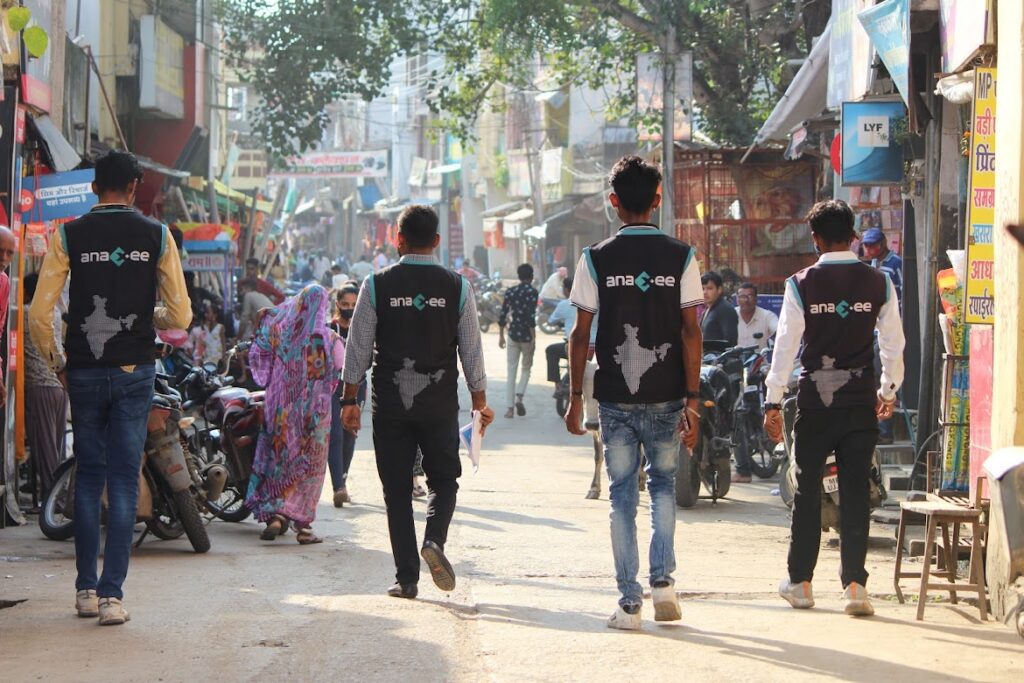
Four Anaxee Digital Runners in branded vests walk down busy market street to map retailers

Instead of parachuting people into rural areas, we hire Digital Runners from their own localities. This gives us several advantages:

-Trust: Locals are more welcomed by the community.

-Familiarity: They know local dialects, routes, and dynamics.

-Accountability: They stay in the same region and can be traced.

Digital Runners aren’t just data collectors. They are:

-Trained field agents

-Project ambassadors

-Beneficiary verifiers

We combine this local trust with robust backend support.


Training That Actually Works: From Zoom to Field

Before any Runner is activated, they go through a structured training program that includes:

-Video modules in regional languages

-Live Zoom sessions for Q&A

-On-ground field demos with supervisors

-Interactive quizzes to verify learning

Why Training Matters

Dashboard view of Different Climate Project Training for Digital Runners |Anaxee Digital Runners Training Portal

In an Agroforestry project, if a sapling is planted incorrectly (e.g., shallow pits, incorrect spacing), it could die within months—invalidating future carbon credits. Training ensures:

-Accurate spacing and layout of plantations

-Correct species mapping

-Understanding of the project’s climate goal

We don’t assume knowledge. We train for it, test for it, and track it.


Our Digital Stack: Real-Time, Transparent, Traceable

Technology is the backbone of our project management. We’ve built a full-stack system that includes:

1. Anaxee Partner App
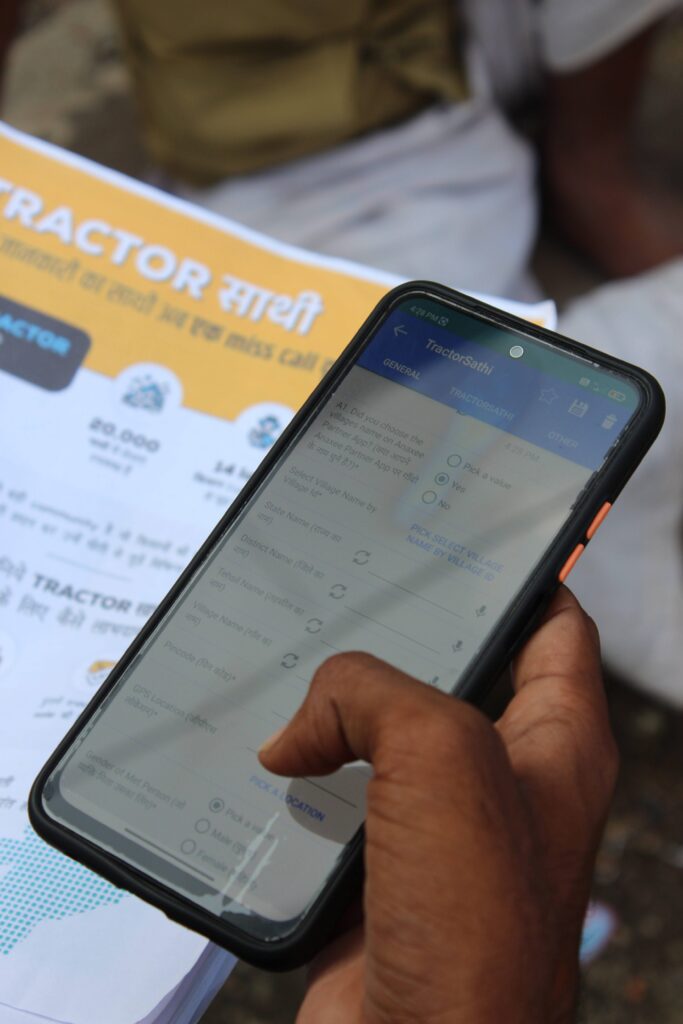
Anaxee's Digital Runner holding mobile phone on his hand, taking data of retailer for a Non FMCG project.

Used by Digital Runners to:

-Get assigned tasks

-Upload GPS-tagged images

-Fill in project forms

-Record feedback from the ground

2. Training Portal

-Video content

-PDF manuals

-Language-specific quizzes

-Score tracking for certification

3. dMRV Platform


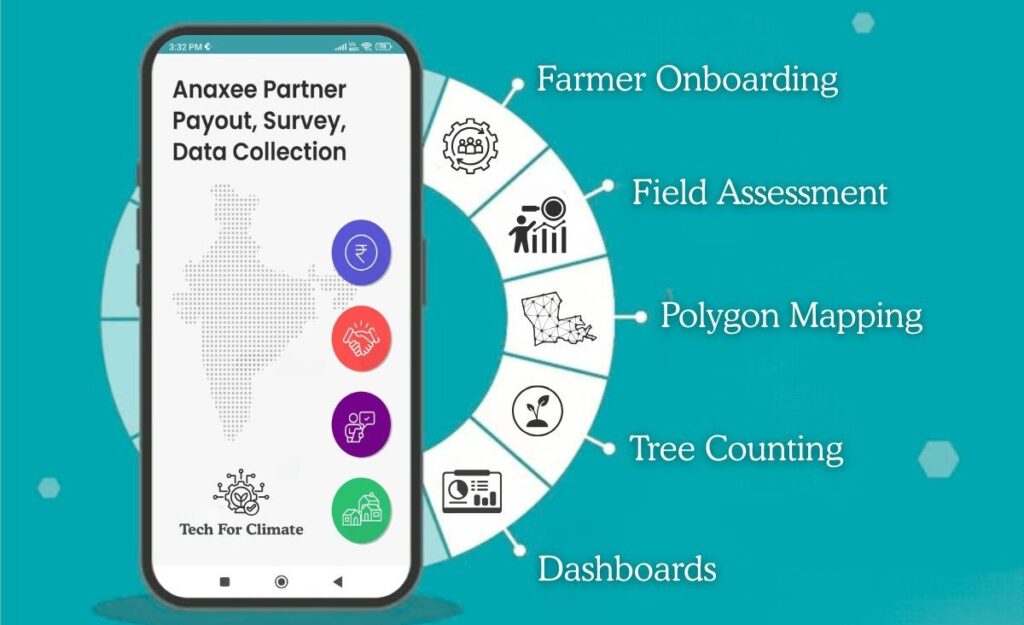
Tech For Climate, dMRV tool

-Real-time tracking of Runner activities

-Quality control triggers

-Data analytics for trends

-Integration-ready with Verra, Gold Standard protocols

This is Digital MRV (Measurement, Reporting, and Verification) in action.


How We Do Quality Check of Data

Every image, every GPS point, and every form is checked and validated.

Here’s how:

-Images are auto-checked for time, location, clarity

-GPS points are verified using backend maps

-Forms are run through logic rules (e.g., sapling count vs. land size)

-Duplicate entries flagged

If a data point fails any check, a feedback loop is triggered, and the Runner is notified instantly.

Example: Clean Cooking Project

For clean cookstove distribution:

-Digital Runners collect beneficiary info, stove images, and usage confirmation

-Our backend team filters for low-income families using demographic indicators

-Only eligible households are onboarded

-Follow-up calls validate usage


Beneficiary Selection: No Guesswork

We have set processes to identify and validate beneficiaries. For example:

In Improved Cookstove Projects:

-Runners first survey the household

-Mobile app captures cooking method, wood usage, and household size

-Data runs through filters (e.g., LPG vs. firewood users)

-Only wood-using households below income threshold are approved

This ensures high additionality and methodological integrity.


Dashboards That Tell the Truth

Every stakeholder, from project developers to auditors, wants visibility. We provide it through:

-Real-time dashboards for plantation progress

-Maps showing exact geo-coordinates of beneficiaries

-Status trackers for sapling survival, device usage

-Weekly reports downloadable in CSV or PDF

It’s transparency by design, not just as a reporting requirement.


Human + Digital: Our Hybrid Model

What sets Anaxee apart is this hybrid model:

-Humans on ground: For empathy, trust, adaptability

-Tech on cloud: For scalability, accuracy, auditability

This balance allows us to:

-Scale fast without losing quality

-Pivot quickly when field realities shift

-Maintain end-to-end control


We Don’t Just Run Projects. We Command Them.

Calling it a “Climate Command Centre” isn’t just branding. It’s an operational reality.

Whether we’re planting 10 lakh trees, distributing 1 lakh stoves, or mapping 50,000 acres of land, every step is managed, measured, and improved in real time.

And behind it all is a team that cares, tools that work, and a vision that scales.


Why This Matters

Carbon markets are shifting toward high-integrity, high-auditability projects. Gone are the days when a generic CSR report would suffice. Today, every credit must be backed by:

-Verified data

-Transparent processes

-Community co-benefits

Anaxee is ready. And the Climate Command Centre is where it all comes together.


Interested in Partnering with Us?

If you’re a project developer, carbon registry, CSR leader, or climate investor—reach out. See how Anaxee’s Climate Command Centre can become your execution backbone in India. Connect with us at sales@anaxee-wp-aug25-wordpress.dock.anaxee.com

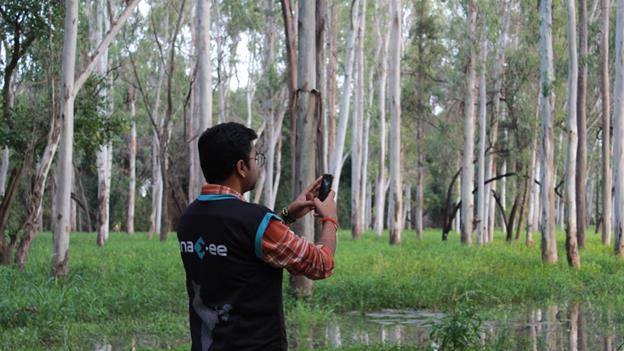
Anaxee representative capturing mobile data in a dense eucalyptus plantation, reflecting biodiversity and ecosystem restoration efforts aligned with nature-based carbon solutions.


Rock Weathering: A Natural Climate Solution Transforming Carbon Removal

Rock Weathering: A Natural Climate Solution Transforming Carbon Removal

Introduction: Why We Need to Look Beneath Our Feet

As climate change accelerates, the urgency to remove carbon dioxide (CO₂) from the atmosphere has intensified. Governments, companies, and climate scientists are searching for scalable, affordable, and permanent solutions. Among nature-based and tech-assisted methods, one solution that’s gaining traction yet remains under-discussed is “rock weathering.” This naturally occurring geological process may not sound revolutionary, but its potential to sequester billions of tonnes of carbon is drawing serious attention.

India, too, with its vast basaltic formations and mineral-rich terrain, is uniquely positioned to lead in the application of this method — especially with the emergence of Article 6 mechanisms and India’s own Carbon Credit Trading Scheme (CCTS). But before we get to the market opportunities, let’s understand what rock weathering actually is.


1. What is Rock Weathering?

Rock weathering is the natural process by which rocks break down over time due to exposure to air, water, and biological activity. When it comes to climate, we are specifically interested in a sub-type called “chemical weathering” — particularly of silicate minerals.

Here’s how it works:

-Silicate rocks (like basalt or olivine) react with atmospheric CO₂ and rainwater.

-This forms bicarbonates, which are eventually washed into the oceans.

-Over thousands of years, the bicarbonates turn into carbonates and are stored in marine sediments — effectively locking away CO₂.

This process has been regulating Earth’s climate for millions of years, but it operates on geological timeframes. What’s new is the idea of “enhanced weathering.”


2. Enhanced Weathering: Speeding Up a Natural Process

Enhanced weathering is a climate intervention technique that aims to accelerate this natural CO₂ removal process by:

-Crushing silicate rocks to increase surface area

-Spreading them over farmland, grasslands, or degraded land

-Letting rainfall and soil processes do the rest

One of the key advantages is that this method is permanent, meaning the captured carbon doesn’t get released back into the atmosphere like in many short-term offset projects. And it does not require massive infrastructure.

Think of it as turning crushed rock into a carbon sponge.


3. The Science Behind It

The chemical formula for the reaction is often simplified like this:

CaSiO3+CO2→CaCO3+SiO2CaSiO_3 + CO_2 → CaCO_3 + SiO_2

This means one molecule of silicate binds with one molecule of CO₂ to form solid calcium carbonate and silica.

Some popular rocks for this purpose include:

-Olivine – Found in dunite, highly reactive with CO₂

-Basalt – Abundant in India’s Deccan Plateau

-Peridotite – Found in ophiolites, very high in magnesium silicates

The key is the reaction kinetics — how fast the rocks weather in a given climate and soil condition. Humid tropical environments like India offer excellent conditions for faster weathering.


4. Agronomic Co-benefits: More Than Just Carbon

Interestingly, this approach doesn’t just sequester carbon. It also improves soil health:

-Reduces soil acidity – A natural liming effect, particularly helpful in acidic soils

-Adds nutrients – Basalt contains potassium, calcium, and magnesium

-Improves water retention – Microporous crushed rock increases soil capacity

-Boosts crop yields – Some early studies show 5–10% increase in output

This makes it ideal for integrating with agricultural programs, especially in smallholder farming systems like India’s. Enhanced rock weathering could serve dual purposes: climate mitigation and rural soil rejuvenation.


5. Potential in India: A Hidden Advantage

India’s geology offers one of the largest contiguous basalt formations in the world — the Deccan Traps, spanning Maharashtra, Madhya Pradesh, Gujarat, and parts of Telangana and Karnataka. These rocks are not just abundant but also underutilized.

Why India is Strategically Positioned:

If India scales this approach regionally, it could create a climate-positive agri-revolution.


6. Rock Weathering vs. Other Carbon Removal Methods

Let’s compare rock weathering with some other popular carbon removal approaches:

Approach Cost (USD/tCO₂) Permanence Co-benefits Maturity
Rock Weathering $50–$150 1,000+ yrs Soil, yield Emerging
Biochar $30–$120 100–500 yrs Soil fertility Mature
DAC (Direct Air Capture) $600–$1000+ 1,000+ yrs None Nascent
Afforestation $10–$50 Decades Biodiversity Mature
Soil Carbon $15–$50 Short-term Agronomic benefits Mature

What stands out is the permanence of rock weathering — it offers high-integrity carbon removal without the risk of reversal.


7. Current Research and Pilot Projects

Globally, organizations like UNDO (UK), Project Vesta (US), and Lithos Carbon (US) are conducting large-scale field trials. Some early learnings include:

-Fine particle size increases weathering speed

-Optimal pH and microbial activity boost CO₂ capture

-Yield gains create additional incentives for farmers

In India, few pilots are underway — mostly in Karnataka and Maharashtra, often piggybacking on regenerative agriculture or CSR programs. The current bottleneck? Lack of awareness, field-level deployment partners, and MRV (Monitoring, Reporting, Verification) frameworks.

This is where outreach-focused organizations like Anaxee can play a crucial role.


8. MRV for Rock Weathering: The Tech Challenge

Measuring how much CO₂ has been captured through rock weathering isn’t straightforward. It requires:

-Soil and water sampling – Bicarbonate concentrations, pH shifts

-Isotope tracing – Carbon isotopes to confirm geological origin

-Modeling weathering rates – Using geochemical software like PHREEQC

-Remote sensing and AI – For monitoring deployment and crop impact

Emerging dMRV platforms can help digitize this — using drone surveys, soil sensors, and machine learning to predict and verify CO₂ sequestration.


9. Policy and Carbon Market Integration

Enhanced rock weathering is already recognized by:

-IPCC as a negative emissions technology

-Puro.earth as a certifiable carbon removal methodology

-Verra is in the process of developing weathering protocols

-CCTS (India) can enable voluntary issuance in a co-benefit-linked framework

As India’s carbon market matures under Article 6.2 and 6.4, early projects in rock weathering can be positioned for future trading. Particularly if India adopts a separate track for durable carbon removals — as seen in the EU and US.


10. Risks and Criticism: A Balanced View

No solution is perfect. Rock weathering faces challenges:

-Dust inhalation – Crushed rocks need safe handling protocols

-Energy use – Crushing rocks consumes energy; needs renewable power

-Ecological impact – Mining new rock could harm ecosystems

-Measurement uncertainty – Requires sophisticated MRV, still evolving

Mitigation involves using mine tailings, renewable-powered crushing, and targeting degraded land for spreading.


11. What’s Next: The Road to Scale

Here’s how this can move from pilot to large-scale deployment in India:

  1. Mapping basalt deposits – Government geological surveys + remote sensing

  2. Farmer partnerships – Particularly in acidic-soil districts

  3. Integration with CSR/NbS – Projects by corporates looking for removals

  4. MRV stack development – With tech partners and carbon platforms

  5. Carbon credit registration – Either with Verra, Gold Standard, or future Indian registries

Anaxee, with its rural last-mile capabilities and tech-enabled tracking, is well placed to be an execution partner in this new frontier.


Conclusion: Turning Rocks into a Climate Asset

Rock weathering represents the fusion of deep-time geology with cutting-edge climate science. It’s quiet, solid, and permanent- just like the rocks themselves. And it could turn India’s volcanic past into a climate-secure future.

As the carbon market shifts toward durable removals, enhanced rock weathering offers India a rare opportunity: to lead the world by deploying a homegrown, natural climate solution — quite literally — from the ground up.


About Anaxee:

Anaxee drives large-scale, country-wide Climate and Carbon Credit projects across India. We specialize in Nature-Based Solutions (NbS) and community-driven initiatives, providing the technology and on-ground network needed to execute, monitor, and ensure transparency in projects like agroforestry, regenerative agriculture, improved cookstoves, solar devices, water filters and more. Our systems are designed to maintain integrity and verifiable impact in carbon methodologies.

Beyond climate, Anaxee is India’s Reach Engine- building the nation’s largest last-mile outreach network of 100,000 Digital Runners (shared, tech-enabled field force). We help corporates, agri-focused companies, and social organizations scale to rural and semi-urban India by executing projects in 26 states, 540+ districts, and 11,000+ pin codes, ensuring both scale and 100% transparency in last-mile operations.
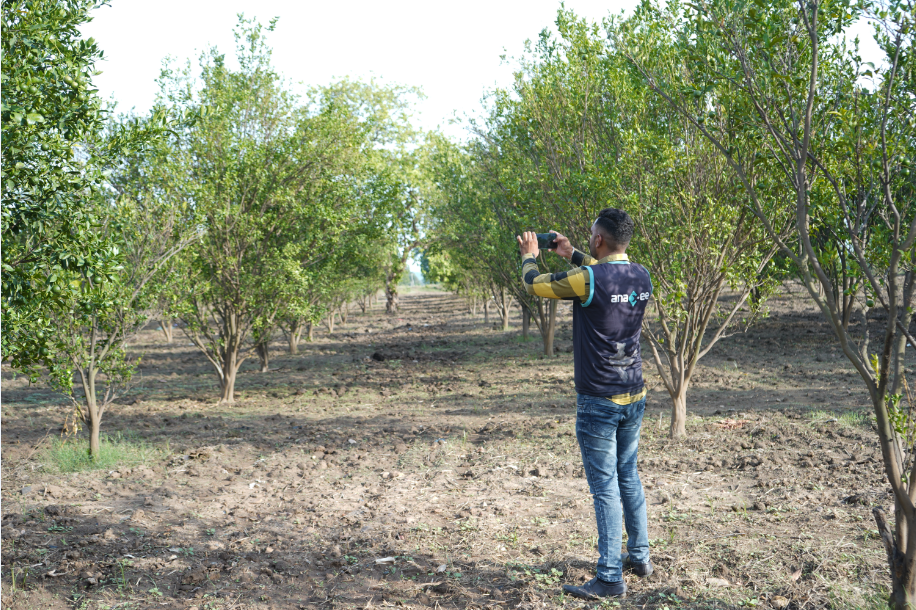
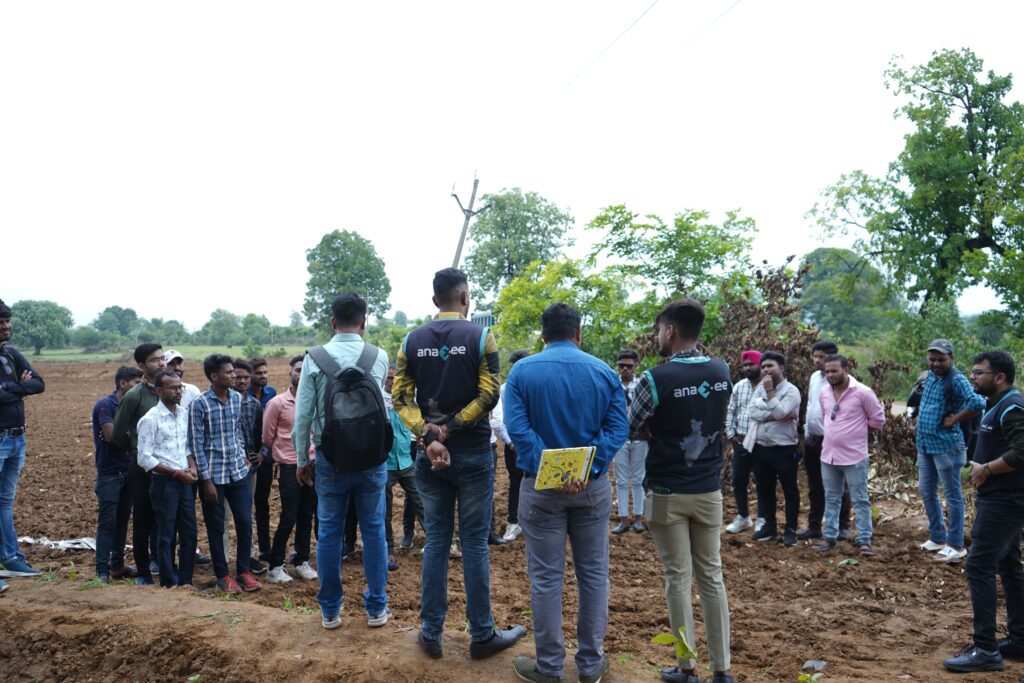
Field Workers for Agroforestry Project in India


Ready to collaborate on your next Climate or Carbon project?
Email us at:sales@anaxee-wp-aug25-wordpress.dock.anaxee.com

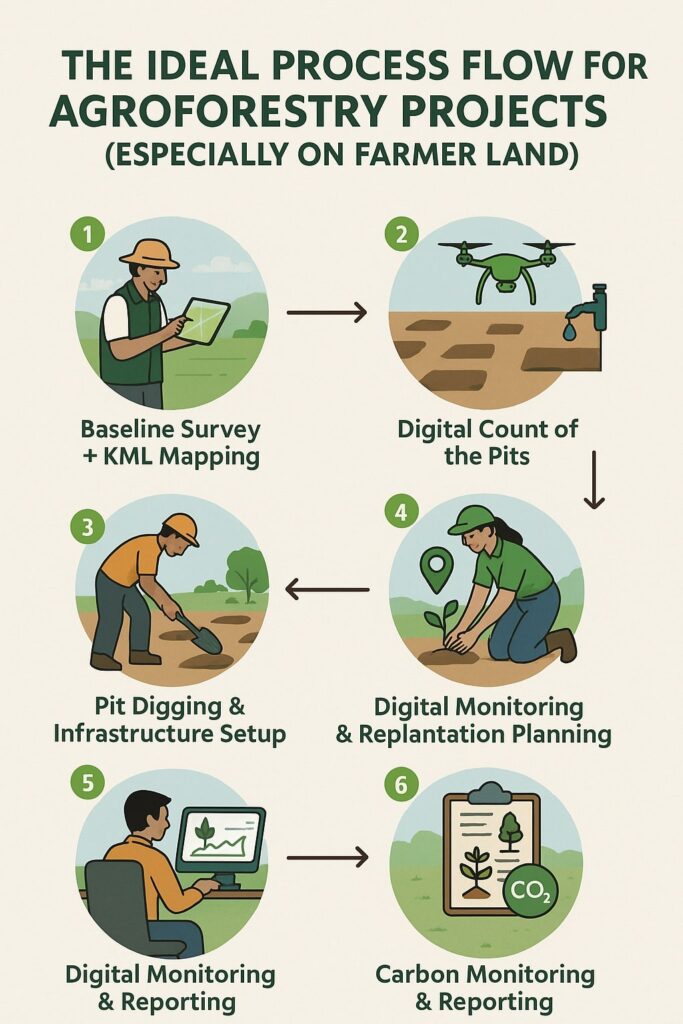
The Ideal Process Flow for Agroforestry Projects | Anaxee

The Ideal Process Flow for Agroforestry Projects (Especially on Farmer Land)

In many agroforestry projects, people get excited and start rushing things.
Pits are dug by generic labourers & contractors, approx number of saplings dispatched to site, plantation begins- but then problems start coming one after another. Plants don’t survive, saplings count in mismatched saplings are either short or over supplied on a plot, it leads to waste of sapling, or opportunity. You are dependent on field supervisors for information about the project, rather depending on quality checked data. You are at the mercy of people on the ground.
 
Even worse, after 2–3 years, there’s no proper data of actual plantation done, which affects the carbon credit process.
graphical representation of Agroforestry Project's  Step-by-Step Process
From our experience on farmer lands, we advise Project Developers and Investors a very different scalable work-flow for a foolproof Agroforestry project. We suggest using Technology from Day 1, during the planning stage. The technology should drive actions done on the field, and not vice versa.

Here is how the flow should look like:

1. Baseline Survey + KML Mapping 
Before touching the land parcel, understand it properly. Do a proper baseline survey and Polygon mapping, generate KML files to digitally mark the boundary of each farmer’s land.
Then use this polygon mapping to study the shape of the land and check for any barriers like water bodies, houses, slopes or bunds. This helps you know how much area is actually usable and available for plantation
2. Pit Digging & Infrastructure Setup
Calculate exact number of trees possible in that land parcel. Don’t let the labourers dig pits randomly. Decide how many pits to dig, where to dig and what spacing to keep between saplings. Create a layout for every plot, similar to how architects create drawings for every room in a house. If it’s a bund plantation, count the available bunds and total trees which can be accommodated on that bund.
Also plan and install drip irrigation before plantation begins. Water supply is very important in the first 2–3 years of plant life. Don’t delay it.
3. Digital Count of the Pits
Once the pits are ready, do the pits counting digitally.
If possible, use drones to get aerial visuals and understand the area better.
This gives a more accurate number of how many saplings you really need.
4. Plantation + Geo-Tagging
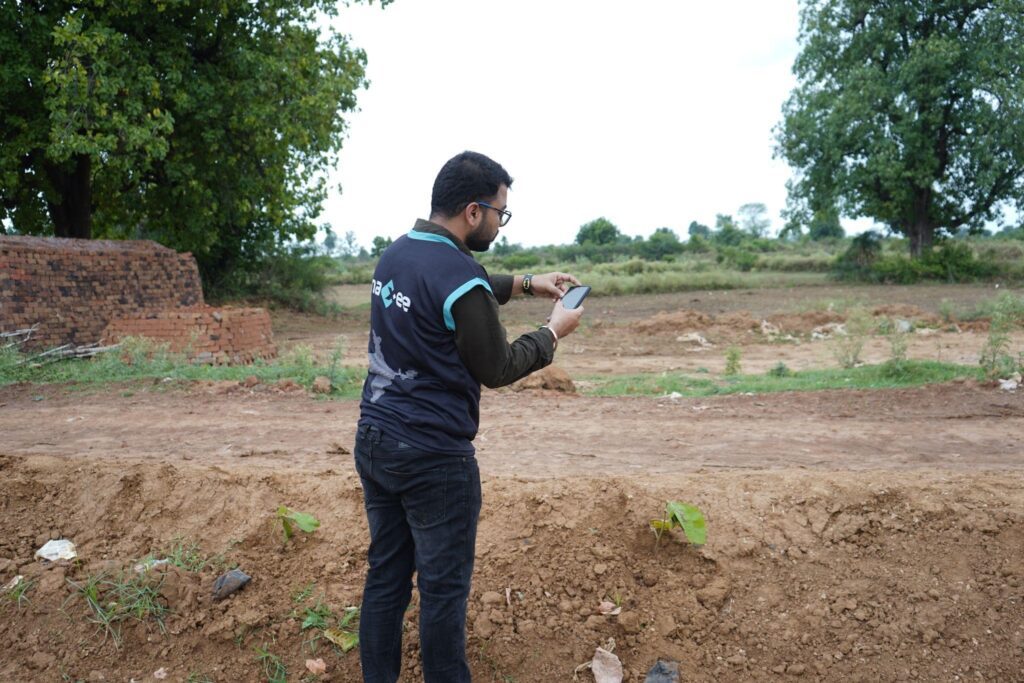
Field worker Geo Tagging the trees in Agroforestry Project


During plantation, make sure each sapling is geo-tagged or marked with a unique ID.
This helps you track which sapling was planted where, and makes it easier for monitoring later.
Think of every tree like a data point.
5. Digital Monitoring & Replantation Planning

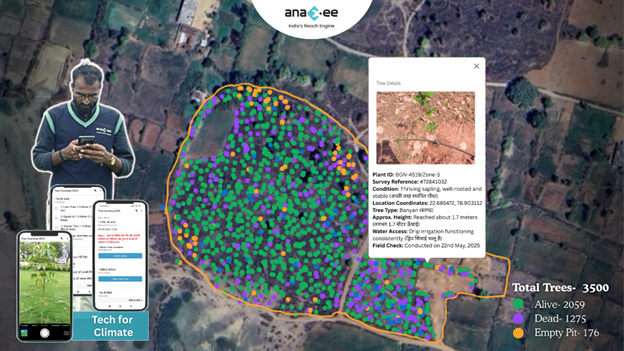
Tech For Climate, dMRV tool

After plantation, don’t forget the plants. Do follow ups regularly- after the first rain, after 6 months, and again after 1 year. If some saplings die, you’ll know exactly which ones need to be replanted if they’re geo-tagged. Otherwise, replantation becomes full of guesswork and confusion.
6. Carbon Monitoring & Reporting
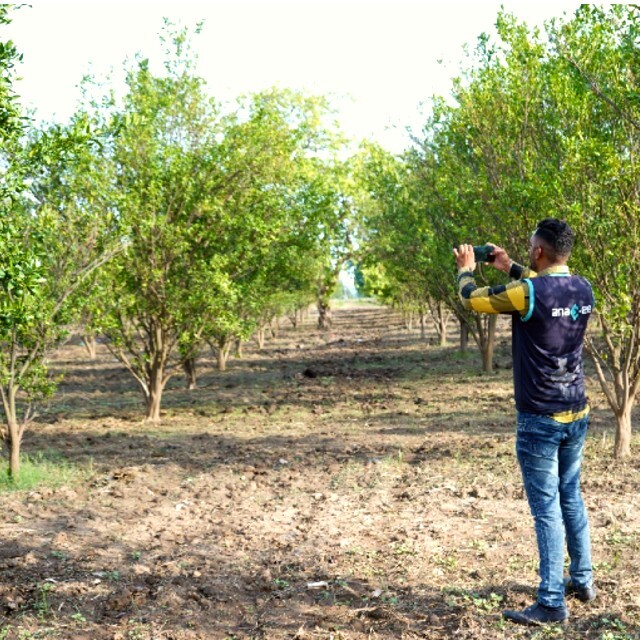
Anaxee Digital Runner capturing images and data in a mature agroforestry plot with rows of trees, enabling real-time monitoring and verification for carbon credit generation


If your goal is to earn carbon credits, you need 2–3 years of consistent digital records.
This includes:
– Tree survival data
– Geo-tagged reports
– Replantation logs
– Irrigation reports
 
Only with this kind of digital documentation and tech-based process, your project will qualify for carbon credit eligibility.
Agroforestry is not just about planting trees- it’s about managing them like large-scale operations. And for that system to work, you need a proper process.
Follow this flow strictly, especially when working on small holding farmers’ land.
It saves time, reduces plant loss and improves the overall impact of the project.
Want to know how we do this step-by-step? or need help with the implementation work, Connect with our Climate team at sales@anaxee-wp-aug25-wordpress.dock.anaxee.com
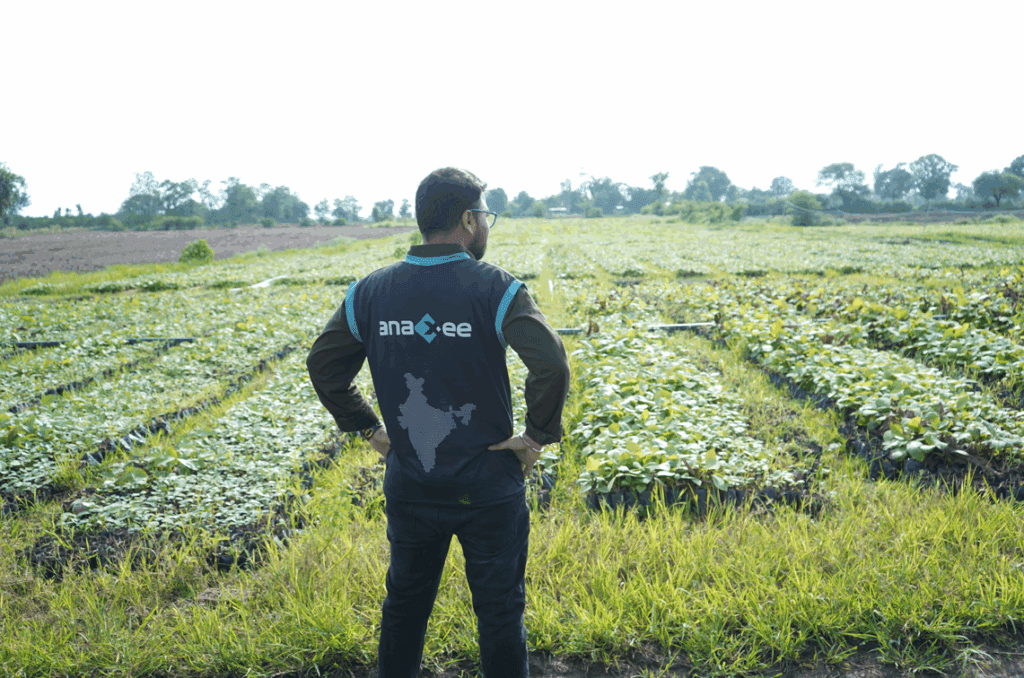
Field Worker Sapling nursery agroforestry carbon project in India


About Anaxee:

Anaxee drives large-scale, country-wide Climate and Carbon Credit projects across India. We specialize in Nature-Based Solutions (NbS) and community-driven initiatives, providing the technology and on-ground network needed to execute, monitor, and ensure transparency in projects like agroforestry, regenerative agriculture, improved cookstoves, solar devices, water filters and more. Our systems are designed to maintain integrity and verifiable impact in carbon methodologies.

Beyond climate, Anaxee is India’s Reach Engine- building the nation’s largest last-mile outreach network of 100,000 Digital Runners (shared, tech-enabled field force). We help corporates, agri-focused companies, and social organizations scale to rural and semi-urban India by executing projects in 26 states, 540+ districts, and 11,000+ pin codes, ensuring both scale and 100% transparency in last-mile operations.
How Asia’s Largest Conglomerates Are Powering Net-Zero: What Indian Industry Can Learn from SK Group

How Asia’s Largest Conglomerates Are Powering Net-Zero: What Indian Industry Can Learn from SK Group

1. Introduction: Why Look at SK Group Now?

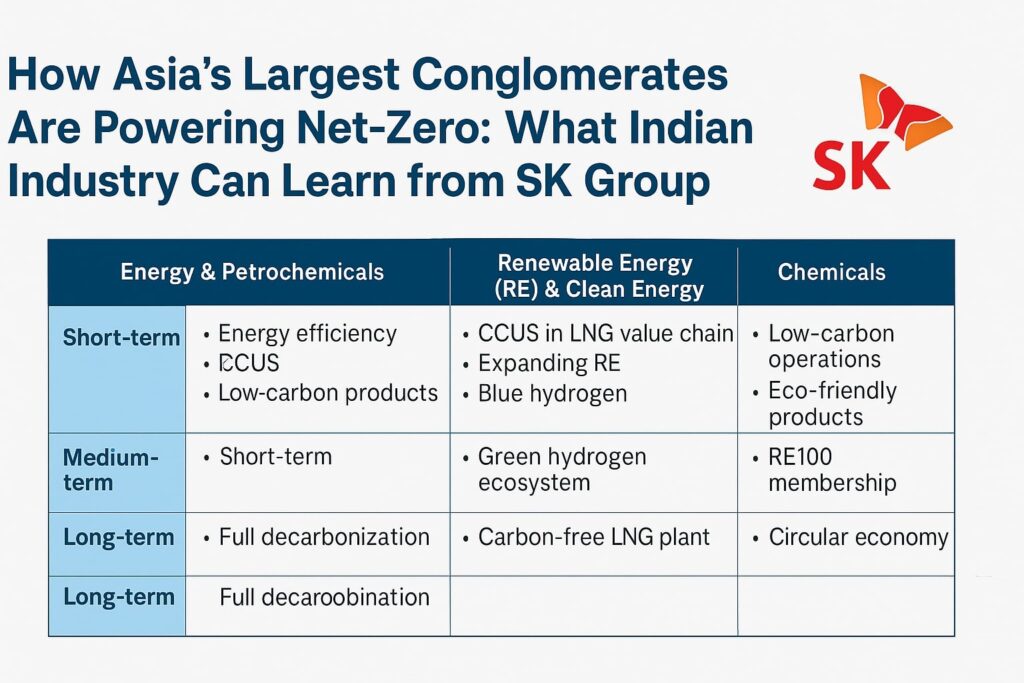
A three-column infographic showing SK Group’s short-, medium-, and long-term climate strategies across Energy & Petrochemicals, Renewable Energy & Clean Energy, and Chemicals. Each cell lists decarbonization actions like CCUS, blue hydrogen, RE100 membership, and circular economy integration, under a bold title referencing lessons for Indian industry.


As India rolls out the Carbon Credit Trading Scheme (CCTS) and more conglomerates declare net-zero ambitions, the real test lies in execution. Companies like Reliance, Adani, Tata, and JSW are making climate pledges—but who is already walking the talk?

South Korea’s SK Group is a compelling example. As the country’s second-largest conglomerate, SK is embedding climate strategy across its core businesses: energy, petrochemicals, renewables, and chemicals. While Indian corporates often silo green efforts into CSR or RE portfolios, SK’s model is integrated, time-bound, and strategic.

So, what can Indian industry learn from SK Group’s approach?


2. Who is SK Group?

-SK Group is South Korea’s 2nd-largest chaebol (business group) with over $130 billion in revenue.

-Its subsidiaries include SK Innovation (energy), SK E&S (clean energy), SK Chemicals, and SK Hynix (semiconductors).

– The group has pledged to achieve net-zero across operations and value chains.

SK is actively investing in clean tech, hydrogen, circular economy models, and low-carbon product lines, with a clear short-, medium-, and long-term roadmap.


3. What SK Group Is Doing: A Sectoral and Time-Frame Breakdown

The group’s strategy can be summarized as a three-horizon play across three sectors:

A. Energy & Petrochemicals

Short-Term

-Improving energy efficiency

-Scaling renewable energy (RE)

-Developing low-carbon petrochemical products

-Driving EV battery production

Medium-Term

-Investing in green hydrogen production

-Deploying carbon capture, utilization, and storage (CCUS)

-Circular economy integration in energy flows

Long-Term

-Full decarbonization of the value chain

-Becoming a green materials and energy provider

-Mass adoption of hydrogen and net-zero fuels

B. Renewable Energy & Clean Energy

Short-Term

-CCUS integration in LNG value chains

-Expanding RE infrastructure (solar, wind)

-Producing blue hydrogen

Medium-Term

-Developing green hydrogen and supporting hydrogen ecosystems

-Purchasing nature-based carbon credits to offset hard-to-abate emissions

Long-Term

-Setting up carbon-free LNG power plants

-Becoming a global clean energy leader

C. Chemicals

Short-Term

-Eco-friendly production

-GHG reduction in chemical manufacturing

Medium-Term

-RE100 membership for SK Chemicals

-Eco-friendly copper foil production for electronics

Long-Term

-Circular economy model for the entire chemicals division


4. What Makes This Strategy Unique

Unlike many companies that treat ESG as a reporting obligation, SK Group:

-Aligns climate goals with core business profitability.

-Sets clear internal timelines across sectors.

-Integrates nature-based solutions (carbon credits) with tech-based decarbonization.

-Champions hydrogen not only as fuel but as a system-wide solution across transport, energy, and chemicals.

It’s a whole-of-conglomerate playbook. And India needs more of these.


5. What Indian Conglomerates Can Learn

Conglomerate Current Climate Moves SK-Inspired Action Plan
Reliance Green hydrogen, net-zero by 2035 Add CCUS for petrochemicals, circular economy pilot
Adani Solar parks, green ammonia Commit to full value chain decarbonization
Tata EVs, Tata Power RE projects Unify sustainability and clean energy under one umbrella
Vedanta Fragmented ESG reporting Create sector-specific green roadmaps

6. CCTS & Indian Climate Policy Context

India’s new CCTS mechanism demands verified emission reductions from industrial players. Like Korea’s ETS, it will pressure conglomerates to:

-Set internal carbon prices

-Plan abatement trajectories

-Explore offsetting through credits (RE, NbS, etc.)

SK’s nature-based carbon credit strategy is a signal that even large industrial groups see value in blending abatement + offsets.


7. Role of Anaxee: Tech for Climate

Anaxee can:

-Provide dMRV solutions for conglomerates investing in nature-based offset projects

-Enable traceable biomass supply chains for co-processing or CCUS feedstock

-Partner on verification frameworks aligned with CCTS


8. Conclusion: From Talk to Transformation

Indian conglomerates don’t lack intent—but they lack structured execution plans. SK Group shows that it’s possible to:

-Align business growth with decarbonization

-Integrate climate into capex, product, and policy strategy

-Leverage both nature-based and tech-based solutions

As CCTS takes off in India, SK Group’s three-horizon roadmap can inspire India Inc. to move from climate pledges to climate leadership.


About Anaxee:

Anaxee drives large-scale, country-wide Climate and Carbon Credit projects across India. We specialize in Nature-Based Solutions (NbS) and community-driven initiatives, providing the technology and on-ground network needed to execute, monitor, and ensure transparency in projects like agroforestry, regenerative agriculture, improved cookstoves, solar devices, water filters and more. Our systems are designed to maintain integrity and verifiable impact in carbon methodologies.

Beyond climate, Anaxee is India’s Reach Engine- building the nation’s largest last-mile outreach network of 100,000 Digital Runners (shared, tech-enabled field force). We help corporates, agri-focused companies, and social organizations scale to rural and semi-urban India by executing projects in 26 states, 540+ districts, and 11,000+ pin codes, ensuring both scale and 100% transparency in last-mile operations.
Ready to collaborate on your next Climate or Carbon project?
Email us at:sales@anaxee-wp-aug25-wordpress.dock.anaxee.com


Carbon Pricing in India: Decoding the Carbon Credit Trading Scheme (CCTS) and What It Means for Business in 2025‑30

Carbon Pricing in India: Decoding the Carbon Credit Trading Scheme (CCTS) and What It Means for Business

1. Why Carbon Pricing and Why Now?

India’s climate targets have teeth only if the cost of emitting carbon shows up on a CFO’s balance sheet. That is the simple logic behind carbon pricing—a policy tool that forces emitters to internalise the social cost of greenhouse‑gas (GHG) pollution. New Delhi is no stranger to market‑based regulation (think PAT, RECs), but 2025 is different. We now have a formal rate‑based Emissions Trading System (ETS) embedded in the Carbon Credit Trading Scheme, 2023–24 (CCTS), backed by amendments to the Energy Conservation Act.

In other words, India is putting a price on carbon intensity rather than absolute tonnes. The shift is subtle but game‑changing for a fast‑growing economy that still needs to expand energy supply.

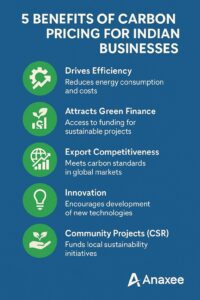
Infographic titled “5 Benefits of Carbon Pricing for Indian Businesses” summarising advantages—drives efficiency, attracts green finance, boosts export competitiveness, sparks innovation, and funds community projects—using simple green icons against a blue background with Anaxee logo.

2. India in the Global Carbon‑Pricing League

According to the World Bank’s “State and Trends of Carbon Pricing 2025”, India now sits in the same emerging‑economy cohort as Brazil, China, and Türkiye when it comes to regulated carbon markets.

– Coverage: Nine energy‑intensive sectors at launch—power, iron & steel, cement, aluminium, fertiliser, pulp & paper, petro‑refining, chemicals and textiles.

– Instrument: Rate‑based ETS + domestic voluntary offset window.

– Benchmark: Emission‑intensity targets, not a hard cap.

– Timing: Compliance cycle expected FY 2025‑26; voluntary methodologies approved March 2025.

Is this ambitious enough? Maybe not. But it’s a pragmatic design for an economy where absolute caps could stifle growth.


3. A Quick History of India’s Carbon‑Pricing Instruments

What sticks out?

  1. Tax vs Trade: India leaned on an implicit coal tax while the EU went cap‑and‑trade.
  2. Intensity, not Caps: Every scheme is benchmarked to intensity—consistent with a developing economy narrative.
  3. Administrative Lean: BEE is the common operator, so institutional memory transfers over.

4. The Legal Backbone: Energy Conservation (Amendment) Act, 2022

This amendment gave the central government explicit power to issue, trade, and retire carbon‑credit certificates. It also created statutory room for voluntary credits—a carve‑out many exporters wanted as CBAM pressure rose.

Key Provisions:

-Section 14A: Authorises central registry for carbon certificates.

-Section 58: Empowers BEE as market administrator.

-Penalty Clause: Non‑compliance fines up to two times market price of CCCs—enough to make CFOs sweat.


5. Anatomy of the Carbon Credit Trading Scheme (CCTS)

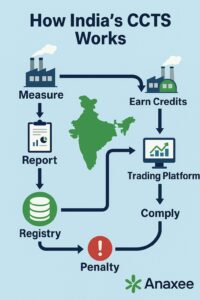
Infographic illustrating how India’s Carbon Credit Trading Scheme (CCTS) works, showing sequential steps—measure emissions, report data, record in registry, earn or buy carbon credits via trading platform, comply, and penalty for non‑compliance—using factory, chart, database, and warning icons with a map of India and Anaxee logo.

5.1 Compliance Mechanism

-Obligated entities must meet annual emission‑intensity targets.

-Over‑achievers receive Carbon Credit Certificates (CCCs); under‑performers must buy them or pay a penalty.

-MRV protocol follows ISO 14064 and IPCC 2006 guidelines.

5.2 Offset Mechanism (Domestic Voluntary Market)
Eight approved methodologies (renewables, green hydrogen, energy efficiency, mangrove AR, etc.) allow non‑ETS players to generate credits. Credits can be sold into the compliance market or to corporates chasing net‑zero pledges.

5.3 Registry & Trading Platform
An electronic trading platform is being built on power‑exchange infrastructure (IEX/PXIL) to avoid reinventing the wheel. Settlement cycle mirrors India’s short‑term power market (T + 1).


6. Rate‑Based ETS vs Cap‑Based ETS: A Critical Look

The trade‑off is clear: India opts for economic flexibility over guaranteed tonnage reductions. That choice invites scrutiny from trading partners—hence the CBAM threat.


7. CBAM: The External Price Tag India Can’t Ignore

The EU’s Carbon Border Adjustment Mechanism enters its financial phase in January 2026. Analysts estimate Indian steel exporters could face ₹19,000 cr in CBAM charges by 2030 unless they decarbonise.

Negotiators are scrambling to protect exports, but the simplest antidote is a robust domestic carbon‑pricing system that proves “equivalent effort.” India’s shift from coal cess to CCTS is partly a CBAM‑defence strategy.


8. Sector‑by‑Sector Readiness


9. Numbers That Matter

-Coal Cess Pool: ~₹54,000 cr collected (FY 2010‑25). Little of it has flowed to climate projects—an efficiency gap CCTS aims to fix.

-Potential Market Size: BEE projects CCC demand at 180 MtCO₂e by 2030—roughly a ₹45,000‑crore annual market assuming ₹250/t average price.

-Voluntary Credits Pipeline: 8 approved methodologies could unlock 50 MtCO₂e offsets annually by end‑decade.


10. The Data & MRV Challenge—And Why Tech Players Like Anaxee Matter

Carbon pricing lives or dies on Measurement, Reporting & Verification (MRV). India’s grid is patchy with emission‑factor data, and many mid‑tier plants lack automated monitoring.

Where Anaxee fits:

  1. Last‑Mile Data Collection: With runners in 26,000+ villages, field‑level energy audits and biomass assessments feed verifiable project data into the registry.
  2. Digital MRV (dMRV): Mobile‑first data capture plus blockchain‑anchored audit trails reduce double‑counting risk—critical for credit quality.
  3. Community Projects: CCTS offset window covers mangroves, clean cooking, agro‑forestry. Anaxee’s rural network accelerates baseline surveys and credit issuance.

Bottom line: Carbon pricing is as strong as its data plumbing; that plumbing is a tech and outreach problem more than a policy one.


11. Pain Points No One Should Ignore

  1. Price Volatility: Without a price collar, CCCs could swing like RECs did in 2016.
  2. Registry Interoperability: Alignment with international standards (ICVCM, VCMI) is still work‑in‑progress.
  3. Delayed Penalties: Collection of non‑compliance fines historically lags in India’s power market—watch this space.
  4. Equity Concerns: SMEs outside top nine sectors risk being left behind unless voluntary credit pathways become affordable.

12. What Indian Corporates Should Do in the Next 12 Months


13. Policy Recommendations (Straight Talk)

  1. Transition Coal Cess into a True Carbon Tax
    Hypothecate proceeds to a Price‑Stability Fund for CCCs rather than general revenue.
  2. Introduce a Price Collar
    Floor ₹150, ceiling ₹600/t to avoid the REC‑type boom‑bust.
  3. Fast‑Track Scope‑3 Methodologies
    Especially for agriculture and logistics—critical to decarbonise rural supply chains.
  4. Integrate with GST IT Backbone
    Automate certificate retirement and penalty collection through existing e‑invoice rails.
  5. Build a CBAM‑Readiness Portal
    Public carbon‑intensity disclosure for exporters; makes customs paperwork smoother.

14. The Road Ahead: Intensity Today, Absolute Caps Tomorrow?

India’s rate‑based ETS is a start, not an end. The net‑zero 2070 goal will eventually require tonnage caps and negative‑emission pathways (biochar, DAC). Expect:

-CCTS Phase 2 (2028‑30): Expand to shipping and aviation bunkers.

-Cap‑Hybrid by 2032: Combine intensity with sectoral caps once GDP growth stabilises below 6 %.

-International Linkages: Potential pilot linkage with Singapore’s carbon market for tokenised credit swaps.


15. Conclusion

Carbon pricing in India is no longer an academic debate. With the CCTS clock ticking and CBAM looming, the cost of carbon will soon appear on every corporate ledger—either as a tradable certificate, an import tax, or a reputational hit. Companies that invest early in credible data, verifiable reductions, and community‑positive offsets will not just dodge penalties; they’ll gain an export edge and access to cheaper green capital.

For players like Anaxee, the opportunity is to convert last‑mile execution expertise into the plumbing that India’s carbon market desperately needs. Data is the new oil, but in carbon pricing, data is the new oxygen—without it, nothing survives.


Call to Action
Ready to future‑proof your carbon strategy? Connect with us at sales@anaxee-wp-aug25-wordpress.dock.anaxee.com


About Anaxee: 

Anaxee drives large-scale, country-wide Climate and Carbon Credit projects across India. We specialize in Nature-Based Solutions (NbS) and community-driven initiatives, providing the technology and on-ground network needed to execute, monitor, and ensure transparency in projects like agroforestry, regenerative agriculture, improved cookstoves, solar devices, water filters and more. Our systems are designed to maintain integrity and verifiable impact in carbon methodologies.

Beyond climate, Anaxee is India’s Reach Engine- building the nation’s largest last-mile outreach network of 100,000 Digital Runners (shared, tech-enabled field force). We help corporates, agri-focused companies, and social organizations scale to rural and semi-urban India by executing projects in 26 states, 540+ districts, and 11,000+ pin codes, ensuring both scale and 100% transparency in last-mile operations.
Ready to collaborate on your next Climate or Carbon project?
Email us at: sales@anaxee-wp-aug25-wordpress.dock.anaxee.com

Drone Tree Counting for Agroforestry Project in India


Winning Beyond Compliance: How Carbon Markets Can Sharpen Your Competitive Edge

Winning Beyond Compliance: How Carbon Markets Can Sharpen Your Competitive Edge

“If you see carbon pricing only as a cost, you’re leaving money on the table.”

1 . Why “Just Comply” Is Yesterday’s Game

The global rule‑book on emissions is tightening fast. Europe launches the Carbon Border Adjustment Mechanism (CBAM) in 2026; the U.S. is floating similar tariffs. A July 2025 study shows that two‑thirds of India’s ₹ 82 lakh‑crore export basket now faces net‑zero regulation risk. 
Merely hitting domestic caps will not protect market share- firms must out‑perform peers on carbon intensity and prove it.

“Vertical infographic on a light mint background titled ‘Carbon Market Advantages for Early Movers,’ featuring three rows with teal circular icons and text blocks: a magnifying-glass-and-dollar icon for ‘Price Discovery,’ stacked-coins-with-arrow icon for ‘Liquidity Options,’ and a courthouse icon for ‘Regulatory Voice.’”

2 . Inside India’s Emerging Carbon Market

The Carbon Credit Trading Scheme (CCTS) aims to merge the older PAT programme into a fungible, market‑wide mechanism by 2026. Draft regulations adopted in July 2024 lay out a compliance market for nine hard‑to‑abate sectors and a voluntary window for the rest.
Early movers gain three advantages:

  1. Price Discovery – Knowing the real rupee cost of each tonne avoided.

  2. Liquidity Options – Buy, bank, or sell credits depending on strategy.

  3. Regulatory Voice – Shape rules through pilot participation.


3 . Compliance vs. Competitive Edge

“Two-column infographic on a dark-teal background. Left column (DEFENSE) is labelled ‘Compliance’ and lists ‘Avoid penalties,’ ‘Meet minimum targets,’ ‘Minimize liabilities.’ Right column (OFFENSE) is labelled ‘Competitive Edge’ and lists ‘Tap new revenues,’ ‘Exceed reduction goals,’ ‘Maximize offsets.’ A thin vertical divider separates the columns.”

Think of compliance as defence—avoid penalties. Competitive edge is offence:


4 . Set an Internal Carbon Price—Not a Token Fee

Global best practice clusters around these steps:

  1. Benchmark external signals – EU ETS forward price, voluntary market averages.

  2. Pick a tiered price – e.g., ₹1,500 / t in 2025 → ₹3,000 / t in 2030.

  3. Hard‑wire into capex approvals. No shadow price, no green light.
    According to EY India, firms monetising surplus reductions can recycle cash into further R&D, locking in a virtuous cycle of lower costs and higher brand value.


5 . Guard Against Carbon Border Taxes

For exporters of steel, aluminium, fertiliser or cement, avoiding CBAM fees could mean the difference between a 6 % margin and a loss‑maker. Map three zones:

-Red: High‑carbon, tariff‑hit goods—urgent decarbonisation.

-Amber: Medium‑risk products—offsets + supplier engagement.

-Green: Low‑carbon portfolio—opportunity for premium pricing.

Use CCTS allowances plus certified offsets to pull Amber into Green before 2026.


6 . Build a Balanced Credit Portfolio

Nature‑based Solutions (NbS) offer lower first‑cost but higher permanence risk; tech‑based removals are pricey yet durable. A 70‑20‑10 split (energy efficiency | NbS | engineered removals) hedges both integrity and cost. Remember: under India’s draft rules, only a limited share of compliance can be met by offsets—keep them for the hard‑to‑abate tail.


7 . Digital MRV: Transparency as Brand Ammunition

Slide imagery from the album highlights QR‑coded tree tags and satellite‑verified biomass. That is exactly the Tech‑for‑Climate stack Anaxee runs in its Bund Plantation projects (VM0047). Real‑time dashboards slash verification delays from 18 months to 6 weeks and cut third‑party audit costs by ~35 %. Clients can embed live project links on product pages—turning data into marketing collateral.


8. Financing the Journey

Combine three pools:

  1. Green Debt – Cheaper cost of capital tied to emission metrics.

  2. Carbon Credit Revenue – Sell surplus or forward‑contract to offtakers.

  3. CSR Budgets – Align social projects with climate co‑benefits (rural livelihoods, agroforestry).

PolicyCircle pegs India’s domestic carbon market opportunity at $200 billion by 2030—enough headroom to finance deep decarbonisation.


9. Sector Snapshots

Steel – Start blending scrap‑based EAF routes; hedge residual emissions with high‑integrity credits.
IT Services – Scope 2 is the bully; sign 24×7 green‑power PPAs and monetise unclaimed RECs.
Cement – Pilot calcined‑clay blends; bank early CCTS allowances, sell excess when price spikes.


10. Anaxee’s Last‑Mile Advantage

Where typical consultants stop at strategy slides, Anaxee Digital Runners executes on the ground:

-Data Collection Network: 40,000 rural runners feed field data directly into dMRV apps.

-Geo‑Tagged Evidence: Every tonne comes with photo & GPS proof.

-End‑to‑End Service: From farmer onboarding to registry issuance—zero middle‑layers.

That reduces project cycle time by about 30 % vs legacy models, freeing cash sooner for reinvestment.


11. Action Plan—90 Days to Carbon Edge

Timeline graphic on a teal background with three evenly spaced teal circles connected by a white line. Each circle is labelled 30, 60, and 90 days respectively. Below, a rectangular callout links the circles to actions: ‘Assess emissions,’ ‘Identify reduction opportunities,’ and ‘Implement projects.’ Title at top reads ‘90-DAY ACTION PLAN.

12. FAQs

Q: Will CCTS prices start low and stay low?
A: Early prices may sit near ₹800‑₹1,000/t, but international linkage or CBAM pressure could triple quotes within five years. Hedge early.

Q: Offsets have a bad rep—isn’t that risky?
A: Integrity scandals stem from poor MRV and additionality gaps. Demand projects with transparent baselines, conservative buffers, and digitised monitoring—exactly where Anaxee specialises.


13. Key Takeaways

-Compliance is the floor, not the ceiling.

-Carbon markets can fund innovation, protect exports, and even open new revenue streams.

-Digital transparency is your moat.


14. Internal Linking Suggestions

-Link “Bund Plantation projects” to your VM0047 SOP blog.

-Point “Digital MRV pilot” to your dMRV explainer post.

-Cross‑link “Green Debt” to your carbon‑finance‑grants article.


15. Suggested Visual Assets (call on slides)

Graphic Where to insert Alt Text
Bar chart of forecast CCTS prices 2025‑2030 After Section 8 “Projected CCTS allowance price curve 2025‑30”
Infographic: 90‑Day Action Plan Section 11 header “Roadmap to carbon‑competitive advantage”
Photo collage from album: QR‑tagged saplings & satellite overlay Section 7 “Digital MRV in action—field data to registry dashboard”

16 . Call to Action

Ready to turn carbon costs into competitive muscle? Talk to Anaxee’s Climate Team- we’ll map your risks, source high‑integrity credits, and digitize proof so you can brag about it. Connect with us at sales@anaxee-wp-aug25-wordpress.dock.anaxee.com