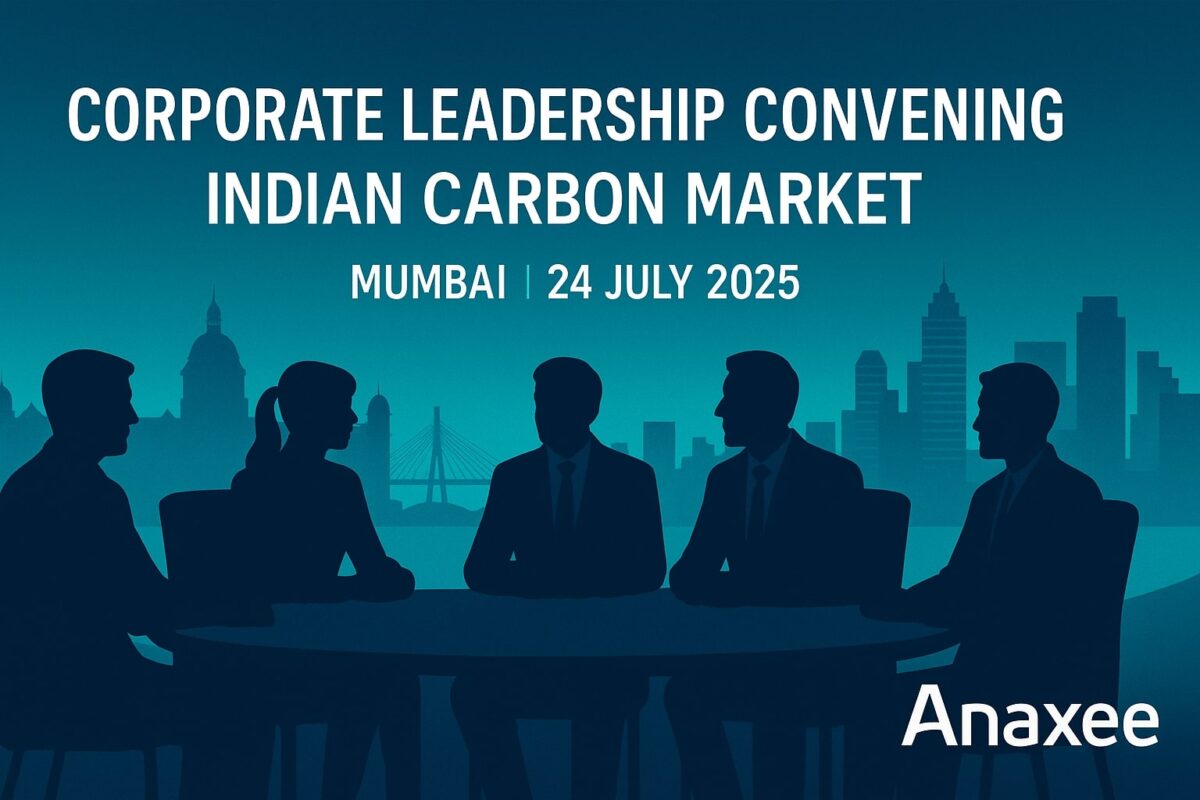
Winning Beyond Compliance: How Carbon Markets Can Sharpen Your Competitive Edge
“If you see carbon pricing only as a cost, you’re leaving money on the table.”
1 . Why “Just Comply” Is Yesterday’s Game
The global rule‑book on emissions is tightening fast. Europe launches the Carbon Border Adjustment Mechanism (CBAM) in 2026; the U.S. is floating similar tariffs. A July 2025 study shows that two‑thirds of India’s ₹ 82 lakh‑crore export basket now faces net‑zero regulation risk.
Merely hitting domestic caps will not protect market share- firms must out‑perform peers on carbon intensity and prove it.
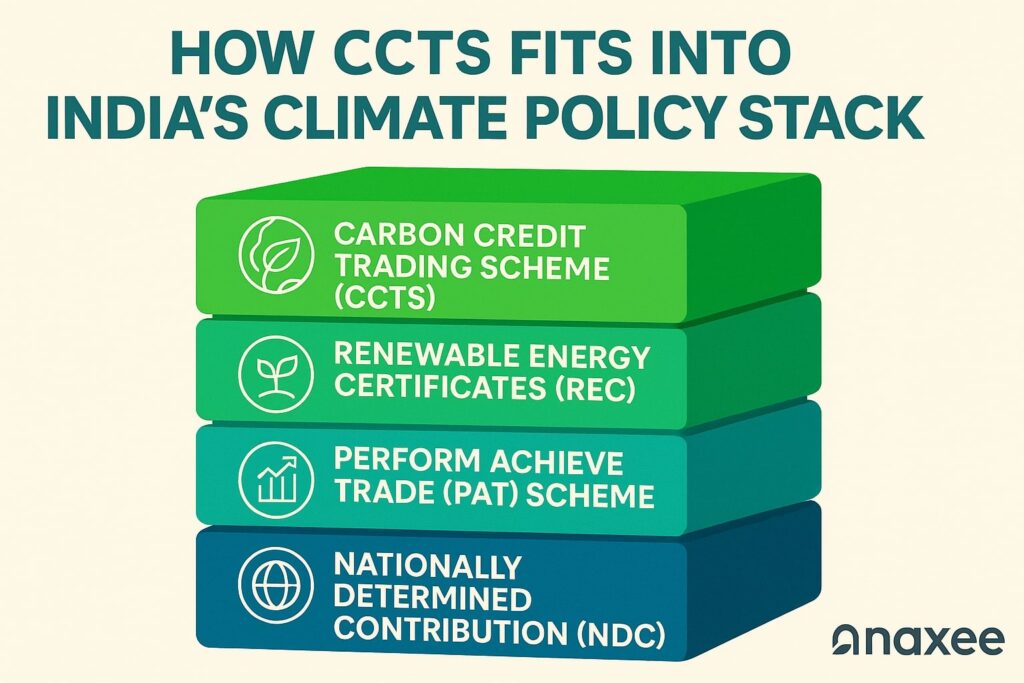
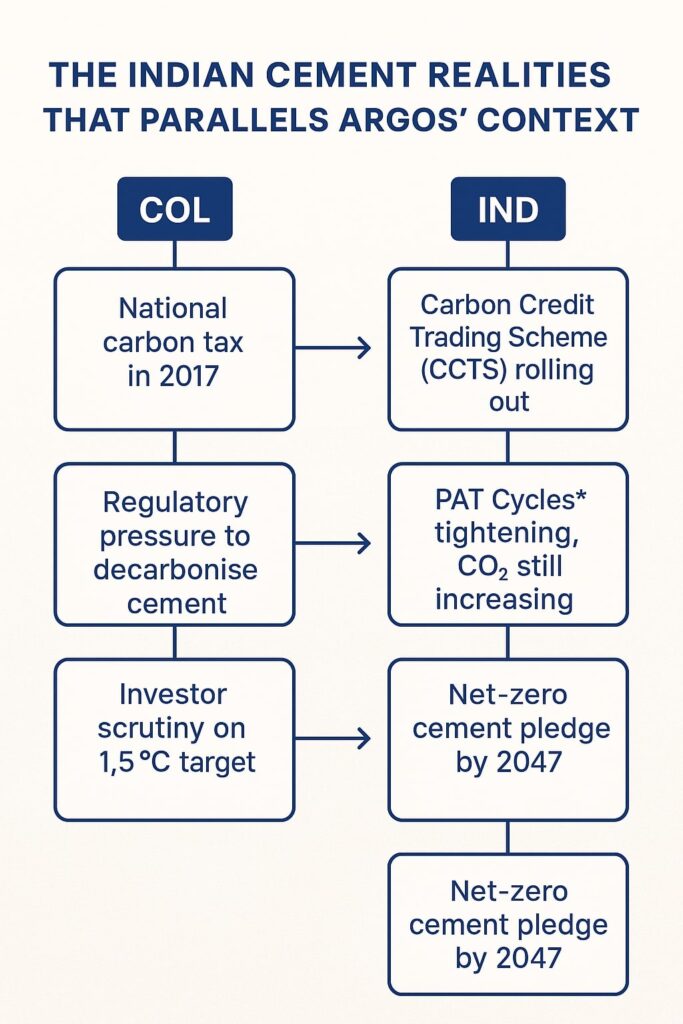
2 . Inside India’s Emerging Carbon Market
The Carbon Credit Trading Scheme (CCTS) aims to merge the older PAT programme into a fungible, market‑wide mechanism by 2026. Draft regulations adopted in July 2024 lay out a compliance market for nine hard‑to‑abate sectors and a voluntary window for the rest.
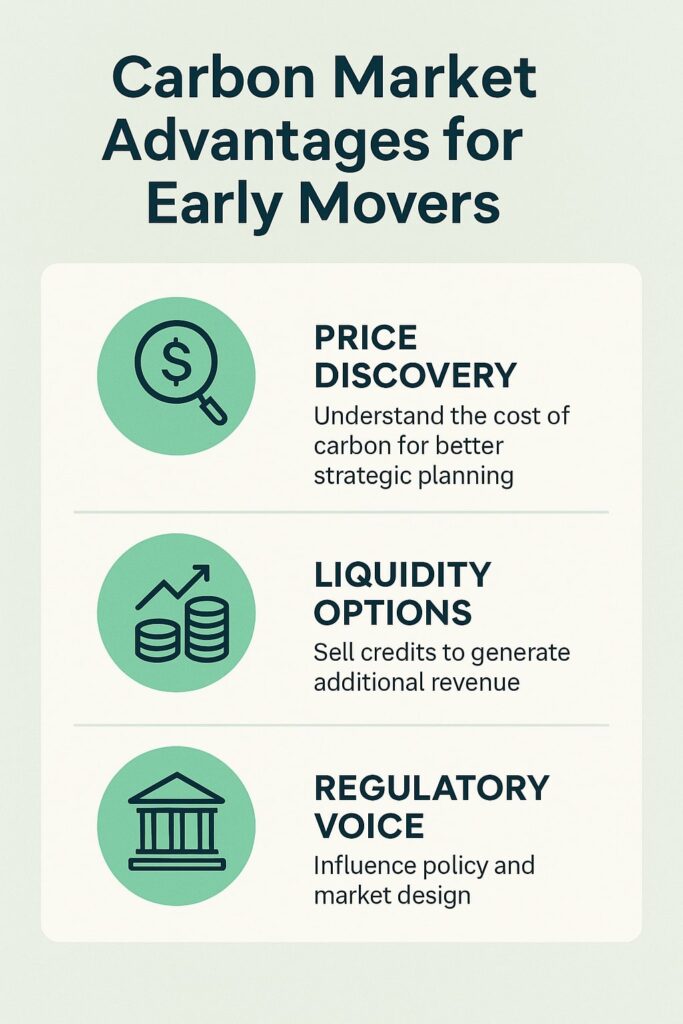
Early movers gain three advantages:
Price Discovery – Knowing the real rupee cost of each tonne avoided.
Liquidity Options – Buy, bank, or sell credits depending on strategy.
Regulatory Voice – Shape rules through pilot participation.
3 . Compliance vs. Competitive Edge
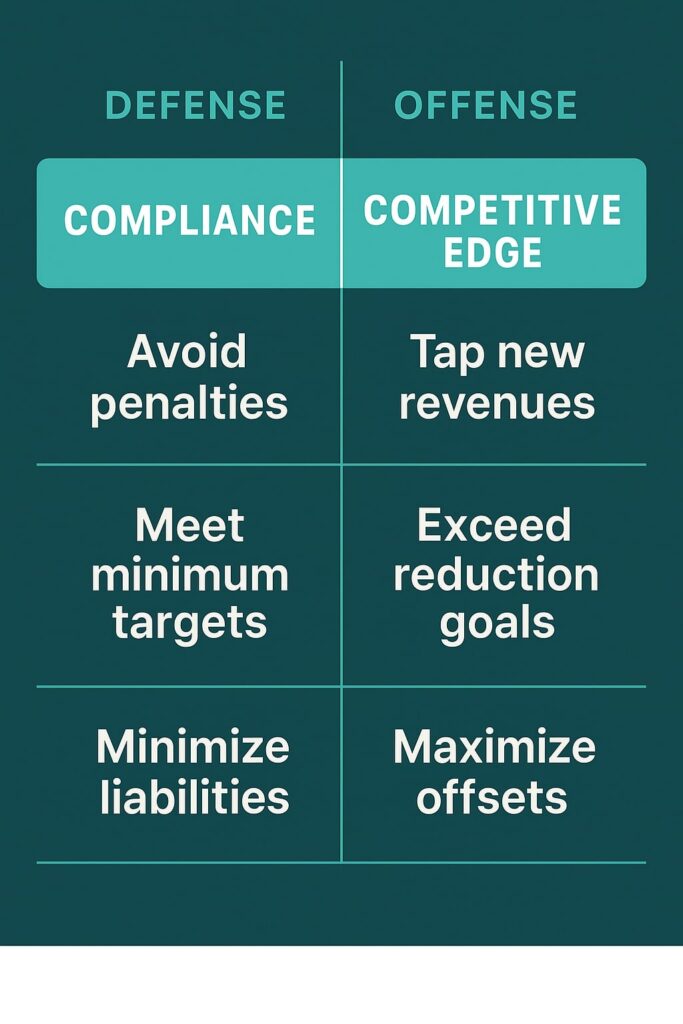
Think of compliance as defence—avoid penalties. Competitive edge is offence:
| Lever | Defensive Outcome | Offensive Upside |
| Internal Carbon Price | Budget line item | Capital shifts to high‑ROI, low‑carbon projects |
| High‑quality Offsets | Meets cap | Opens premium ESG‑labeled product lines |
| Digital MRV | Audit trail | Marketing story: “trust‑by‑design” supply chain |
| Surplus Credit Sales | Avoid waste | New revenue stream & balance‑sheet asset |
4 . Set an Internal Carbon Price—Not a Token Fee
Global best practice clusters around these steps:
Benchmark external signals – EU ETS forward price, voluntary market averages.
Pick a tiered price – e.g., ₹1,500 / t in 2025 → ₹3,000 / t in 2030.
Hard‑wire into capex approvals. No shadow price, no green light.
According to EY India, firms monetising surplus reductions can recycle cash into further R&D, locking in a virtuous cycle of lower costs and higher brand value.
5 . Guard Against Carbon Border Taxes
For exporters of steel, aluminium, fertiliser or cement, avoiding CBAM fees could mean the difference between a 6 % margin and a loss‑maker. Map three zones:
-Red: High‑carbon, tariff‑hit goods—urgent decarbonisation.
-Amber: Medium‑risk products—offsets + supplier engagement.
-Green: Low‑carbon portfolio—opportunity for premium pricing.
Use CCTS allowances plus certified offsets to pull Amber into Green before 2026.
6 . Build a Balanced Credit Portfolio
Nature‑based Solutions (NbS) offer lower first‑cost but higher permanence risk; tech‑based removals are pricey yet durable. A 70‑20‑10 split (energy efficiency | NbS | engineered removals) hedges both integrity and cost. Remember: under India’s draft rules, only a limited share of compliance can be met by offsets—keep them for the hard‑to‑abate tail.
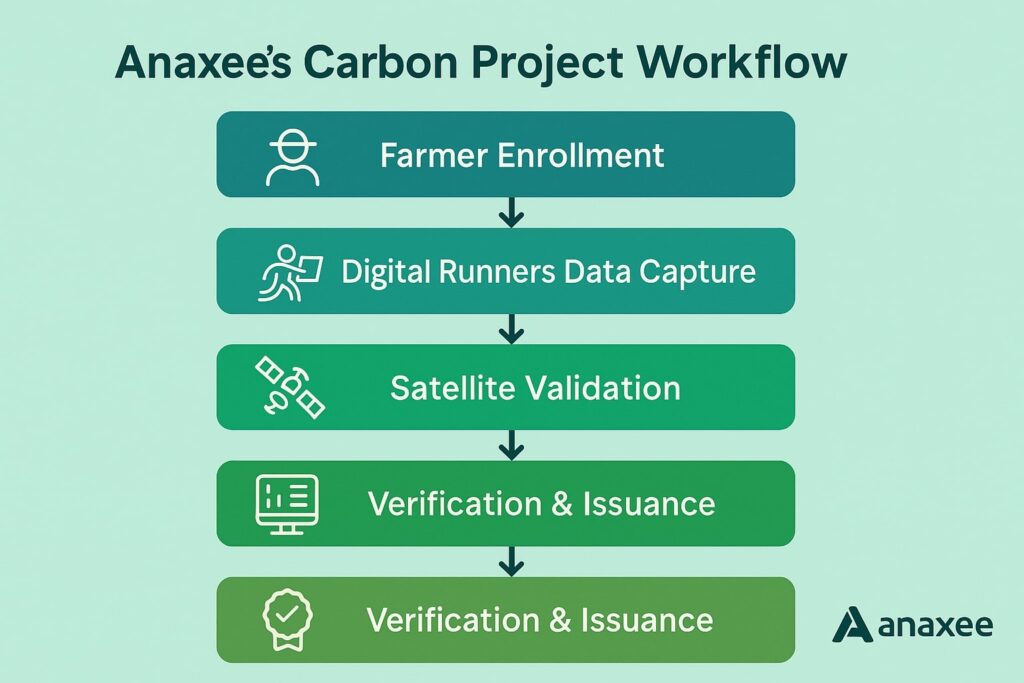
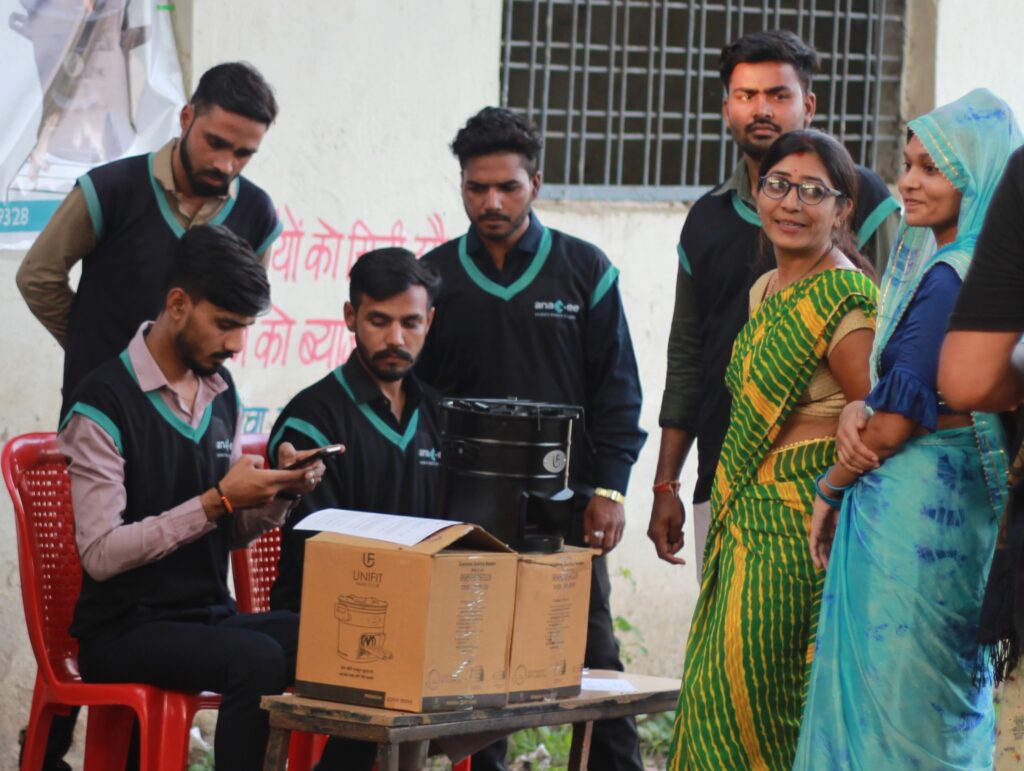
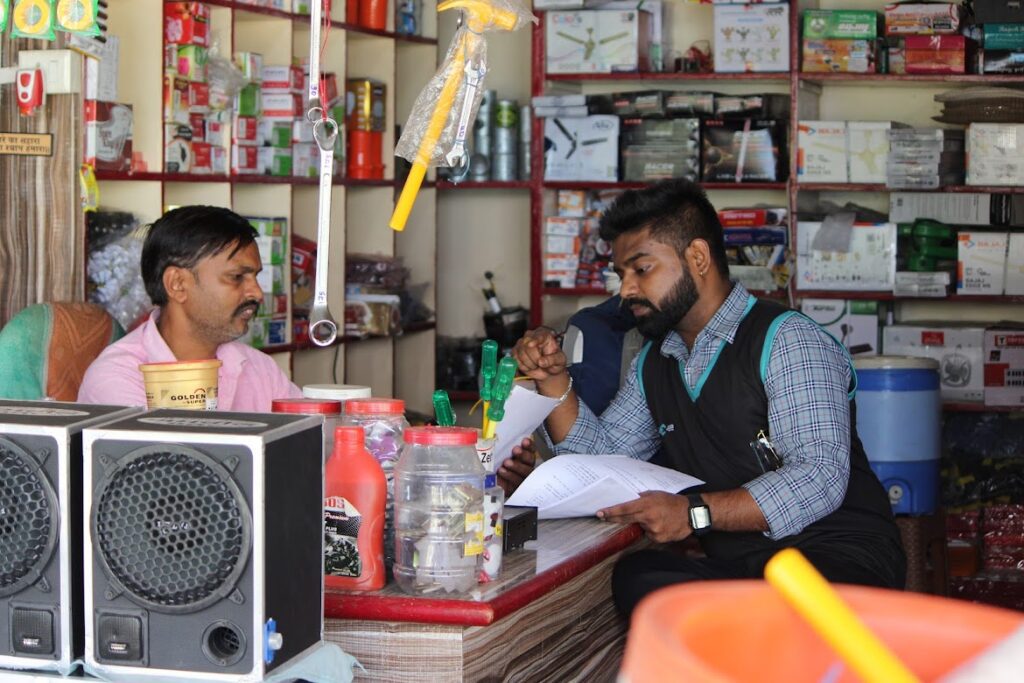
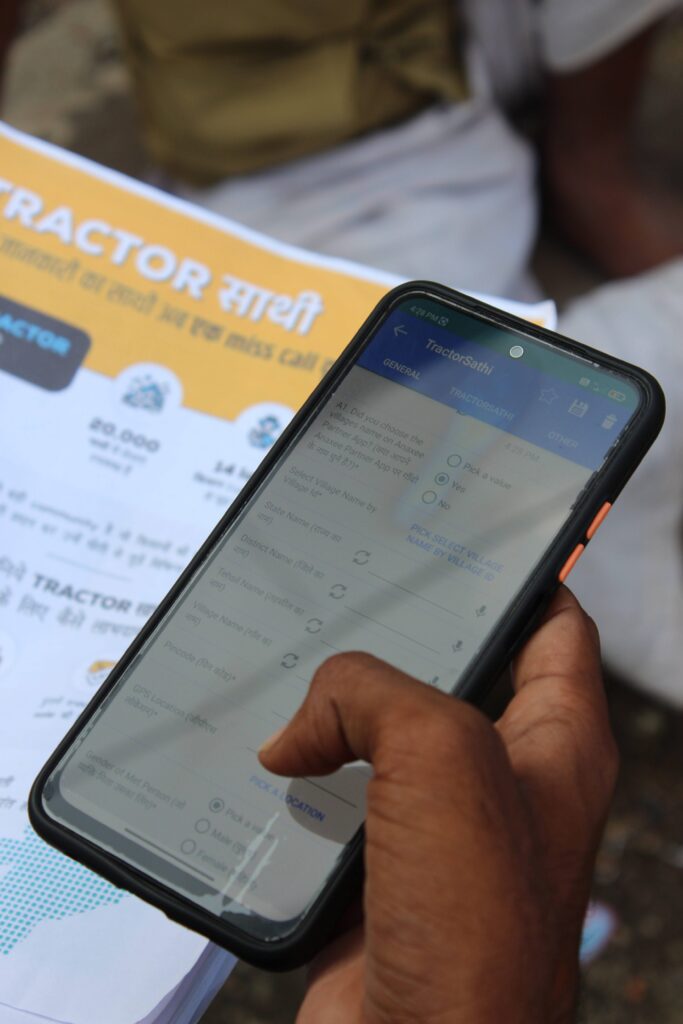
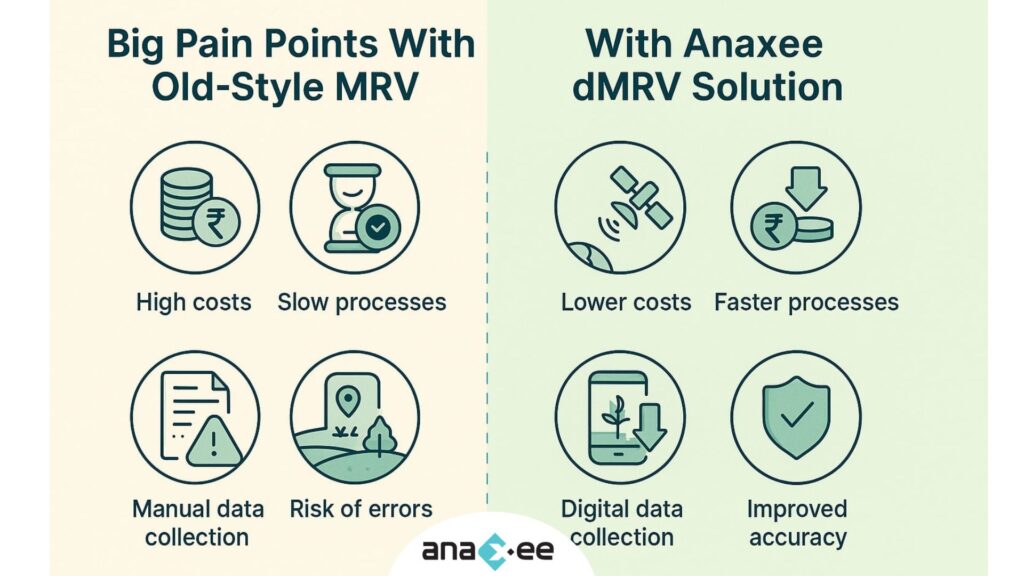
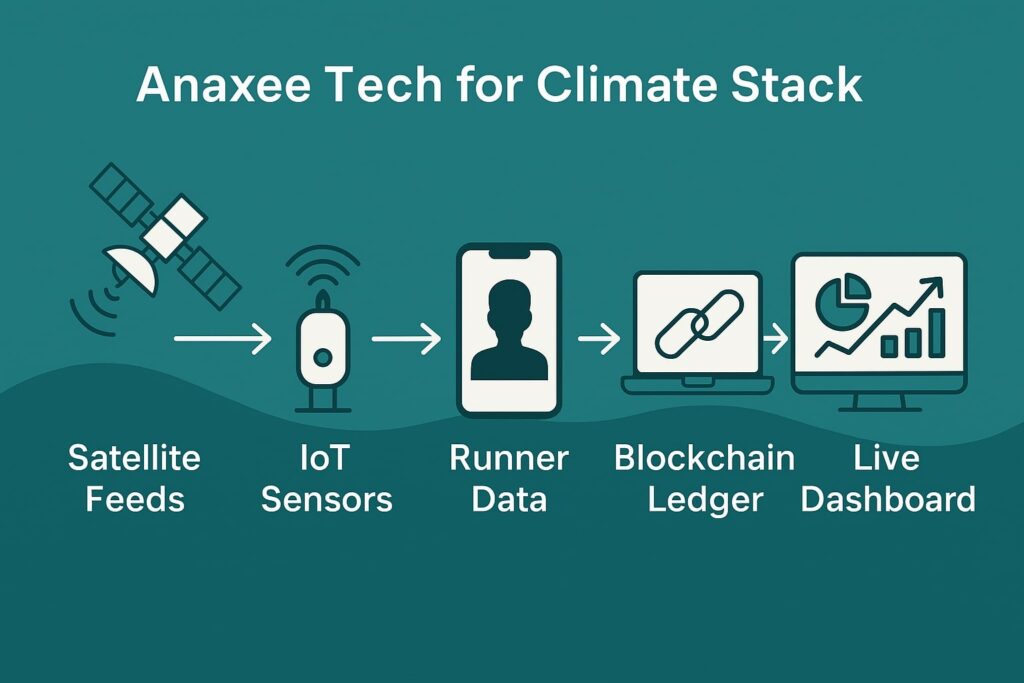
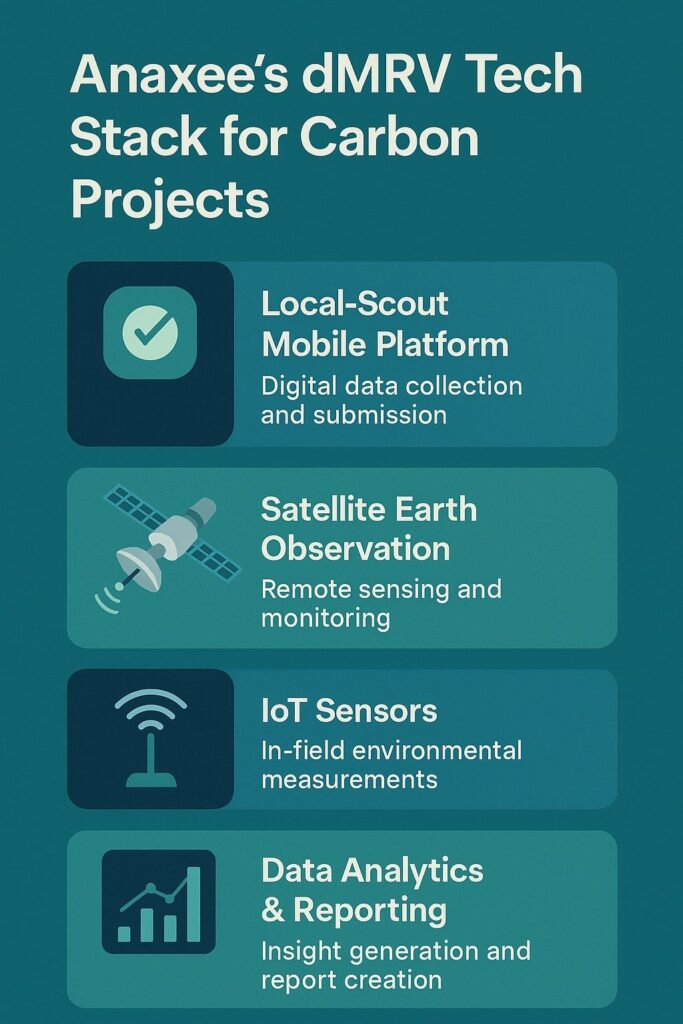
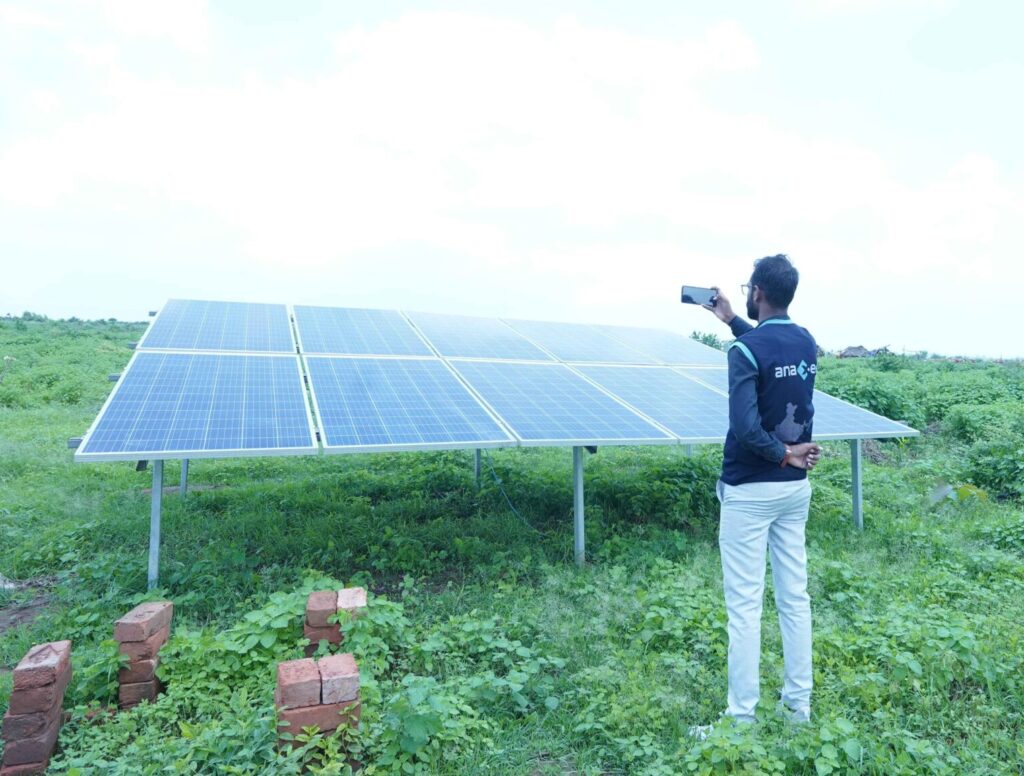
7 . Digital MRV: Transparency as Brand Ammunition
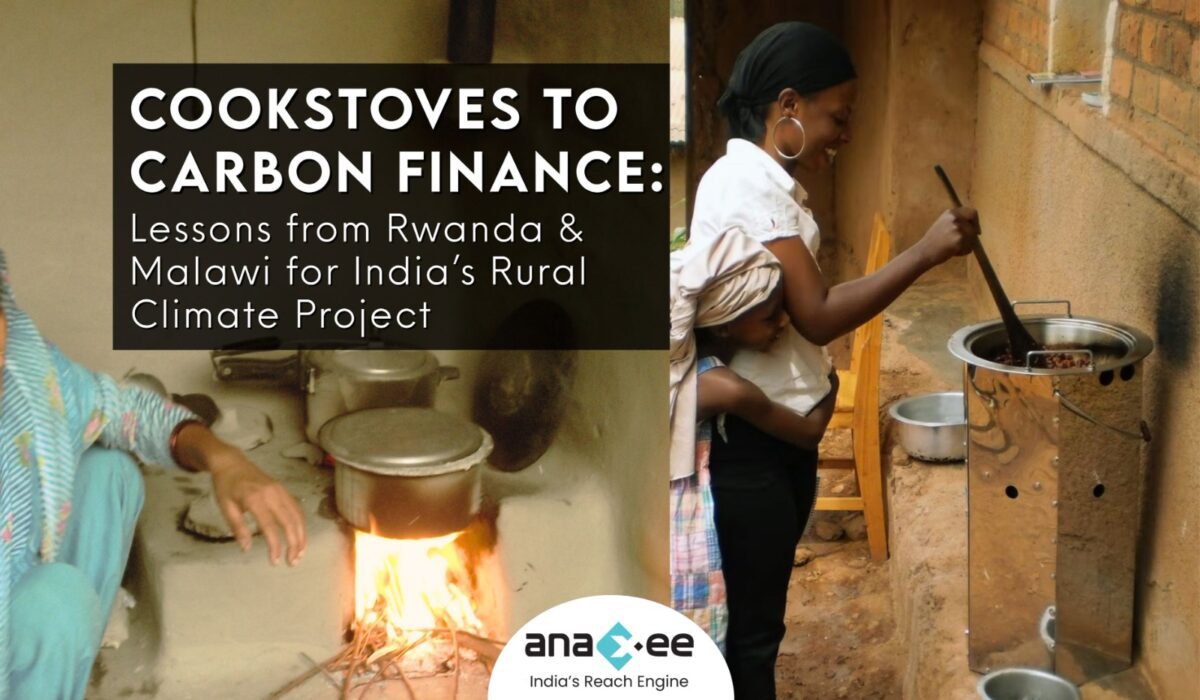
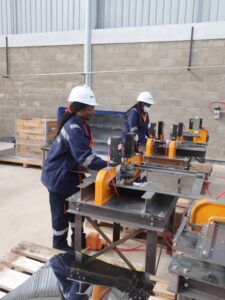
Slide imagery from the album highlights QR‑coded tree tags and satellite‑verified biomass. That is exactly the Tech‑for‑Climate stack Anaxee runs in its Bund Plantation projects (VM0047). Real‑time dashboards slash verification delays from 18 months to 6 weeks and cut third‑party audit costs by ~35 %. Clients can embed live project links on product pages—turning data into marketing collateral.
8. Financing the Journey
Combine three pools:
Green Debt – Cheaper cost of capital tied to emission metrics.
Carbon Credit Revenue – Sell surplus or forward‑contract to offtakers.
CSR Budgets – Align social projects with climate co‑benefits (rural livelihoods, agroforestry).
PolicyCircle pegs India’s domestic carbon market opportunity at $200 billion by 2030—enough headroom to finance deep decarbonisation.
9. Sector Snapshots
Steel – Start blending scrap‑based EAF routes; hedge residual emissions with high‑integrity credits.
IT Services – Scope 2 is the bully; sign 24×7 green‑power PPAs and monetise unclaimed RECs.
Cement – Pilot calcined‑clay blends; bank early CCTS allowances, sell excess when price spikes.
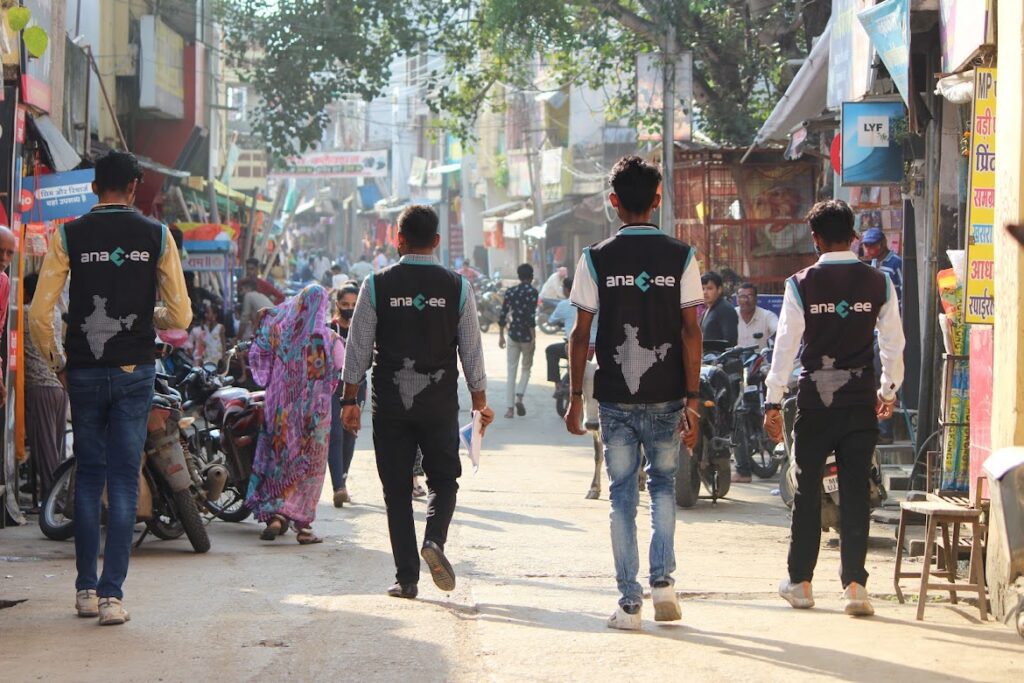
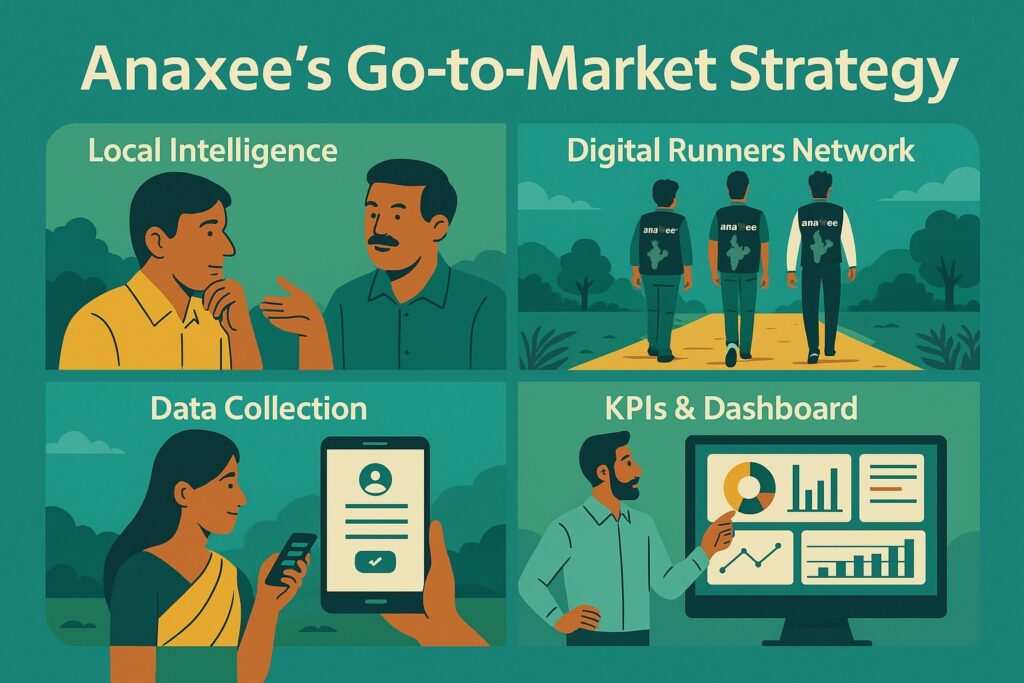
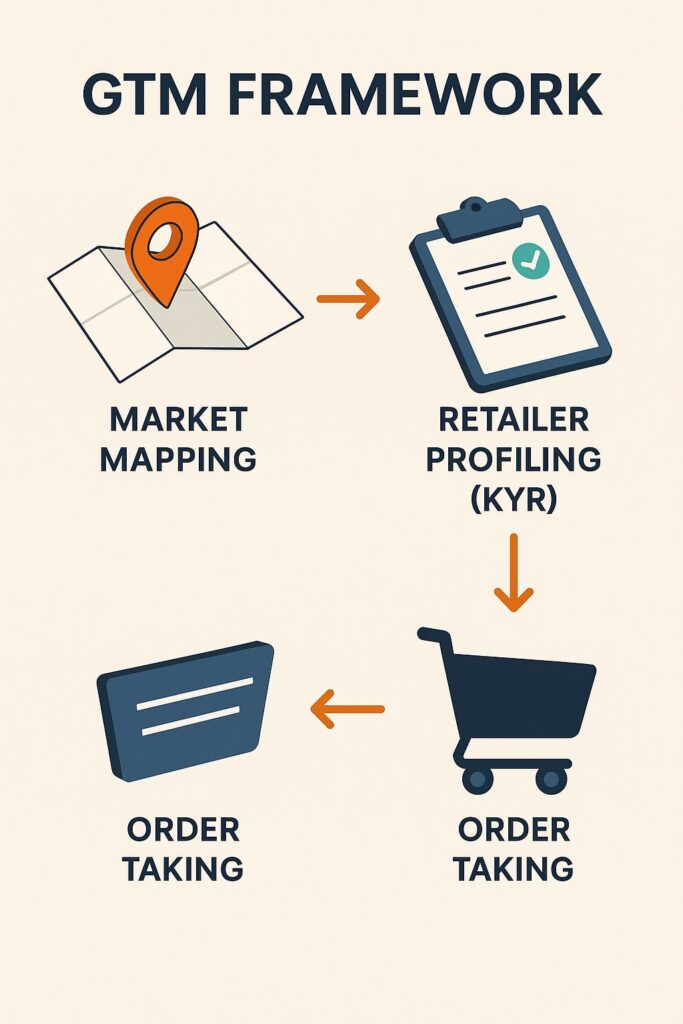
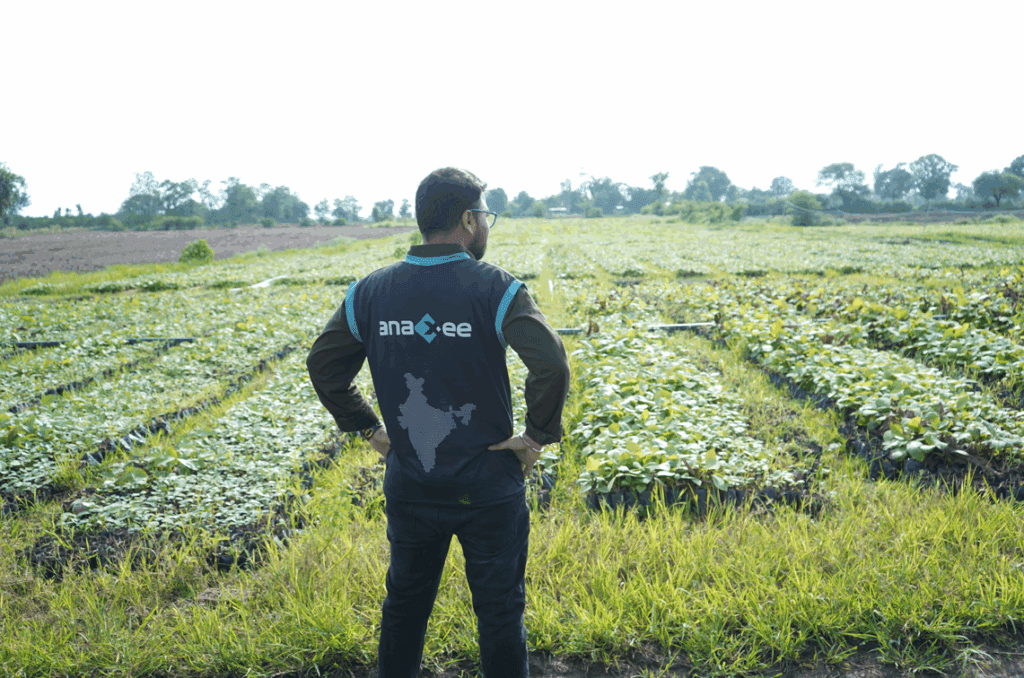
10. Anaxee’s Last‑Mile Advantage
Where typical consultants stop at strategy slides, Anaxee Digital Runners executes on the ground:
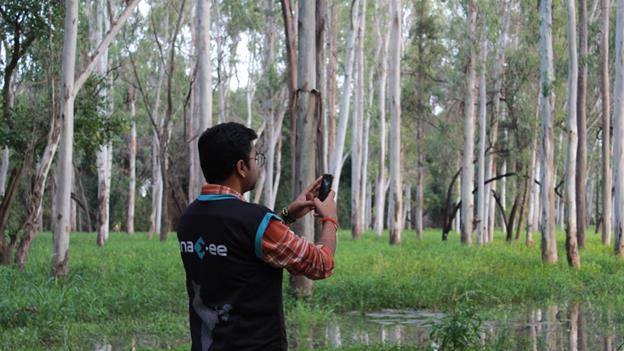
-Data Collection Network: 40,000 rural runners feed field data directly into dMRV apps.
-Geo‑Tagged Evidence: Every tonne comes with photo & GPS proof.
-End‑to‑End Service: From farmer onboarding to registry issuance—zero middle‑layers.
That reduces project cycle time by about 30 % vs legacy models, freeing cash sooner for reinvestment.
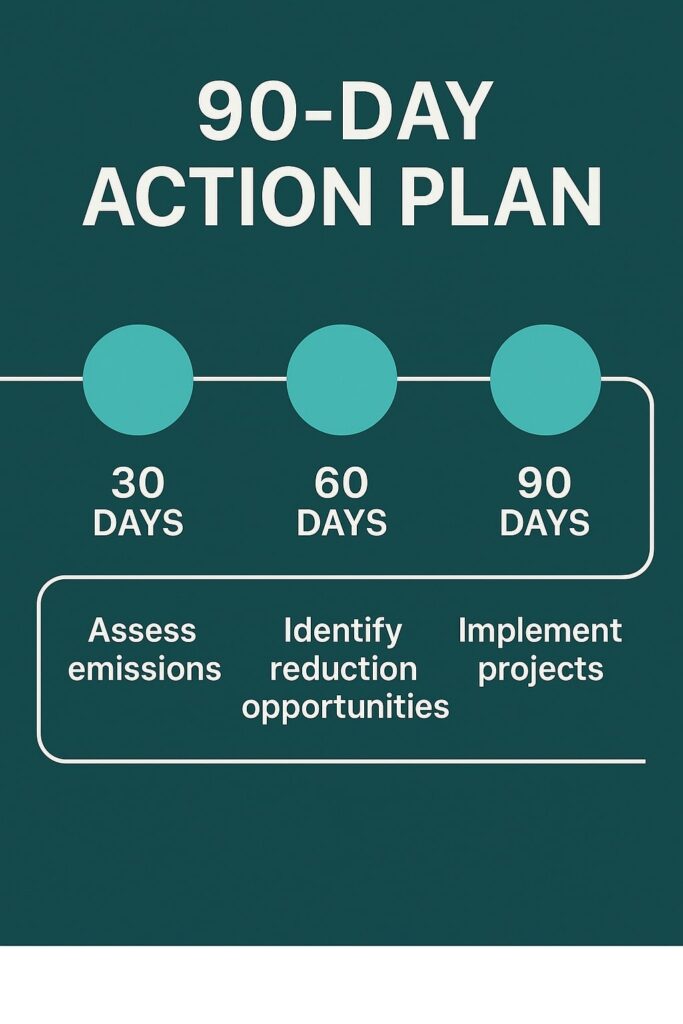
11. Action Plan—90 Days to Carbon Edge
| Week | Task | Outcome |
| 1–2 | Carbon risk heat‑map across units | Clear exposure snapshot |
| 3–4 | Internal price modelling | Board‑approved rate |
| 5–6 | Credit sourcing RfP | Short‑list of high‑quality projects |
| 7–8 | Digital MRV pilot (Anaxee) | Live dashboard |
| 9–12 | Finance stack assembly | Blended funding secured |
12. FAQs
Q: Will CCTS prices start low and stay low?
A: Early prices may sit near ₹800‑₹1,000/t, but international linkage or CBAM pressure could triple quotes within five years. Hedge early.
Q: Offsets have a bad rep—isn’t that risky?
A: Integrity scandals stem from poor MRV and additionality gaps. Demand projects with transparent baselines, conservative buffers, and digitised monitoring—exactly where Anaxee specialises.
13. Key Takeaways
-Compliance is the floor, not the ceiling.
-Carbon markets can fund innovation, protect exports, and even open new revenue streams.
-Digital transparency is your moat.
14. Internal Linking Suggestions
-Link “Bund Plantation projects” to your VM0047 SOP blog.
-Point “Digital MRV pilot” to your dMRV explainer post.
-Cross‑link “Green Debt” to your carbon‑finance‑grants article.
15. Suggested Visual Assets (call on slides)
| Graphic | Where to insert | Alt Text |
| Bar chart of forecast CCTS prices 2025‑2030 | After Section 8 | “Projected CCTS allowance price curve 2025‑30” |
| Infographic: 90‑Day Action Plan | Section 11 header | “Roadmap to carbon‑competitive advantage” |
| Photo collage from album: QR‑tagged saplings & satellite overlay | Section 7 | “Digital MRV in action—field data to registry dashboard” |
16 . Call to Action
Ready to turn carbon costs into competitive muscle? Talk to Anaxee’s Climate Team- we’ll map your risks, source high‑integrity credits, and digitize proof so you can brag about it. Connect with us at sales@anaxee-wp-aug25-wordpress.dock.anaxee.com