Biochar Projects in India — Practical Guide to Design, MRV and Marketable Carbon Removals

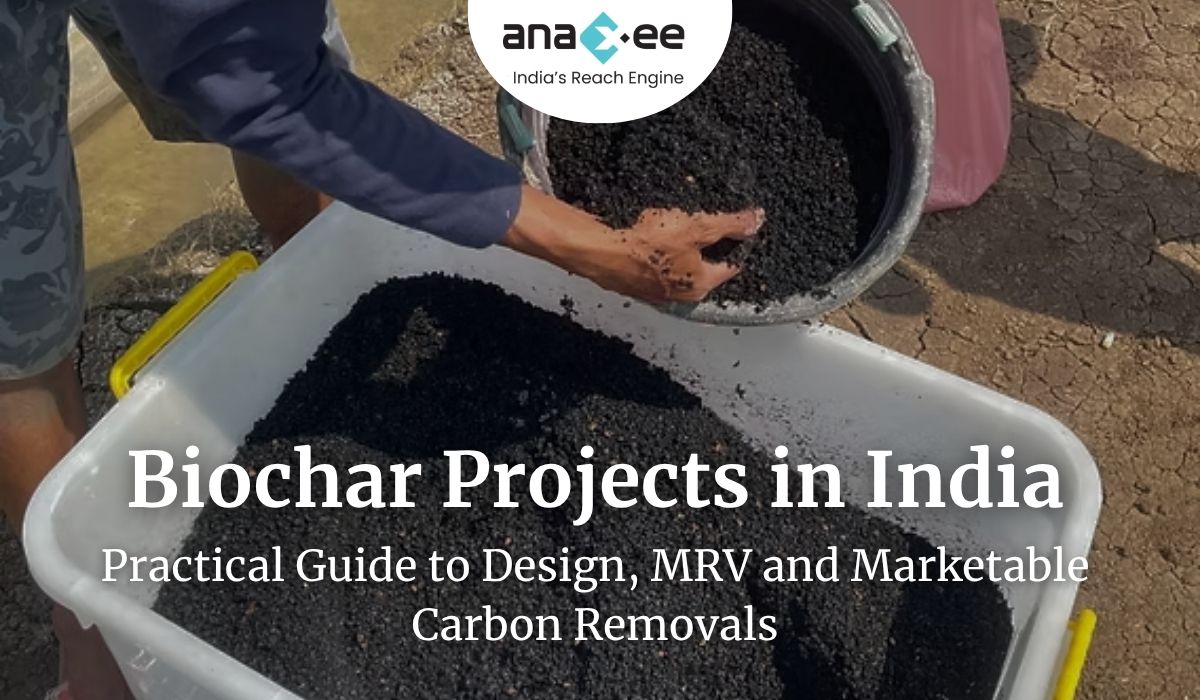
Biochar Projects in India: From Soil Health to Marketable Carbon Removals — A Practical, No-Nonsense Guide for Developers and Buyers

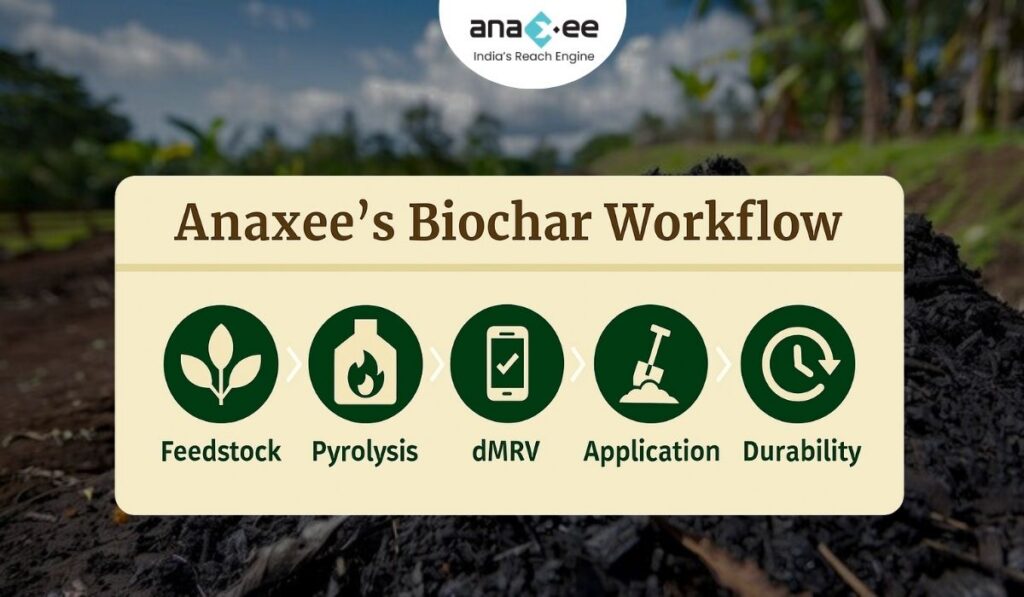
Biochar can be a credible carbon-removal pathway and an agronomic input — but only if projects confront three messy realities head-on: (1) feedstock sourcing that avoids diversion or indirect emissions, (2) pyrolysis process control that guarantees carbon stability, and (3) soil carbon measurement that is conservative, repeatable and auditable. Buyers love the headline — “permanent carbon in the soil” — but verifiers and scientists will ask for lab analyses, decay-model transparency, and careful baseline/additionality. If Anaxee designs biochar pilots around traceable feedstock chains, validated pyrolysis lab certificates, conservative permanence factors, rigorous soil sampling and transparent benefit sharing, the credits will survive scrutiny and command a premium. If you shortcut any of these, expect pushback, discounting or reputational cost.


1. Why biochar? The promise, and the necessary skepticism

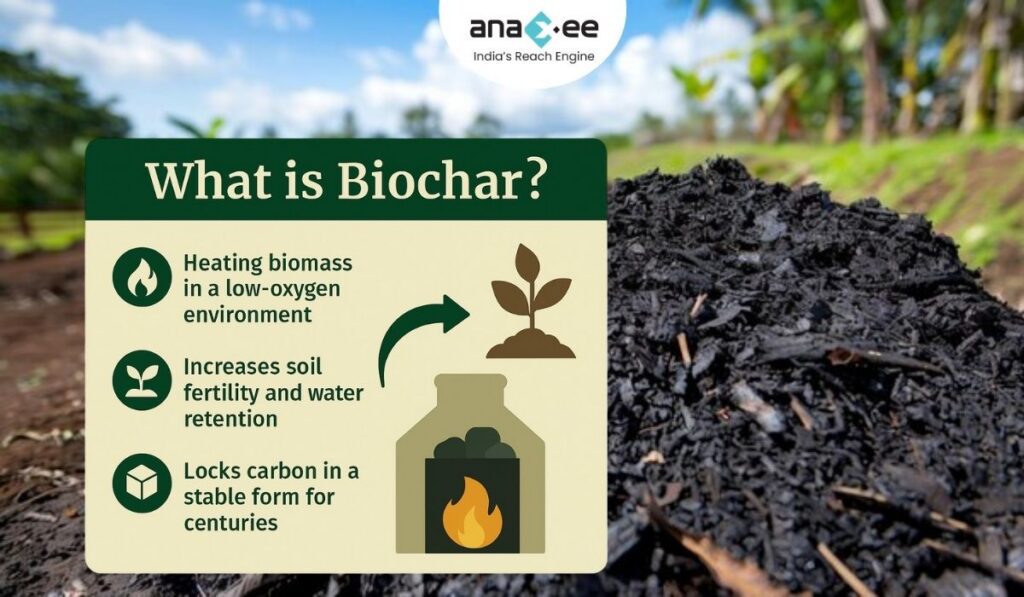
Biochar sits at a rare intersection: it can improve soil health, reduce nutrient/runoff losses, and lock carbon in a form scientists generally agree is more stable than uncharred biomass. That’s the promise. The skepticism is equally real: not all biochar is equal. The climate value depends on feedstock, pyrolysis temperature, residence time, and what happens to the biomass if not turned into char.

Key questions you must treat honestly from day one:

-What would the feedstock have been used for otherwise? (baseline displacement)

-Does producing biochar create a carbon debt in the supply chain? (collection, transport, drying)

-How stable is the char in your soil and climate? (decay rates vary)

-Are the agronomic benefits genuine and durable, or context-specific short-term gains?

These are not academic quibbles. They determine whether your credits are durable, additional and marketable.


2. What a biochar carbon project actually sells

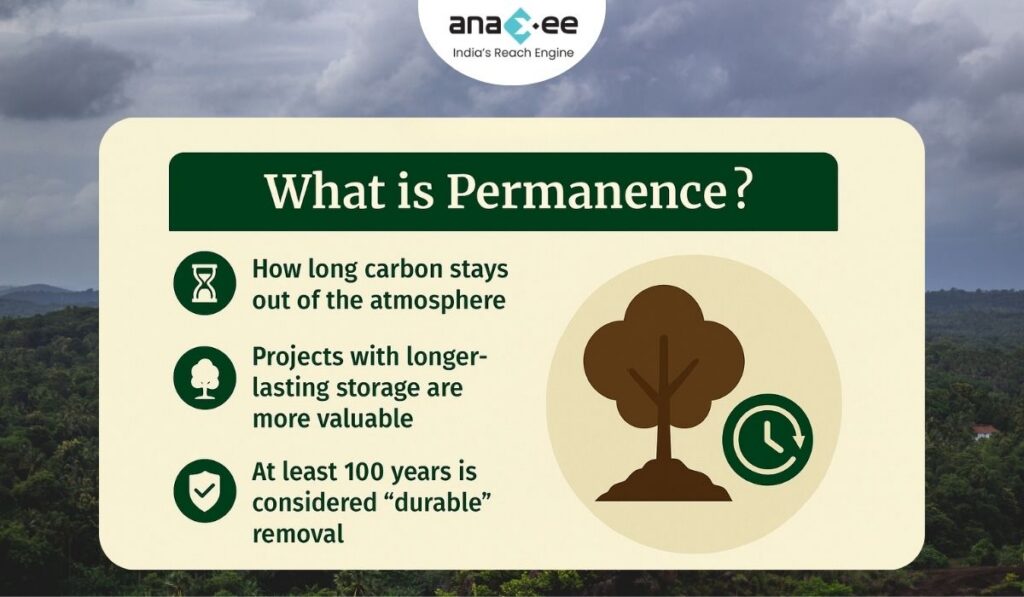
Put simply: a biochar project sells carbon sequestration in a pyrogenic form — the fraction of carbon in the produced char that remains stable in soil for climate-relevant timescales (decades to centuries). Unlike tree planting (where permanence risks center on fire, harvest, land-use change), biochar permanence is about chemical stability and soil processes. You must convert a mass of feedstock into an auditable quantity of stable carbon, and then show that the soil retains it over time according to a conservative model.

There are two revenue streams (often intertwined):

  1. Carbon removals credits — the quantified, conservative estimate of long-term carbon sequestered in soil due to biochar application.

  2. Co-benefits monetisation (optional) — agronomic yield, reduced fertilizer need, water retention, local livelihoods; useful for impact buyers but must be evidence-backed.

Never oversell both simultaneously without rigorous evidence. Buyers will discount if agronomic benefits are speculative.


3. Feedstock: the core integrity issue

Feedstock choice is political, environmental and commercial. A project’s integrity rises or falls on whether feedstock sourcing causes direct or indirect emissions, food/forage competition, or land-use change.

Practical rules:

-Prefer waste residues: agricultural residues, processing waste, or invasive biomass that would otherwise rot, be burned openly, or require disposal. But don’t assume “waste” is free of competing uses — fodder, bedding, or brick kilns sometimes use the same residues. Document local usage.

-Avoid virgin wood from standing trees: converting live trees to char is almost never additional or acceptable.

-Traceability is mandatory: each feedstock batch should have a documented origin, weight, moisture content at intake, and a chain-of-custody record. Build simple field receipts with GPS and countersigned notes.

-Calculate opportunity cost: what the biomass would have been used for absent the project (baseline) must be defensible. If a residue is typically burned as fuel, turning it into biochar shifts emissions; if it was used as animal bedding, the analysis must capture that trade-off.

Don’t assume local communities won’t push back if residual value is expropriated; include stakeholders early in the feedstock policy and benefit-sharing plan.


4. Pyrolysis technology: temperature, yield, and stability

Pyrolysis — heating biomass in low-oxygen conditions — produces biochar, gases and bio-oil. The key control variables for carbon projects are:

-Temperature and residence time: higher temperatures typically increase aromaticity and carbon stability but reduce char yield per ton of feedstock. There’s a trade-off between quantity of char and its long-term stability. Projects must declare their operating point and justify how that maps to stability parameters.

-Process type: slow pyrolysis tends to yield more char; fast pyrolysis prioritises bio-oil. For carbon projects, slow, controlled pyrolysis is usually preferred for higher char yields.

-Char characterization: lab tests are mandatory. Measure fixed carbon fraction, volatile matter, ash content, aromaticity indicators (e.g., H/C ratio), and specific surface area (if claimed). These metrics feed into the decay model used in the PDD.

Operational imperatives:

-Use certified pyrolysis units with documented operating logs (temperature, feed rate, residence time). Don’t rely on “we ran it at ~500°C” claims without continuous monitoring logs.

-Retain representative char samples per batch and archive them for auditing. Randomly test samples in third-party labs to prevent bias.

-If your process lacks instrumented controls and archived logs, VVBs will treat your ex-ante carbon estimates with extreme scepticism.


5. How much carbon is stable? Measurement, modelling, and conservative accounting

This is the hard technical core for MRV teams: transforming a ton of biomass feedstock into an auditable amount of stable soil carbon.

Basic steps:

  1. Mass balance at the plant: measure dry mass of incoming feedstock and output char mass (all on dry mass basis). Keep moisture logs.

  2. Char carbon content: determine fixed carbon fraction (%) by lab analysis. Multiply output char mass × carbon fraction to get char C mass.

  3. Stability fraction: not all char C is permanent. Apply a conservative stability fraction (the share of char C expected to remain in soil after the relevant time horizon). That fraction must be justified with lab data and literature; use conservative estimates accepted by registries.

  4. Soil residence and fate: account for application loss pathways (runoff, erosion, ploughing depth changes) and any subsequent soil processes that can mineralise a portion of char C.

Two pragmatic rules:

-Use conservative stability factors in ex-ante claims (registries and buyers prefer lower, defensible numbers that survive scrutiny).

-Present sensitivity analyses: show best-estimate and conservative scenarios; buyers appreciate transparency and will prefer the conservative baseline.

Remember: verifiers will ask for the raw lab files, instrument calibration certificates, and chain-of-custody for samples.


6. Soil carbon measurement: sampling design and statistical basics

Counting soil carbon is expensive and error-prone if done badly. But it’s the gold standard for demonstrating real sequestration in situ, especially if you seek to show net soil C increases beyond the char carbon you applied (e.g., priming effects).

Design principles:

-Baseline sampling: collect soil cores across representative strata (soil type, cropping system, topography) before any application. Record depth increments (e.g., 0–10 cm, 10–30 cm). Baseline is non-negotiable.

-Control plots: where feasible, use randomized control plots (no-biochar) to detect non-biochar drivers of change. This strengthens additionality claims.

-Sufficient replication: soil C is spatially variable — sample sizes must produce confidence intervals that meet verifier requirements. Plan statistically (not heuristically).

-Standardised lab methods: use dry-combustion CHN analyzers for organic C determination; report uncertainty, detection limits, and QA/QC logs. Use the same lab and method across monitoring cycles.

-Re-sampling cadence: re-sample at conservative intervals — e.g., 1 year, 3 years, 5 years, depending on the registry and decadal permanence expectations. Soil carbon accrues slowly; don’t promise large near-term gains based solely on yield improvements.

If you cannot afford comprehensive soil sampling, you can still sell removals based on feedstock → char mass accounting with conservative stability fractions — but expect lower unit prices. Direct soil measurements command higher confidence and price if done well.


7. Additionality, leakage and co-impacts: the accounting perimeter

Biochar projects must pass the same additionality and leakage tests as other carbon projects.

-Additionality: demonstrate the biochar activity would not have happened without carbon revenue. This is tricky when small-scale entrepreneurs or agronomic experiments could scale without carbon finance. Build a clear financial model showing the project is not economically viable without carbon income (e.g., capital for pyrolysis units, logistics, or farmer incentives).

-Leakage: could using residues for char divert them from alternative uses, forcing replacement biomass harvesting elsewhere? Estimate such indirect effects and, if material, apply leakage deductions or buffer credits. Document assumptions transparently.

-Non-GHG co-impacts: soils can benefit (yield, water retention) or sometimes suffer (if char contains contaminants or changes soil pH). Monitor for unexpected negative impacts and include them in your social and environmental safeguards.

Don’t rely on wishful thinking. Verifiers will probe the baseline counterfactual and whether the project creates displacement of existing resource uses.


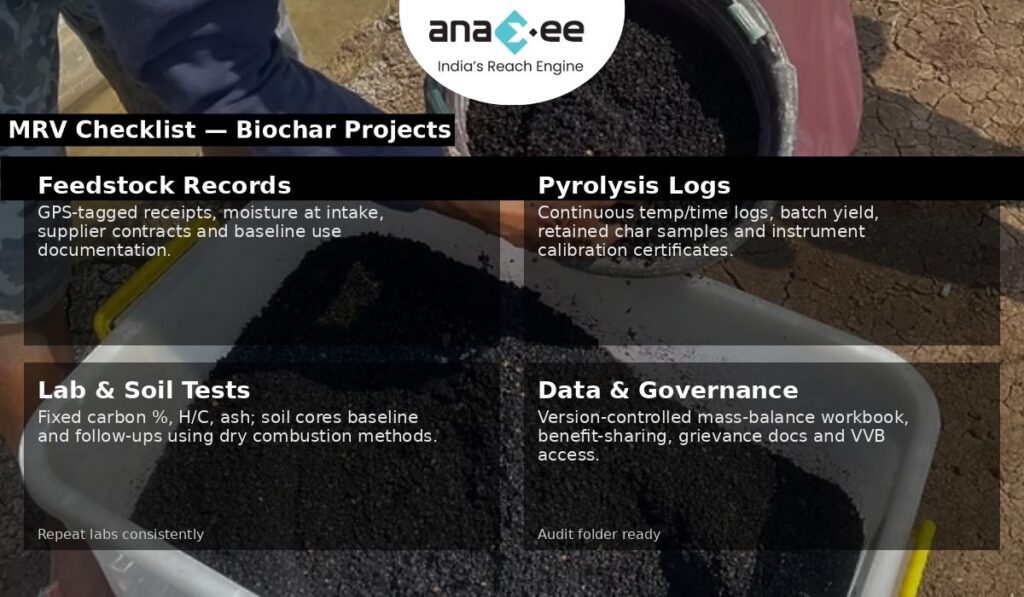
8. MRV practicalities: what your verification folder must contain

If you want a VVB to pass on first review, prepare this folder — it’s not optional:

-Feedstock logs: batch receipts, GPS origin, supplier contracts, moisture analysis, and sample archives.

-Pyrolysis logs: continuous temperature-time profiles, feed rates, unit run IDs, representative char yields per run.

-Lab certificates: char fixed carbon %, volatile matter, ash content, H/C ratios, lab calibration certificates, and lab chain-of-custody forms.

-Soil sampling files: baseline and follow-up core sample IDs, GPS, depth logs, lab results, and QA/QC checks.

-Mass-balance spreadsheet: raw data with calculations from feedstock dry mass → char mass → char C → stable C with clearly shown formulas. Maintain version control and preserve raw files.

-Project governance & community consent: feedstock access agreements, benefit sharing, and grievance mechanism records.

-Model documentation: the decay model and literature justification for chosen stability fractions and any factors applied.

If any of these elements are missing or poorly documented, the VVB will increase uncertainty factors or reject claims.


9. Costs and economics: realistic budgeting

Biochar projects have predictable cost centers. Budgeting conservatively avoids painful write-downs later.

Typical cost categories:

-Capital: pyrolysis units (from small mobile kilns to fixed industrial units). Quality, instrumented units cost more but provide audit trails.

-Feedstock logistics: collection, drying, grinding, transport. Moisture reduction is often a hidden cost — wet feedstock lowers yield and increases energy needs.

-Lab testing: batch char characterization and soil sample analysis. These are recurring and non-trivial.

-Soil sampling & MRV: field teams, coring equipment, transport, and lab costs.

-Operations & management: local teams, data processing, inventory systems.

-Verification & registry fees: VVB cycles and registry issuance costs.

-Buffer and contingencies: for permanence risks, leakage or lower-than-expected stability.

Do not underprice MRV and lab testing. They are the marginal cost that determines whether credits survive validation.


10. Commercialization: who buys biochar credits and why

Buyer demand varies. Typical buyer types and their motivations:

-High-integrity removals buyers (tech firms, net-zero pledgers): they want conservative, well-documented removals they can confidently book against targets. They will pay a premium for verifiable soil carbon with rigorous MRV.

-Impact buyers: NGOs or corporates interested in soil health and livelihoods may buy projects with demonstrable co-benefits even if carbon prices are modest.

-Commoditised buyers: traders looking for volume may accept lower MRV rigour at a discount; these are riskier counterparties.

Packaging matters: deliver small digital dashboards with char mass flows, archived lab files, and anonymised soil result extracts to high-integrity buyers. They will ask for chain-of-custody and may request spot re-tests.


11. Common pitfalls and how to avoid them

Be direct: many projects fail on avoidable errors. Avoid these:

-Weak chain-of-custody: failing to document feedstock origin exposes you to leakage accusations. Fix: standard receipts + GPS + supplier contracts.

-Poor pyrolysis controls: hand-built kilns without logs make stability claims impossible to justify. Fix: instrumented units and archived run logs.

-Insufficient soil sampling: tiny sample sizes produce wide confidence intervals and unreliable claims. Fix: consult a statistician and build a representative sampling frame.

-Over-claiming co-benefits: yield improvements are context-dependent; don’t promise what you can’t prove. Fix: conservative claims and pilot data.

-Ignoring community impacts: feedstock extraction can create local grievances if not consented and compensated. Fix: explicit benefit sharing and FPIC where applicable.

Shortcuts increase audit friction and ultimately lower project value.


12. Project design template — from pilot to program

Infographic: "Pilot Design — 5 Practical Steps" over a photo of biochar in a white tub; four panels read Phase 0: Scan; Phase 1: Pilot; Phase 2: Standardize; Phase 3: Commercialize.

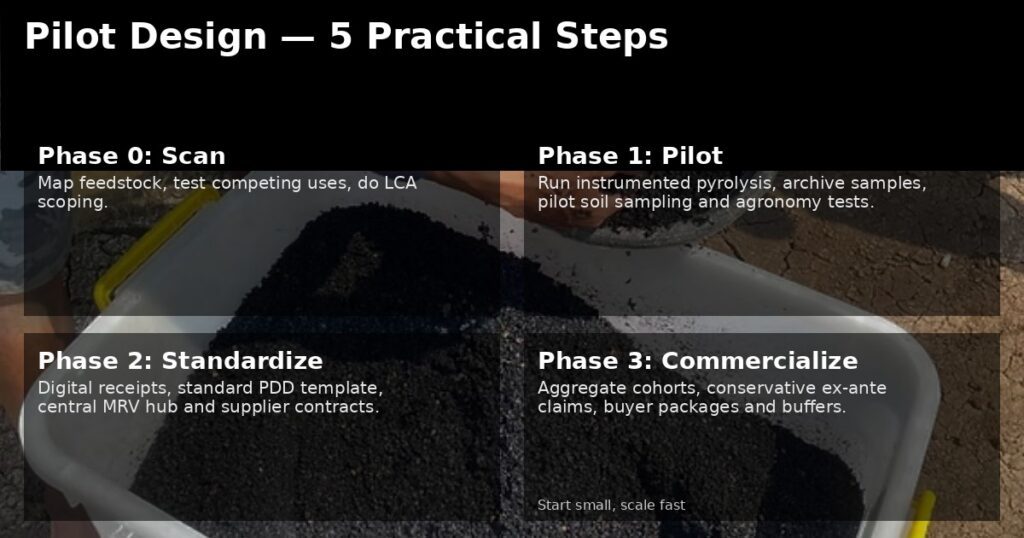
Here is a practical stepwise blueprint Anaxee can replicate.

Phase 0 — Feasibility & stakeholder scan

-Map feedstock availability, current uses, and competing markets.

-Test community sentiment on feedstock use and land rights.

-Conduct an initial LCA scoping to identify high-risk upstream emissions.

Phase 1 — Pilot (replicable, data-centric)

-Install a pilot pyrolysis unit with full instrumentation.

-Produce char at controlled settings; archive samples.

-Run a small soil sampling regime (pilot control vs treated plots).

-Measure agronomic outcomes and perform preliminary farmer interviews.

-Build mass-balance spreadsheets and model stability fractions conservatively.

Phase 2 — Scale (standardise and govern)

-Standardise feedstock receipts and supplier contracts.

-Deploy certified pyrolysis units and train operators.

-Implement a central MRV hub for data ingestion, char archiving, and soil sample management.

-Create a benefit-sharing mechanism linking feedstock suppliers and smallholders to revenue streams (not just promises).

-Engage VVB early with pilot data to align monitoring expectations.

Phase 3 — Program & commercialization

-Aggregate across sites, harmonise PDD documentation and governance.

-Prepare buyer packages (conservative ex-ante claims + soil re-sampling schedule + QA documents).

-Price credits transparently accounting for buffer pools for risk.


13. PDD & MRV language: audit-ready clauses

Objective (sample):

“Quantify the amount of pyrogenic carbon sequestered in agricultural soils through application of conventionally produced biochar, using a conservative, auditable mass-balance approach (feedstock dry mass → char mass → char C → stable C) complemented by soil sampling for a subset of plots. All laboratory certificates, plant run logs, and chain-of-custody documentation will be retained in the project MRV repository and made available to the VVB.”

Monitoring approach (sample):

“Mass flow monitoring will record dry feedstock intake, char output mass, and batchwise char sampling for laboratory determination of fixed carbon. Soil cores from stratified representative plots (treatment and control) will be collected at baseline, Year 1, Year 3 and Year 5 and analysed using dry combustion. Ex-ante stable fraction assumptions will be conservative and justified with third-party lab tests and literature.”

Use these as starting points and make your numbers conservative.


14. Anaxee’s competitive playbook — where you must get ruthless

Infographic: "MRV Checklist — Biochar Projects" overlaying a close-up of biochar; panels list Feedstock Records, Pyrolysis Logs, Lab & Soil Tests, and Data & Governance.

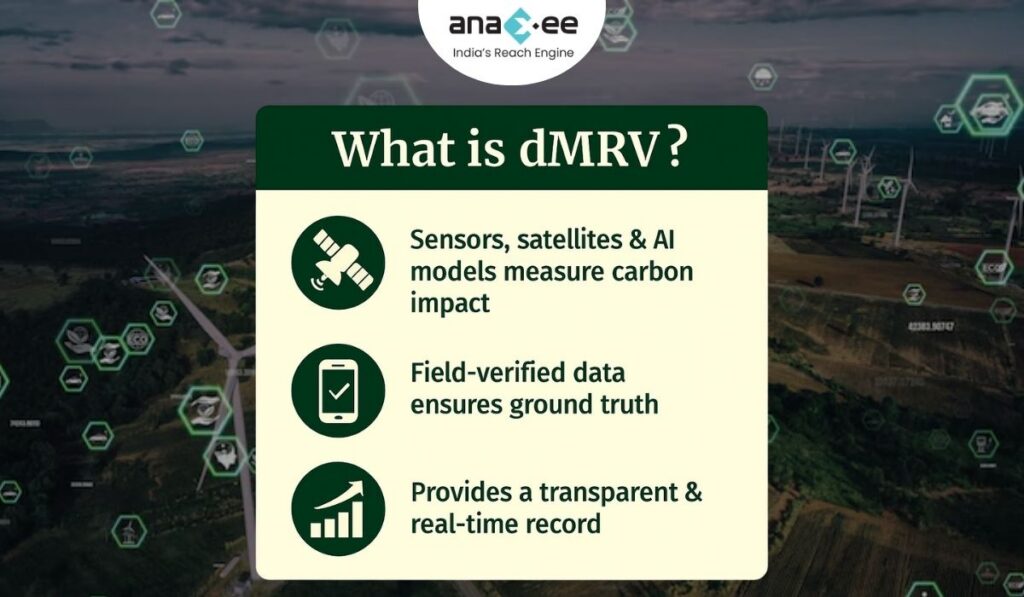
Anaxee’s strengths (local teams, dMRV, last-mile execution) can make biochar commercially viable — but execution must be ruthless about documentation.

Concrete moves:

  1. Invest in one well-instrumented pilot: purchase a quality slow-pyrolysis unit with data logging; get char samples tested in reputable labs. This single pilot will define your PDD parameters.

  2. Standardise receipts and digitalise the supply chain: use simple mobile forms for supplier receipts with GPS and photos to create tamper-resistant evidence.

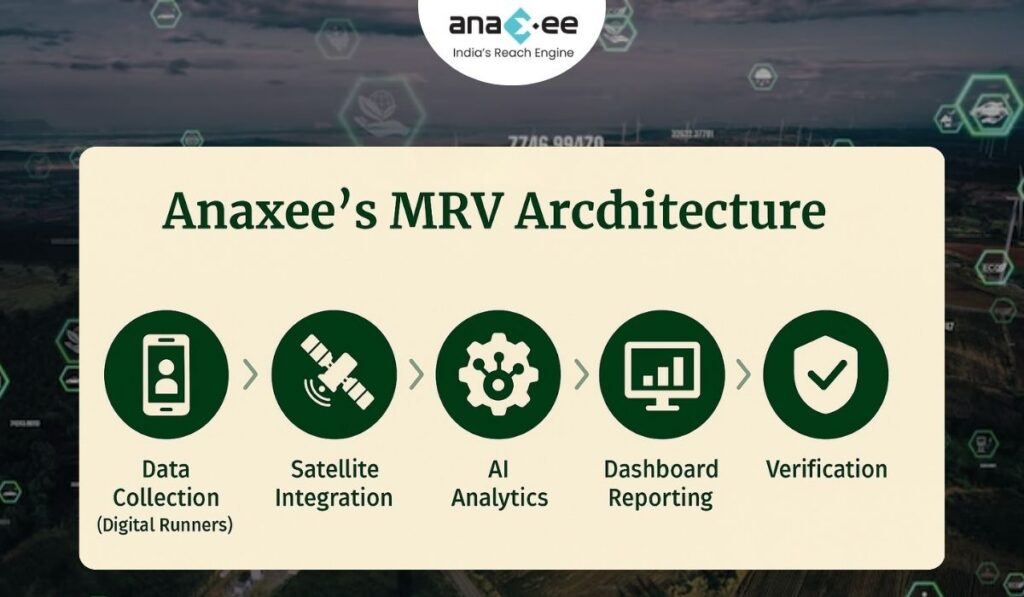
  3. Build a central MRV hub: ingest run logs, lab files, soil data and generate audit packs automatically. This reduces VVB time and fees.

  4. Offer a transparent benefit-share to suppliers: a fair, quick payment mechanism prevents grievances and secures feedstock.

  5. Pitch conservative credits to high-integrity buyers first: premium buyers will help establish price anchors.

Don’t try to be everything at once. Do one well-documented project, prove the model, then scale.


15. Hypothetical case study: a replicable pilot model

Context: Agro-processing clusters producing cassava/peanut shells in two districts, residues currently burned or left to rot.
Pilot size: 3,000 t/year feedstock capacity; expected char yield 15% dry mass.
Key controls: instrumented slow-pyrolysis unit, char batch archiving, lab char characterization, baseline soil sampling on 100 farm plots (50 control, 50 treatment).
Economics: feedstock payments to suppliers, capex amortised over 7 years, MRV and lab testing funded by early carbon forward sales at conservative price.
Risk mitigation: buffer pool allocation (5–10%), supplier contracts with grievance redress, drying yards to reduce moisture costs.

Outcome: conservative ex-ante carbon claim based on char mass × fixed C × conservative stability fraction; soil sampling used to validate and, over time, potentially increase confidence intervals and raise crediting volumes.


16. Buyer due diligence checklist (what buyers will ask)

Buyers who pay for removals will insist on:

-Mass-balance spreadsheet with raw feedstock & char logs.

-Laboratory certificates for char and soil analyses (with QA/QC).

-Chain-of-custody receipts for feedstock with GPS evidence.

-Pyrolysis run logs (temperature/time).

-Baseline, control plots, and soil sampling plan showing statistical adequacy.

-Evidence of supply-chain consent and benefit sharing.

If you can’t produce these in the first 72 hours, you will struggle to close quality buyers.


17. Ethics, community and co-benefits — don’t treat them as marketing copy

Biochar projects intersect livelihoods. If you extract biomass from smallholders without fair compensation, or if you promote feedstock diversion from animal bedding to char, you erode trust and create perverse outcomes. Document how suppliers are chosen, paid, and how their livelihoods are protected.

Co-benefits must be proven:

-Measure yield changes with randomized or matched control plots.

-Test soil health indicators (Cation Exchange Capacity, pH, available nutrients) for plausible agronomic claims.

-Be transparent about where biochar worked and where it didn’t — buyers appreciate honest reporting.


18. Final reality check — be conservative and transparent

Biochar is attractive. But the market will reward projects that are disciplined and transparent, not those that promise untested miracles. The correct posture is humility: treat ex-ante estimates as conservative hypotheses backed by lab and pilot data, not marketing copy. Buyers and verifiers will respect conservatism and clear audit trails.

If Anaxee wants to lead in biochar:

-Start with one instrumented pilot.

-Build standardised digital receipts and a central MRV hub.

-Use conservative stability fractions and publish sensitivity analyses.

-Prioritise feedstock traceability and supplier fairness.

-Engage a reputable VVB early with pilot data to align expectations.

Biochar can be both an effective soil amendment and a credible removal pathway — but only when the proofs are in the data, and that data is auditable.

Clean Cooking as a Carbon Opportunity: How Projects Generate Impact, Income and Verifiable Emissions Reductions

Clean-cooking projects can produce high-integrity emission reductions (ERs) only when developers solve three hard problems together: a defensible baseline, objective evidence of sustained adoption (not just distribution), and an audit-grade MRV system. Newer methodologies and MRV guidance now favour metered and sensor-backed approaches (VM0050, Gold Standard’s metered methodology, and Clean Cooking Alliance templates). Ignore this shift — rely on surveys alone — and your credits will be risky, discounted, or invalidated. If Anaxee designs projects around measurable sustained use (SUMs + meters), solid additionality evidence (especially in India’s PMUY context), and conservative accounting, the results are bankable and valuable to buyers.


1. Why clean cooking still matters (and why carbon finance is useful)

Taking the data of Beneficiary while Distributing the Improved Cookstove in Clean Cooking Project in India

Around the world, billions cook on polluting fuels (wood, charcoal, dung, kerosene). The harms are multiple: household air pollution and associated health burdens (disproportionately on women and children), time lost collecting fuel, pressure on local biomass stocks, and greenhouse gas emissions from inefficient combustion. In India, policy has massively expanded LPG access through programmes like Pradhan Mantri Ujjwala Yojana (PMUY), but access frequently does not equate to exclusive or sustained use — stove-stacking (using multiple cook technologies) is common. That gap — converting access into sustained clean-fuel use — is precisely where targeted carbon finance can help by underwriting behaviour-change, refills affordability, or technology maintenance. But funds must be tied to measurable, verifiable outcomes.


2.What clean-cooking carbon projects are actually selling

These projects sell avoided emissions — reductions in GHGs compared to a baseline where households continue to use more carbon-intensive fuels or inefficient stoves. Important clarifications:

-These are not carbon removals; permanence concerns are about sustained use, not geological storage.

-Credibility rests on additionality (would the reduction have happened without the project?), accuracy (are the reductions measured correctly?), and traceability (is there a clear audit trail of evidence?).

-Standards now require higher measurement fidelity; metered and stove-sensor approaches are fast becoming the preferred path for high-integrity claims.


3. Major project archetypes and their measurement implications

Not every cookstove project is the same. Each model has distinct MRV needs and transaction costs.

  1. Improved biomass cookstoves (ICS) — cheaper hardware replacing open fires. MRV challenge: objectively proving sustained use, since distribution often vastly overstates actual emission reductions.

  2. Fuel-switch projects (LPG, electricity, biogas) — replace biomass/fossil fuels with cleaner fuels. MRV challenge: demonstrate sustained fuel consumption (refill frequency, electricity kWh, or biogas production/use). Metering/purchase logs are high-value evidence.

  3. Advanced biomass & pellets — require supply-chain documentation to ensure feedstock sustainability and avoid leakage.

  4. Community-scale biogas — methane capture + use; MRV must quantify substitution versus baseline manure handling and open-fire use.

Higher measurement fidelity (meters, SUMs) usually increases costs but reduces uncertainty and raises buyer confidence — and thus price.


4. Baseline and additionality: the real accounting work

Baselines capture the counterfactual — what households would have done absent the project. With stove-stacking common, a naive baseline (e.g., “this household had a smoky stove”) is not enough. Typical baseline approaches:

-Survey-based baseline: household-reported fuel use and stove types. Cheap but prone to social-desirability and recall bias.

-Observed baseline: enumerator observation of stove type and fuel stores. Useful but limited for quantifying hours-of-use.

-Metered baseline: where possible (LPG refills, electricity meters), provides objective consumption history. Preferred when feasible.

Additionality in India is the hard edge-case because PMUY and related subsidies have changed the policy landscape. PMUY has delivered tens of millions of LPG connections — the program data show very large coverage and rising refill rates — which means carbon projects must demonstrate additional behaviour (e.g., increased refill frequency, bridging affordability gaps, stimulating exclusive use, or targeting households not reached by government programmes). Relying on distribution of an LPG cylinder alone without proving sustained refills will not pass muster. Use government data to justify your additionality assumptions and be conservative.


5. The MRV reality: what verifiers now expect

Beneficiary and Digital Runner showing thumbs up after Receiving Improved Cookstove under Anaxee's Clean Cooking Initiative

Standards (Verra, Gold Standard) and the Clean Cooking Alliance have moved decisively toward objective measurement. The key MRV components every credible project must have:

5.1 Stove Use Monitors (SUMs)

SUMs — small temperature/data loggers affixed to stoves — objectively record stove usage events and durations. They are the most defensible way to demonstrate ongoing use for non-metered stoves. Deploy SUMs on a statistically valid, stratified sample and combine with surveys to extrapolate to the whole cohort. SUMs help detect a Hawthorne effect, tampering, and temporal adoption patterns. Clean Cooking Alliance protocols explicitly recommend SUMs as best practice for usage verification.

5.2 Metered approaches for fuel-switch projects

For LPG or electrical cooking projects, purchase records, cylinder refill logs, or electricity meters are the best evidence. Gold Standard’s metered methodology and Verra’s VM0050 explicitly recognise and prefer metered data where feasible because it significantly reduces uncertainty. If you operate in a PMUY context, work with refill retailers or LPG OMCs to access anonymised refill frequency data for beneficiaries where possible.

5.3 Surveys, KPTs and CCTs

Kitchen Performance Tests (KPTs) and Controlled Cooking Tests (CCTs) remain useful for labelling device efficiency and translating device performance into fuel savings under controlled conditions. But field-level sustained use needs SUMs/meter evidence, backed by representative household surveys capturing stacking behaviour and qualitative reasons for non-use. Standards increasingly require the mixed-method approach: sensors + surveys + purchase records.

5.4 Sampling design and QA/QC

Design your sampling to meet verifier confidence thresholds. Use stratified random sampling by socio-economic status, geography, household size, and initial baseline stove/fuel type. Train enumerators intensively, keep GPS-tagged photos, and maintain raw data files with version control. Verifiers will demand original SUMs logs, raw survey forms, enumerator training records, and a documented data cleaning process — so treat data management as a compliance function, not an afterthought.


6. A practical MRV protocol (copy-paste-ready checklist)

Anaxee's Digital Runner taking Digital information/Data of Women rural women for Rural Marketing

This is operational — adopt it and modify per project specifics.

Monitoring schedule

-Baseline: SUMs (sample) + survey (full) + fuel purchase data collection (if available).

-Early follow-up: 3 months post-distribution (adoption signals).

-Core monitoring windows: 6, 12, 24 months (SUMs + surveys).

-Annual reporting thereafter; scheduled SUMs redeployments for sample refresh every 18–24 months.

Data to collect

-Raw SUMs temperature logs (time-stamped).

-Fuel purchase/refill receipts or utility meter logs.

-Household survey results (baseline and follow-ups).

-Pictorial proof (GPS-tagged photos) and enumerator visit logs.

-Device serial numbers, beneficiary registry, installation logs.

Quality assurance

-Double-entry or automated ingest from SUMs into central repository.

-Supervisor spot-check on 10% of visits.

-Tamper-detection (SUMs battery/connection checks) plus periodic device recalibration.

-Maintain an audit folder with all raw and derived files for VVB access.

Use this as your MRV spine and then add PDD-specific formulas, e.g., substitution factors, emission factors, and conversion tables.


7. Risk, integrity, and the reputational minefield

Cookstove carbon credits faced strong academic and media scrutiny for overstated claims in the past. That scrutiny forced standards bodies and the Integrity Council (ICVCM) to raise the bar — rejecting simplified, survey-only methodologies and favouring metered/measured approaches. If your project relies on distribution records or optimistic usage assumptions without sensor or meter backing, expect deep discounting or rejection by high-integrity buyers. Conservative accounting and transparent evidence are not optional — they are business hygiene.

Common failure modes and countermeasures:

-Distribution ≠ use: countermeasure — conditional payments tied to verified use (SUMs/meter evidence).

-Double-counting with government programmes: countermeasure — explicit PDD documentation showing how your intervention goes beyond government provision (e.g., refill subsidies, maintenance, user training targeting refill behaviour).

-Sample bias and social desirability: countermeasure — objective sensors, independent enumerators, and careful sampling.

-Under-budgeting MRV & VVB costs: countermeasure — model verification cycles early and build VVB engagement into project timelines and budgets.


8. Operational blueprint: from procurement to verified credits

A carbon-grade cookstove programme is first and foremost an operational delivery challenge. Below is a sequence that reduces MRV friction and raises buyer confidence.

  1. Pilot and acceptability testing: test device fit for purpose (user ergonomics, fuel needs, cooking styles). Document pilot KPTs/CCTs and field user feedback.

  2. Procurement & performance certification: procure devices with lab performance certificates (WHO or Clean Cooking Alliance ratings). Retain test reports and device warranty info.

  3. Beneficiary registry and unique IDs: register beneficiaries with GPS, ID, device serial numbers, and signed consent forms. This registry is the backbone of traceability.

  4. Distribution + user training: ensure each household receives hands-on training. Capture attendance and photo proof.

  5. MRV deployment: deploy SUMs/metering devices on a validated sample and collect baseline purchase/consumption evidence. Keep raw files in a version-controlled repository.

  6. Post-distribution follow-up & maintenance: scheduled visits at 3, 6, 12 months with maintenance support. Use conditional incentive payments to encourage verified use.

  7. VVB engagement & pre-audit: bring in an independent verifier early to review MRV protocols and pilot data — this reduces rework at validation.

If any of these steps are skipped, you increase risk of audit friction and potential invalidation.


9. Budget reality check (be conservative)

Many projects misprice themselves by underestimating MRV and verification costs. A realistic split:

-Hardware & distribution: 40–55%

-Behaviour-change & after-sales: 10–20%

-Monitoring & MRV (incl. SUMs/metering): 10–25%

-VVB & verification cycles: 8–15%

-Programme management & contingency: 5–10%

If you trim MRV to save costs, you will likely lose more in discounts or failed validations. Build MRV and VVB costs into the unit economics up front.


10. Commercialisation: what buyers will and won’t pay for

Buyers have become pickier. What commands a premium:

-Conservative, sensor-backed ERs. Sensors/metering reduce uncertainty and attract quality buyers.

-Transparency & audit trails. Raw SUMs logs, sample survey files, and enumerator training records available on request.

-Co-benefit evidence. Documented health outcomes, time savings, and gendered benefits enhance buyer interest in impact-oriented portfolios.

-Additionality clarity. Show how the project adds beyond government programmes (e.g., refill affordability or exclusive-use incentives where PMUY provided hardware).

Buyers will discount or avoid projects that rely exclusively on distribution or surveys and cannot produce raw sensor/meter files.


11. Aggregation & programme-based registration: scale without losing discipline

Small projects are uneconomic if each carries full VVB costs. Aggregation (pooling multiple small interventions under a programme approach) makes sense — but governance is everything: who signs sales contracts, how are revenues split, and how is the MRV protocol consistently enforced across geographies? Registries support programmatic registration, but you must standardise PDD templates, a central MRV repository, and a single governance charter for subprojects. Do this well and you lower per-credit costs and increase buyer appetite.


12. Practical PDD/MRV wording (audit-ready samples)

Use these clauses to speed PDD drafting and reduce back-and-forth with verifiers.

Monitoring objective (sample)

“The project quantifies sustained adoption of Project stoves and fuel-switch behaviour using a mixed-method monitoring system combining Stove Use Monitor (SUMs) data from a stratified, representative sample, fuel purchase/refill records where available, and annual socio-economic household surveys. All raw SUMs logs, survey instruments and enumerator training materials are retained in the project MRV repository and made available to the VVB upon request.” Clean Cooking Alliance

Additionality rationale (sample)

“The project targets households that, despite receiving connection under national programs, demonstrate low refill frequency and high stove-stacking. By providing targeted refill affordability support, user training, and maintenance incentives that exceed government program provisions, the project increases sustained use of clean fuel — thereby producing measurable additional emission reductions.” (Cite PMUY coverage and refill trends.)

Use conservative factors and avoid optimistic extrapolations.


13. A compact Anaxee playbook — what to do next (practical & unapologetic)

If Anaxee wants to scale credible clean-cooking credits in India, focus on:

  1. Design for measurement: pick technologies and distribution models that support metering or reliable SUMs deployment. Meter when you can; use SUMs when you can’t.

  2. Solve refill economics: in PMUY contexts, the marginal gain is sustained refills. Design top-up/subsidy interventions tied to verified refill behaviour.

  3. Build a central MRV hub: centralise data ingestion, cleaning, and audit folders. Train enumerators thoroughly and maintain version-controlled raw data.

  4. Aggregate from day one: standardise PDD templates and MRV protocols so small cohorts can be pooled under a single program.

  5. Conservatism & transparency: err conservative in ex-ante estimates; publish methodological choices and make samples available to buyers.

Be brutal about quality control: it’s cheaper to do MRV properly than to defend inflated claims later.


14. Hypothetical pilot: a design you can replicate

Target cohort: 10,000 rural households across two districts with demonstrable low refill frequency.
Intervention: partial LPG refill subsidy for 12 months + intensive behaviour-change + SUMs on a 10% representative sample.
MRV plan: baseline SUMs + survey; SUMs redeployment at 6 and 12 months; monthly refill logs for the cohort from retail partners where feasible; independent verification at 12 and 24 months.
Commercial packaging: conservative ex-ante ERs, buyer quarterly reporting with access to anonymised SUMs sample, and a 5–10% buffer for programme risk.

This pilot balances costs and credibility and produces a buyer-friendly evidence package.


15. Buyer due diligence checklist (for corporates)

Before you sign a purchase agreement, demand:

-Raw SUMs files for representative monitoring windows and a sample of cleaned extracts.

-Clear additionality evidence against national/local programmes (e.g., PMUY stats and how the project adds to those).

-Benefit-sharing and grievance redress mechanism documentation.

-Sample verification report from a VVB and contactable references.

-Evidence of supply-chain sustainability if biomass/pellets are used.

If a developer can’t provide these, discount the credits or walk away.


16. Closing reality check (no marketing spin)

Clean cooking is high-impact and can produce high-integrity ERs — but only if project developers stop treating carbon income as a rebate on distribution costs. The market has shifted. Standards and buyers now reward measurement (metering and SUMs), conservatism, and transparency. Anaxee’s operational strengths — local field teams, dMRV capacity, and experience in community engagement — are exactly the assets needed to execute credible programs. But execution must prioritise MRV funding and discipline. Skimp on monitoring and you’ll pay later in auditor delays, discounts, or stripped credits.
Connect with us at sales@anaxee.com

Agroforestry that Pays: Practical Guide to High-Integrity Bund & Smallholder Plantation Projects (VM0047-ready)

Agroforestry that Pays: Practical Guide to High-Integrity Bund & Smallholder Plantation Projects (VM0047-ready)

Agroforestry isn’t a feel-good sidebar to climate policy — it’s one of the few Nature-based Solutions already proven to deliver measurable carbon removals while generating local income and soil resilience. But turning plots into verified carbon credits requires more than tree-planting zeal. The difference between a project that sells quality credits and one that stalls under validation is in the design, documentation, monitoring, and benefit-sharing structure. This is a practical, no-nonsense guide to designing VM0047-style agroforestry projects (including bund plantation models for smallholders), with a focus on how Anaxee’s implementation + MR capabilities translate theory into bankable credits.


1) Start here: pick the right intervention and scale

Agroforestry projects range from alley cropping and boundary planting to large afforestation parcels. For smallholder bund plantations (a common model in South Asia), the practical strengths are:

-Low entry costs and high social co-benefits (shade, fodder, fruit, erosion control).

-Easier parcel-level measurement when plots are small and ownership is clear.

-Clear integration with cropping calendars so farmer livelihoods are not disrupted.

But selection must be strategic. Ask: are parcels contiguous enough to use pooled sampling? Are land rights clear? Is there an existing extension network to deliver seedlings and training? The manual stresses early documentation of land tenure and legal evidence — do not skip this. Land title and carbon-asset ownership will be scrutinized during validation.


2) The PDD checklist: what validators want to see (and what developers routinely get wrong)

Anaxee team member preparing agroforestry saplings beside a PDD checklist graphic outlining key validation elements, pitfalls, and guidelines for high-integrity carbon projects.

Validation bodies and methodologies require precise, consistent documentation. The manual includes a practical PDD checklist — use it as your playbook. Key PDD elements that must be tight:

-Project overview: clear title, coordinates, developers, start date, and crediting period. Ambiguity here invites long review cycles.

-Eligibility & methodology: explicitly cite the chosen standard and justify methodology applicability (e.g., VM0047 for afforestation/reforestation/revegetation approaches). If using VM0047, demonstrate how your planting model maps to methodology definitions.

-Baseline and additionality: provide robust reasoning for why the activity wouldn’t occur in the absence of carbon revenue. For bund plantations on smallholder plots, baseline arguments must consider existing farmer incentives and local extension programmes.

-Leakage & permanence: identify local drivers of deforestation/land conversion and present leakage mitigation (e.g., buffer pools, landscape-level measures). Permanence risks must be quantified and addressed (insurance, buffer credits).

-Legal & benefit sharing: land title evidence, benefit sharing agreements, and FPIC/consultation records are not optional — they’re central to project integrity. Have contracts ready.

Two mistakes I see repeatedly: (1) sloppy, inconsistent numbers across tables/maps (double-check everything), and (2) treating the PDD like marketing copy. Keep it succinct and evidence-based. The manual explicitly recommends concise PDDs with tables/graphics for clarity.


3) Methodology and measurement choices (VM0047 in practical terms)

VM0047 (afforestation, reforestation and revegetation frameworks and similar approaches) is widely used for tree-planting projects because it provides clear rules on baseline setting, growth curves, carbon pools, and monitoring periods. Practical consequences for an Anaxee bund-plantation project:

-Carbon pools to include: Aboveground biomass is the primary pool; depending on methodology, belowground and soil may need treatment or exclusion. Be explicit in your PDD which pools are modelled and why.

-Ex-ante estimates: your model must be defensible — include growth curves, species parameters, and mortality assumptions. The manual highlights ex-ante vs ex-post treatment and warns that ex-ante estimates must be conservative and justified.

-Sampling design: smallholder mosaics typically require stratified sampling and a mix of remote sensing and plot inventories. Design sample sizes to meet verifier confidence levels — don’t downsize to save costs and then fail verification. The manual recommends combining field plots with remote sensing where possible.


4) Implementation: the operational reality (planting, survival, costs)

Planting is where theory meets human behaviour. Bund plantations need simple, farmer-friendly protocols:

-Species selection: prefer natives or locally proven fast-growing agroforestry species that deliver both carbon and livelihood benefits (fruit, fodder, fuelwood) — this helps uptake and survival.

-Nursery & seedling logistics: centralize seedling production to ensure quality and uniformity. Stagger planting windows to match monsoons and cropping cycles.

-Survival and maintenance: establish a 2–3 year maintenance plan with scheduled visits, fertilization (if applicable), and pest control. Mortality assumptions in the PDD must reflect on-ground survival plans.

-Costs and payment schedules: link farmer incentives to milestones (e.g., survival checks at 6, 12, 24 months). Upfront seedling provision with partial co-funding from farmers can reduce moral hazard but be designed sensitively.

Operational discipline reduces non-permanence risk, lowers verification disputes, and makes credits marketable.


5) Monitoring & MRV that survives scrutiny

Monitoring separates credible projects from wishful thinking. The manual gives practical guidance on what monitoring plans must contain: indicators, data sources, frequency, and protocols. Treat the monitoring plan as the operational manual for your VVB and auditor.

Core MRV components for bund/smallholder agroforestry:

-Carbon indicators: tree survival, DBH/height measurements (or appropriate proxies), species identification.

-Non-carbon indicators: land use change, crop yields, livelihood impacts, SDG co-benefits (useful for buyers who want co-benefit claims).

-Data sources: field plots (stratified), farmer logs, mobile data collection, and satellite imagery for change detection and leakage monitoring. The manual strongly recommends local partner training and simple digital collection tools to scale monitoring while controlling costs.

-Monitoring frequency: at minimum annual carbon monitoring for the first verification cycles; more frequent socio-economic monitoring is recommended in the early years. The manual’s PDD checklist flags the need for a monitoring protocol describing how data will be collected and analysed.

Practical MRV tips (Anaxee’s edge):

-Use mobile forms and GPS-tagged photos at each plot visit to make audits painless.

-Store raw data and derived metrics in a consistent directory structure and maintain a change log — verifiers hate ‘missing original data’. The manual stresses documenting all data sources and assumptions.


6) Social safeguards & benefit sharing — not a checkbox exercise

Carbon projects get audited for social safeguards now as rigorously as for carbon numbers. The manual lays out expected ESG materials: evidence of consultations, FPIC where applicable, gender inclusion, expected livelihood impacts, grievance redress mechanisms, and detailed benefit-sharing plans. These are required elements for registration and market acceptance.

A few hard truths:

-sharing needs simplicity: complicated formulas bury the true winners and frustrate communities. Flat rates tied to milestones or a clear split of monetized credit revenues are easier to administer and verify.

-FPIC & consultation records: keep minutes, sign-offs, and clear communication materials in local language. Document the process; photos and attendance lists help.

-Grievance redress: a named local contact and response timelines are minimum requirements. Auditors will probe whether the mechanism works in practice.


7) Commercialization: who buys these credits and at what price?

Nature-based credits are facing higher scrutiny; buyers want quality, traceability, and co-benefits. The manual’s commercialisation section highlights two practical points: sellers must do due diligence on buyers and price expectations must cover real project costs (including verification and buffer).

Market reality for smallholder agroforestry credits:

-Quality premium: well-documented projects with credible MRV and social safeguards command a premium.

-Blue vs green demand: buyers seeking removals and nature co-benefits prefer projects that demonstrate durable sequestration and strong social outcomes.

-Transaction costs: smaller projects face proportionally higher transaction costs — consider aggregation models (pooled projects under one PDD) to spread VVB and verification costs. The manual references pooling and mosaic approaches used in other NbS contexts.


8) Pitfalls and how to avoid them (real world)

I’ll be blunt: many agroforestry carbon projects fail verification on preventable grounds. Here’s what trips teams up and how to address it:

-Inconsistent documentation: numbers in the PDD, monitoring spreadsheets, and maps must match. Fix: a single source of truth (master spreadsheet + version control). The manual explicitly warns to “be consistent”.

-Under-budgeting verification & VVBs: VVB availability is constrained; engage early and build relationships. The manual suggests securing a VVB early in development.

-Weak local buy-in: if farmers see no short-term benefit, survival suffers. Fix: tie incentives to outcomes and offer clear livelihood co-benefits (fodder, fruit).

-Land tenure ambiguity: unresolved title disputes can derail validation. Fix: obtain documented evidence of land use rights or formal agreements.


9) Scaling strategy: aggregation, registries and programme design

If your ambition is scale, plan for aggregation from day one. The manual highlights landscape/mosaic approaches and suggests programmatic registration options where applicable. Aggregation reduces per-credit transaction costs and improves marketability, but requires rigorous governance (who signs sales contracts; how are revenues pooled?).

Practical structure for scaling:

  1. Standardized PDD template for all clusters.

  2. Centralized MRV hub (data cleaning, sampling oversight).

  3. Local field teams trained as Anaxee’s Digital Runners to collect evidence and resolve issues.

  4. Transparent benefit sharing rules embedded in project documents.


10) Why Anaxee’s implementation + MR strengths matter (short, candid assessment)

You asked me to be frank. Here are where an implementation/MR firm like Anaxee can actually change outcomes — or fail to, if poorly executed:

-Get the PDD right: Anaxee’s field footprint and experience with smallholder engagement reduce practical PDD failure modes (consistency, data quality). The manual stresses local engagement and documentation as credibility drivers.

-dMRV & local teams: training local enumerators and using mobile collection reduces verification time and cost. The manual recommends partnering with local institutions and training communities for monitoring.

-Commercial acumen: many NGOs can plant trees; fewer can package IP and MRV into sellable, audited credits. The manual’s commercialization checklist is a useful reference for negotiating buyer terms and conducting due diligence on buyers.

If Anaxee wants to lead, focus on: standardising PDD templates, building modular MRV stacks, creating clear farmer contracts, and developing a transparent accounting dashboard for buyers.


11) Tools & templates I recommend you publish (and use)

From the manual’s practical orientation, these are the templates that speed validation and increase buyer confidence:

-PDD checklist tailored to bund plantations (land title, sampling, survival assumptions).

-Monitoring protocol template (indicators, QA/QC steps, sampling frames).

-Benefit sharing agreement template (clear revenue split, grievance redress).

-VVB engagement checklist (language & regional capacity, cost expectations).

Publishing these (or portions) on Anaxee’s site as downloadable resources will help buyers and partners assess project maturity quickly.


12) Closing: a reality check for buyers & developers

If you’re a corporate buyer: insist on seeing the monitoring protocol, benefit-sharing agreements, and proof of land rights before committing. Don’t buy on glossy images alone.

If you’re a developer: never let fundraising timelines compress the validation process — rushed projects create stranded credits and reputational loss.

The Eastern-Africa manual we used as a reference is pragmatic: it shows the pathway from concept to commercialization and calls out the non-negotiables — legal proof, robust monitoring, conservative ex-ante estimates, and clear benefit sharing. Treat those as minimum viable ingredients; everything else is optional.


Want a PDD template or dMRV checklist tailored to your bund project? Contact Anaxee’s Implementation Team at sales@anaxee.com 


Field Worker Sapling nursery agroforestry carbon project in India
Anaxee team member inspecting sapling nursery for carbon-grade TOF plantation under afforestation project in India

Tech for Climate: The Future of Transparent, Scalable, and Inclusive Carbon Projects

Introduction: From Pilot Projects to National Climate Infrastructure

The voluntary carbon market (VCM) is maturing — and the next phase won’t be defined by token projects, but by infrastructure.
While methodologies like ARR, Biochar, and Green Credits provide scientific structure, implementation remains the missing link.

That’s where Anaxee’s Tech for Climate platform steps in — bridging the gap between policy design and ground reality.

For the past decade, Anaxee has built India’s largest last-mile digital network across 26 states. Today, that same infrastructure — once used for data collection and rural outreach — is being retooled for climate project implementation, MRV (Monitoring, Reporting, and Verification), and community engagement.

In short: Anaxee is building the operating system for India’s carbon future.


1. The Tech for Climate Framework

Anaxee’s Tech for Climate ecosystem works across three integrated layers

LayerFunctionDescription
1. Field Execution LayerDigital Runners Network
On-ground trained personnel for plantation verification, soil data, and farmer coordination.
2. Data & Tech LayerAI + dMRV Tools
Mobile apps, satellite analytics, and automated dashboards enabling data-driven verification.
3. Governance & Transparency LayerBlockchain-backed Auditing
Immutable data logs, carbon registry sync, and real-time validation for corporates and verifiers.

Together, these layers create an end-to-end tech stack for climate transparency — something India’s carbon market desperately needs.


2. Scaling Carbon Projects Beyond Pilots

Most carbon programs fail to scale because they are designed as isolated pilots.
Anaxee flips the model: instead of building projects from scratch, it plugs tech into existing community ecosystems — farmer networks, FPOs, CSR partners, and local NGOs.

This approach accelerates three outcomes:

-Speed: Rapid census-based farmer enrollment through verified local agents.

-Accuracy: Continuous photo and geo-verification using Anaxee’s dMRV tools.

-Trust: Immutable digital proof of every planted, verified, and monitored tree or intervention.

By 2025, Anaxee’s Tech for Climate framework has already operationalized hundreds of smallholder-driven plantations under the VM0047 methodology — one of the world’s most rigorous ARR standards.


3. The Digital MRV Revolution

Traditional MRV relies on seasonal audits and static Excel sheets — slow, opaque, and prone to errors.

Digital MRV (dMRV) changes everything.
Through IoT devices, mobile apps, and AI-assisted satellite monitoring, every carbon asset (tree, biochar pit, or field plot) can now be tracked continuously.

Anaxee’s MRV Architecture:

  1. Data Collection – Digital Runners collect geo-tagged images and field parameters.

  2. Satellite Integration – Multispectral imagery validates land-use changes.

  3. AI Analytics – Detects anomalies, growth rates, and biomass shifts.

  4. Dashboard Reporting – Stakeholders view live progress metrics.

  5. Verification Module – Blockchain-secured logs ensure audit-proof records.

This architecture is not just about compliance — it’s about building credibility in the carbon economy.


4. AI + Blockchain = Next-Gen Transparency

The intersection of AI and Blockchain will define the next decade of carbon markets.

-AI enhances data accuracy, analyzing thousands of field images for canopy density or soil reflectance.

-Blockchain guarantees data integrity, preventing tampering across the MRV chain.

Anaxee’s systems integrate both — where every data point (like a farmer’s plot verification) is AI-validated and then hashed onto a blockchain ledger, ensuring that no field record can be falsified post-verification.

This dual tech stack turns climate claims into verifiable evidence, not narratives.


5. Communities as Carbon Partners, Not Beneficiaries

Unlike many top-down climate projects, Anaxee’s design centers around people-first implementation.

Through the Digital Runners network, Anaxee empowers local youth — especially women — to become the execution core of climate action.

These individuals are not volunteers; they’re trained data agents, compensated for verified outcomes — bridging livelihoods and climate service delivery.

Community Impacts:

-Employment: Thousands of local field workers gain income through data and plantation work.

-Trust: Continuous presence ensures long-term engagement.

-Equity: Women-led rural clusters are prioritized in training and leadership.

This is climate justice in practice — not through rhetoric, but through systems design.


6. Co-Benefits: The Real Measure of Impact

Carbon sequestration is just one metric. The true value lies in co-benefits — the social, environmental, and economic dividends that follow.

Type Example Impact
Social Local youth employment Builds rural digital capacity
Environmental Soil fertility, biodiversity recovery Strengthens ecosystems
Economic Carbon income + reduced input cost Boosts smallholder resilience

Anaxee integrates these co-benefits into every stage of project planning — and documents them through its digital dashboards, turning qualitative impact into quantifiable data.


7. Methodology + Technology = Credible Carbon
Tech For Climate, dMRV tool

Methodology defines “what” to measure; technology defines “how” to measure it.
Anaxee’s climate stack ensures both dimensions move in sync.

-For ARR Projects: Census-based monitoring ensures each tree is accounted for under VM0047.

-For Biochar Projects: Process-level data validates carbon permanence and additionality.

-For Soil Carbon / Green Credit Programs: Layered field verification aligns with MoEFCC standards.

By embedding MRV tech into every methodology, Anaxee ensures that every credit issued is backed by durable, traceable evidence.


8. Building Trust in India’s Climate Economy

The credibility crisis in voluntary markets — inflated baselines, unverifiable removals — has made investors wary.
Transparency is now the new currency.

Anaxee’s Tech for Climate dashboard offers stakeholders — corporates, auditors, investors — live access to on-ground data.
They can see:

-Total verified area (geo-mapped)

-Project stage and survival rate

-Farmer participation levels

-AI anomaly reports

This visibility layer restores trust, reduces due diligence costs, and enhances investor confidence.


9. India’s Advantage: Scale + Diversity + Digital Reach

India’s rural fabric — millions of small farms, high smartphone penetration, and active government schemes — makes it the perfect geography for carbon scaling.

Anaxee’s strength lies in leveraging this structure:

-26-state presence

-125+ internal climate professionals

-Thousands of Digital Runners on the ground

-Decade-long data and logistics experience

This makes Anaxee uniquely positioned to operationalize India’s climate transition, not just theorize it.


10. The Road Ahead: From Projects to Platform

The next frontier is interoperability — where carbon, water, biodiversity, and social credits integrate into multi-benefit registries.

Anaxee’s Climate Command Centre will anchor this evolution:

-Integrating AI + IoT + Remote Sensing

-Enabling multi-asset verification (not just CO₂)

-Partnering with corporates, registries, and governments for scalable implementation

The vision:

To make every environmental claim verifiable, every credit traceable, and every farmer visible.


Conclusion: Tech for Climate Is India’s New Development Engine

India doesn’t need to copy Western carbon models.
It needs an execution-first, tech-integrated, community-owned system — and that’s exactly what Anaxee is building.

From biochar pits in Madhya Pradesh to bund plantations in Rajasthan, from AI dashboards in Indore to digital runners in remote villages,
the goal is singular:

To make climate action measurable, inclusive, and profitable for everyone involved.

Anaxee’s Tech for Climate is not just a slogan — it’s India’s climate execution architecture in motion. Connect with us at sales@anaxee.com 

Anaxee representative capturing mobile data in a dense eucalyptus plantation, reflecting biodiversity and ecosystem restoration efforts aligned with nature-based carbon solutions.

Community and Co-Benefits: The Human Side of Carbon Projects

Community and Co-Benefits: The Human Side of Carbon Projects
By Anaxee Digital Runners Pvt. Ltd | India’s Reach Engine for Climate Action

Introduction: Beyond Carbon Accounting

When we talk about carbon projects, conversations often revolve around “tonnes of CO₂ removed” or “verified carbon units (VCUs).” But there’s a deeper story often overlooked — the human side of climate action.

Every tree planted, every biochar pit built, every acre of restored land has human hands behind it. For communities living at the frontlines of climate change, carbon projects are not just about reducing emissions — they’re about restoring dignity, livelihoods, and hope.

The future of the carbon market is not only digital but also deeply social. Projects that ignore people fail; those that empower them endure. This is the essence of co-benefits — the additional social, environmental, and economic gains that arise from well-designed carbon projects.

At Anaxee Digital Runners, we see this human dimension as the core of credible climate action. Through our network of local runners, digital MRV systems, and community engagement programs, we ensure that climate solutions don’t just count carbon — they change lives.


Understanding Co-Benefits in Carbon Markets

What Are Co-Benefits?
Anaxee’s rural community meeting illustrating the three co-benefits of carbon projects: social empowerment, economic inclusion, and environmental restoration.

In carbon markets, “co-benefits” refer to the positive side effects that go beyond carbon sequestration. These include:

-Improved livelihoods and income diversification

-Better soil fertility and water retention

-Biodiversity enhancement and ecosystem health

-Women’s participation and empowerment

-Community resilience to droughts and floods

A project that delivers co-benefits generates not just climate impact but social capital. International standards such as Verra’s SD VISta and Gold Standard for the Global Goals explicitly measure and verify these benefits using the UN Sustainable Development Goals (SDGs) framework.

For instance, a reforestation project might contribute to:

-SDG 13: Climate Action

-SDG 15: Life on Land

-SDG 5: Gender Equality

-SDG 8: Decent Work and Economic Growth

These multidimensional outcomes make a project more attractive to investors and credit buyers seeking both carbon integrity and social responsibility.


Why Communities Matter in Climate Projects

1. Local Ownership Builds Permanence

A carbon project’s long-term success depends on whether the community owns it. If villagers see plantations or interventions as “external projects,” they won’t maintain them once incentives stop. But when they see personal and collective value — improved soil, extra income, or shade in the fields — participation becomes intrinsic.

That’s why Anaxee integrates community co-creation from day one. Each intervention — from species selection to land allocation — happens through dialogue, not imposition.

2. Trust Prevents Leakage

“Leakage” — when emissions simply move from one place to another — is a major risk in carbon accounting. Community involvement reduces this by aligning incentives. Local monitoring teams help track, protect, and report project integrity.

3. Social Resilience Multiplies Environmental Impact

A resilient community — economically and socially — is more likely to sustain ecological outcomes. When local people earn from restoration work or climate-smart agriculture, they become long-term custodians of the landscape.


Anaxee’s Community-First Implementation Model

Anaxee’s community engagement model showing local women participating in sustainable carbon project discussions under village settings.

Anaxee’s model merges technology + trust + last-mile presence to deliver large-scale, verifiable, and inclusive carbon projects across rural India.

1. Digital Runners: India’s Last-Mile Climate Workforce

Our 45,000+ trained Digital Runners form the foundation of our climate operations. These are local youth and micro-entrepreneurs equipped with smartphones and digital tools to collect real-time data on:

-Tree survival and growth

-Soil and biodiversity indicators

-Farmer participation and satisfaction

-Gender and livelihood metrics

This approach decentralizes monitoring and ensures that every data point — every tree, every farm — is community-verified.

2. Participatory Design

Each project starts with local consultations. Farmers, Panchayats, and SHGs (Self-Help Groups) jointly design the intervention. This ensures social acceptability and environmental relevance.

3. Livelihood Integration

Carbon projects under Anaxee are designed to create co-benefits by default:

-Agroforestry bund plantations improve farm yield and biodiversity.

-Biochar and soil amendment initiatives generate extra income.

-Women-led nurseries enhance inclusion and reduce migration.

In short, every Anaxee project doubles as a rural development program — powered by technology, verified by data, and owned by people.


Measuring Co-Benefits: The dMRV Approach

Traditional monitoring systems could capture only carbon metrics — not the “softer” social or ecological dimensions. That’s where Anaxee’s digital MRV (dMRV) framework transforms the game.

1. Beyond Carbon Data

Our system integrates satellite imagery, IoT devices, and community-level surveys to monitor:

-Household income changes

-Gender participation ratios

-Water and biodiversity indicators

-Local employment generation

2. Real-Time Dashboards

All project data flows into a centralized dashboard, accessible to partners, verifiers, and investors. This ensures complete transparency from ground to registry.

3. Blockchain and Traceability

We are piloting blockchain-based data locks to make every verification tamper-proof — building trust among buyers and ensuring that community impacts are both measurable and immutable.

This approach aligns perfectly with emerging frameworks under Verra’s SD VISta, UNFCCC Local Stakeholder Consultations, and Indian CCTS (Carbon Credit Trading Scheme) requirements for transparency.


Case Example: From Tree to Transformation

In 2024, Anaxee initiated a large-scale Agroforestry Bund Plantation Program across multiple states including Madhya Pradesh, Chhattisgarh, and Maharashtra — directly engaging over 20,000 smallholder farmers.

Key Results (as of mid-2025):

-🌱 2.4 million trees planted across bunds and degraded lands.

-👩‍🌾 30% women participation in nurseries and monitoring roles.

-💰 Average annual income increase: ₹9,000 per farmer through carbon-linked incentives and fruit yields.

-💧 12% higher soil moisture retention in participating villages.

-🌾 Zero deforestation observed in surrounding areas.

These numbers represent more than project statistics — they are markers of social transformation driven by climate finance.


How Co-Benefits Create Real Climate Value

1. Verified Impact = Premium Carbon Credit

Carbon buyers increasingly demand “high-integrity credits.” Projects that deliver community and environmental co-benefits command 10–30% higher prices in voluntary markets.

Why? Because corporates want measurable, reportable social outcomes that align with ESG and SDG disclosures.

2. Co-Benefits Drive Buyer Confidence

When investors can see who benefited, how much income was generated, and what local resilience was built, the credit becomes more than an offset — it becomes a story of impact.

Anaxee’s transparent dMRV system provides exactly that level of proof.

3. Long-Term Viability

Projects with social foundations last longer. Communities maintain tree cover, protect assets, and ensure continuous carbon sequestration even after the initial project term.


The Future: Tech + Trust + People

The next evolution of carbon projects lies in integrated intelligence — combining social data with AI, IoT, and blockchain-backed verification.

Anaxee is already advancing this frontier through:

-AI-driven MRV: Automated detection of canopy growth, survival, and community engagement.

-Geo-referenced dashboards: Linking social benefits to specific geographic plots.

-Data interoperability: Ensuring compatibility with registries like Verra, Gold Standard, and India’s CCTS.

But no matter how advanced the technology becomes, one truth remains: trust must start at the grassroots.
A well-designed climate project is not built for communities — it is built with them.


Anaxee’s Human-Centric Climate Vision

1. Digital Empowerment

By training rural youth as Digital Runners, Anaxee transforms India’s demographic dividend into a climate workforce. Each runner becomes a data collector, verifier, and local change agent.

2. Gender Inclusion

Women are at the heart of project sustainability. From nursery operations to digital monitoring, Anaxee’s projects aim for at least 35–40% women participation — ensuring gender equity and local leadership.

3. Shared Value

Our community benefit-sharing model ensures that a portion of carbon revenue cycles back to participating farmers and local institutions.
This fosters long-term stewardship, not one-time participation.


Conclusion: Climate Action Must Be Human-Centered

Carbon credits might be the currency of climate action — but communities are the economy that sustains it.

A credible carbon project doesn’t just measure how much carbon is removed from the atmosphere; it measures how many lives are improved on the ground.

By integrating co-benefits into design, monitoring, and reporting, Anaxee ensures that every tonne of CO₂ sequestered represents a real, durable, and just climate impact.

As India scales its climate ambitions through the Carbon Credit Trading Scheme (CCTS) and Green Credit Program, community-based, technology-driven models like Anaxee’s will define the future of climate implementation integrity.

In short —
Carbon may be the metric. People are the purpose.


About Anaxee:
Anaxee drives large-scale, country-wide Climate and Carbon Credit projects across India. We specialize in Nature-Based Solutions (NbS) and community-driven initiatives, providing the technology and on-ground network needed to execute, monitor, and ensure transparency in projects like agroforestry, regenerative agriculture, improved cookstoves, solar devices, water filters and more. Our systems are designed to maintain integrity and verifiable impact in carbon methodologies.

Beyond climate, Anaxee is India’s Reach Engine- building the nation’s largest last-mile outreach network of 100,000 Digital Runners (shared, tech-enabled field force). We help corporates, agri-focused companies, and social organizations scale to rural and semi-urban India by executing projects in 26 states, 540+ districts, and 11,000+ pin codes, ensuring both scale and 100% transparency in last-mile operations. Connect with Anaxee at sales@anaxee.com

Nature based Project Execution in India

Digital MRV and Data Transparency: The Backbone of Credible Carbon Projects

Introduction: The Trust Problem in Carbon Markets

The carbon market is built on a simple promise — one credit equals one tonne of CO₂ reduced or removed. Yet, this promise is only as strong as the systems that measure and verify it.
For years, carbon projects have relied on manual reporting, infrequent audits, and fragmented data systems — a setup vulnerable to inconsistencies and human error.

Enter Digital MRV (Measurement, Reporting, and Verification) — a revolution in how we track climate outcomes. Digital MRV uses sensors, satellite data, AI models, and field-level verification tools to build a transparent, traceable record of carbon performance.

For Anaxee, MRV isn’t just compliance — it’s the foundation of credibility.


What is MRV — and Why It Matters
Introductory infographic explaining Digital MRV — Measurement, Reporting, and Verification — with icons for satellite sensing, mobile data, and blockchain verification.

Measurement determines what’s happening on the ground.
Reporting communicates those findings in a structured, standardized way.
Verification ensures that an independent, trusted system confirms those claims.

MRV systems bridge the gap between science and policy — between the carbon stored in a forest or soil, and the value that can be traded in global markets. Without accurate MRV, carbon markets collapse under uncertainty.

Traditionally, MRV relied on sporadic manual sampling and project developer declarations. But in the age of precision data and digital infrastructure, manual MRV is no longer enough.


The Rise of Digital MRV (dMRV)

Digital MRV — or dMRV — introduces automation, data integration, and real-time validation into carbon accounting.
Here’s how it transforms each layer:

  1. Measurement:

    • Satellite imagery, LiDAR, and remote sensors collect spatial and temporal data.

    • Mobile data collection by field agents (Anaxee’s Digital Runners) ensures on-ground reality matches satellite records.

  2. Reporting:

    • Standardized data formats (API-based) reduce subjectivity.

    • Automated data flows feed into dashboards that are auditable and tamper-proof.

  3. Verification:

    • Smart contracts, timestamping, and blockchain-backed verification ensure every tonne of CO₂ claimed has traceable evidence.

The result is a system that replaces assumption with evidence, and trust with transparency.
Infographic showing four pillars of trust in digital MRV — transparency, real-time monitoring, accuracy, and data integrity — with green icons and Anaxee branding.


Anaxee’s Role in Building India’s Digital MRV Ecosystem

Anaxee’s dMRV model combines three pillars: Tech, People, and Scale.

1. Tech: Smart Tools for Real-Time Verification

Anaxee’s digital infrastructure integrates:

-Geo-tagged plantation data

-AI-based growth assessment models

-Automated image recognition for species verification

-Mobile-based field apps for instant data uploads

Every data point is time-stamped, geolocated, and cross-verified — meaning no credit can exist without proof.

2. People: The Digital Runners Network

With over 40,000 Digital Runners across India, Anaxee ensures that data verification isn’t a one-time exercise — it’s continuous.
Each runner collects photo, GPS, and survey data that feed directly into Anaxee’s central MRV dashboards.

3. Scale: National Coverage, Local Precision

Anaxee’s tech stack enables high-resolution monitoring at scale — whether in agroforestry belts of Madhya Pradesh or mangrove corridors of Odisha.
This scalability is what makes dMRV the only viable path for credible national carbon implementation.

Infographic displaying Anaxee’s MRV Architecture — Data Collection, Satellite Integration, AI Analytics, Dashboard Reporting, and Verification — with connected icons and Anaxee branding.


Why Transparency is the New Currency of Credibility

In a market flooded with new methodologies and voluntary claims, transparency is the only safeguard against greenwashing.
Investors, buyers, and regulators increasingly demand publicly accessible project data — not just glossy reports.

Anaxee’s approach:

-All project data (bound by consent and security) is traceable in structured formats.

-Periodic field photos and satellite maps are integrated into dashboards.

-MRV processes are independently auditable, ensuring external validation.

This level of transparency not only builds investor trust but also empowers communities and government stakeholders to see progress in real time.


The Role of dMRV in Indian Carbon Policy

India’s emerging Carbon Credit Trading Scheme (CCTS) underlines a national shift toward robust emissions monitoring.
Under this framework, digital MRV will be the baseline for all accredited carbon assets — whether from industrial efficiency or nature-based solutions.

Anaxee’s dMRV aligns with this national vision, offering:

-Policy-grade data integrity

-Open reporting formats

-Integration with Verra and Gold Standard protocols

As India prepares for a compliance-driven carbon market, Anaxee’s system bridges local projects with global standards.


Use Case: Agroforestry Verification through dMRV

Consider a 10,000-hectare agroforestry project under Verra’s VM0047 methodology.

Traditional MRV would:

-Require months of field audits.

-Depend on manual records.

-Risk errors due to data loss or inconsistent reporting.

With Anaxee’s dMRV:

-Farmers upload geo-tagged photos via mobile apps.

-Growth models estimate biomass dynamically.

-Field runners validate data through the Anaxee Reach Engine.

-The system generates automated verification reports ready for registry submission.

What once took six months now takes weeks — with 100% traceable data trails.


Challenges in MRV Digitization — and How Anaxee Solves Them

Challenge Traditional Limitation Anaxee’s Solution
Data Fragmentation Disconnected sources (manual, satellite, survey) Unified MRV data lake with API integration
Verification Lag Long field-to-report cycles Real-time uploads and dashboards
Lack of Trust Opaque systems Public audit trails and transparent data
Cost High audit costs Distributed verification via local Runners

Anaxee’s MRV Architecture — A Hybrid Human + Tech Model

Unlike fully automated systems that ignore local realities, Anaxee’s model blends:

-Remote sensing precision with

-Community-based ground truthing.

Each Digital Runner is not just a data collector — they are an agent of verification.
This ensures that technology remains rooted in human context, especially in smallholder-based projects where nuance matters.


dMRV and the Future of Carbon Quality Ratings

As carbon markets mature, buyers are increasingly relying on third-party rating agencies that assess credit quality based on criteria like:

-Permanence

-Additionality

-Leakage

-MRV quality

In these frameworks, MRV quality carries the highest weight.
A project with transparent dMRV can command 20–40% higher market value due to lower verification risk.

This is why Anaxee positions dMRV not as a compliance cost — but as a value driver in every carbon transaction.


Global Comparisons: What India Can Learn

While global registries like Verra, Gold Standard, and Puro.Earth are digitizing rapidly, India’s strength lies in distributed field networks and low-cost tech deployment.
Anaxee combines both — pairing India’s human infrastructure with tech-enabled validation.

This hybrid model ensures India’s projects don’t just meet global verification standards — they set new benchmarks in accessibility, speed, and cost efficiency.


The Road Ahead: Integrating dMRV with AI and Blockchain

Anaxee’s R&D teams are advancing MRV into the next frontier:

-AI-based anomaly detection: Flagging inconsistent field data automatically.

-Blockchain timestamping: Immutable verification of carbon data transactions.

-Predictive modeling: Forecasting carbon gains under different land-use scenarios.

These systems will evolve the MRV process from reactive validation to proactive assurance — anticipating issues before they arise.


Why dMRV is a Game Changer for Climate Finance

Transparent data doesn’t just verify — it unlocks capital.
Financial institutions, ESG funds, and corporates are more likely to invest when they can see measurable impact rather than promises.

Anaxee’s dashboards provide exactly that — a living, breathing view of carbon impact across time and space.

By bridging measurement with meaning, Anaxee’s dMRV systems are building the trust infrastructure for India’s carbon future.


Conclusion: Trust Is the True Currency of Climate Action

Digital MRV isn’t just about data; it’s about accountability.
In a market where credibility defines value, only transparent systems can sustain investor confidence and ensure communities are rewarded fairly for their climate contributions.

Anaxee’s dMRV framework doesn’t just monitor carbon — it builds the backbone of trust that the global carbon market desperately needs.
From soil to satellite, every data point counts — and Anaxee makes sure it’s counted right.


Summary Snapshot

Aspect Traditional MRV Anaxee’s dMRV
Data Collection Manual & fragmented Geo-tagged & automated
Verification Delayed, costly Real-time, field-synced
Transparency Limited Public, dashboard-based
Community Role Minimal Active participation
Value to Buyer Moderate High due to data trust

Final Thought

The future of carbon markets belongs to those who can prove, not just promise.
And with its Digital Runners and AI-driven MRV systems, Anaxee is ensuring every tonne of carbon truly counts.


About Anaxee:

 Anaxee drives/develops large-scale, country-wide Climate and Carbon Credit projects across India. We specialize in Nature-Based Solutions (NbS) and community-driven initiatives, providing the technology and on-ground network needed to execute, monitor, and ensure transparency in projects like agroforestry, regenerative agriculture, improved cookstoves, solar devices, water filters and more. Our systems are designed to maintain integrity and verifiable impact in carbon methodologies.

Beyond climate, Anaxee is India’s Reach Engine- building the nation’s largest last-mile outreach network of 100,000 Digital Runners (shared, tech-enabled field force). We help corporates, agri-focused companies, and social organizations scale to rural and semi-urban India by executing projects in 26 states, 540+ districts, and 11,000+ pin codes, ensuring both scale and 100% transparency in last-mile operations. Connect with Anaxee at sales@anaxee.com 


Field Worker Sapling nursery agroforestry carbon project in India

Permanence and Additionality: What Makes a Carbon Credit Truly Real?

Introduction: The Quality Question in Carbon Markets

Not all carbon credits are equal — and not all carbon removals are real.

As the carbon market expands, credibility has become its biggest challenge. The questions buyers, regulators, and even farmers are asking are simple but critical:

-Is this carbon removal permanent?

-Would this have happened anyway?

These questions lead us to the two most important concepts in the carbon world: Permanence and Additionality.

Without them, a carbon credit is just an accounting illusion.
With them, it becomes a verified environmental impact — a tonne of carbon genuinely removed or avoided.

The 2025 Criteria for High-Quality Carbon Dioxide Removal (CDR) identifies these two as non-negotiable pillars of carbon integrity.

Anaxee, through its digital-first, ground-executed model, ensures that every carbon project — whether afforestation, soil carbon, or biochar — meets these principles with measurable, traceable proof.


Understanding the Core: Permanence and Additionality

Let’s start with what these terms really mean, beyond the policy jargon.


1. Permanence: Will the Carbon Stay Locked Away?
Infographic titled “What is Permanence?” explaining how long carbon remains stored in projects like forests or biochar, with icons for time, tree, and verification.

Definition:
Permanence refers to the duration for which carbon remains removed from the atmosphere.

If a tree stores carbon today but burns in 10 years, that carbon goes right back — the removal is temporary.
If a tonne of CO₂ is stored as biochar or in stable soil carbon for 100–1000 years, that’s durable carbon removal.

In short, permanence asks:

“How long will this tonne of carbon actually stay out of the atmosphere?”

Typical Permanence Ranges by Project Type:

Project Type Typical Duration Permanence Risk
Afforestation / Reforestation (ARR) 30–100 years
Moderate (fire, disease, land-use change)
Soil Carbon 10–100 years Moderate (tillage, erosion)
Biochar / Mineralization 100–1000+ years Low
Direct Air Capture (DAC) 1000+ years Very Low

Projects with low reversal risks and robust monitoring score higher on permanence — and therefore generate higher-value carbon credits.


2. Additionality: Would It Have Happened Anyway?

Definition:
Additionality means the project results in emission reductions or removals that wouldn’t have occurred without carbon finance.

If a farmer plants trees only because a carbon project supports them — that’s additional.
If a company was going to switch to renewables regardless — that’s not additional.

It’s about causality.

“Would this action have taken place without the incentive of carbon revenue?”

High Additionality = Real Climate Impact.


3. Why Both Matter

A carbon credit that isn’t additional is fake impact.
A credit that isn’t permanent is short-lived impact.
Only when both align do we get genuine, measurable, and lasting climate action.


The Problem: Greenwashing through Weak Permanence & False Additionality

Many early carbon projects — especially in forestry and avoidance categories — overpromised and underdelivered.
Examples include:

-Forest projects that were later cut down or burned.

-Landfill gas projects claiming credits for activities already mandated by law.

-Soil carbon claims without credible measurement or baselines.

These failures eroded market trust — prompting buyers and rating agencies (like BeZero and Sylvera) to emphasize permanence and additionality scores.

The outcome:
High-quality credits are no longer about volume — but about verifiable, durable impact.


How Permanence Is Ensured

Permanence depends on how we store carbon and monitor it over time.

1. Buffer Pools and Insurance Mechanisms

Most registries (like Verra, Gold Standard, and Puro.Earth) require projects to deposit a percentage of credits into a buffer pool — a form of insurance in case stored carbon is reversed (e.g., fire, storm, etc.).

2. Long-Term Land Tenure and Legal Safeguards

Projects must ensure land rights, agreements, and protection mechanisms over decades.
This is particularly important in community projects where tenure can shift.

3. dMRV and Ongoing Monitoring

Digital Monitoring, Reporting, and Verification (dMRV) — a key Anaxee innovation — ensures permanence isn’t just promised, but continuously verified.

Anaxee’s dMRV includes:

-Satellite-based land-use monitoring

-Geotagged on-ground surveys

-Automated alerts for land-use change or degradation

-Periodic verification dashboards

This creates a living record of permanence, not just a one-time audit.


How Additionality Is Proven

Additionality isn’t theoretical — it must be demonstrated with evidence.

Carbon standards evaluate this through three major tests:

Test Description Example
Financial Test The project is not viable without carbon finance. A smallholder farmer only plants trees because carbon revenue covers input costs.
Regulatory Test The activity isn’t legally required. India’s Green Credit Program cannot be counted as additional if mandatory.
Common Practice Test The project activity isn’t already widely adopted. Agroforestry in a new dryland region vs. existing government plantations.

Anaxee ensures additionality through baseline data collection, local socioeconomic surveys, and verifiable financial models that demonstrate carbon revenue as a key enabler.


The Anaxee Approach: Making Permanence and Additionality Measurable

1. Tech-Driven Baseline Creation

Before project start, Anaxee collects data on land cover, biomass, and farmer income levels.
This becomes the baseline for proving additionality and tracking change.

2. Continuous Digital MRV

Unlike traditional MRV (one-time field verification), Anaxee’s dMRV continuously captures:

-Tree survival and canopy cover (via remote sensing)

-Soil organic carbon trends (via sample-linked mapping)

-Farmer adoption patterns and incentive dependency

This real-time visibility ensures both permanence and additionality are auditable.

3. Human Network for Ground Validation

Anaxee’s Digital Runners Network — a unique on-ground workforce across rural India — provides hyper-local verification.
They collect evidence, interviews, and geotagged photos to validate real community engagement and prevent “paper projects.”

Infographic showing four pillars of community engagement in carbon projects — local participation, partnerships, incentives, and long-term impact — with Anaxee branding.
4. Long-Term Project Stewardship

Most developers exit post-crediting. Anaxee stays.
Its model includes long-term monitoring contracts and community revenue-sharing mechanisms — creating incentives for project durability.


Case Study: Comparing Two Carbon Credit Pathways

Parameter Traditional Tree Plantation Anaxee’s ARR / Biochar Project
Permanence Moderate (30–50 years, risk of reversal) High (100+ years for biochar, digitally monitored)
Additionality Low–Medium (government overlap) High (private financing, voluntary participation)
Monitoring Manual, periodic Continuous digital + satellite
Co-benefits Limited tracking Documented: income, soil health, resilience
Buyer Confidence Medium High (data-backed transparency)

This contrast explains why Anaxee’s projects consistently meet high-quality carbon standards and appeal to global buyers seeking verified permanence.


The Policy Context: India and Global Markets

In India:

The upcoming Carbon Credit Trading Scheme (CCTS) under the Bureau of Energy Efficiency (BEE) will classify credits based on quality.
“Durable” and “additional” projects — like biochar, soil carbon, and long-term ARR — are likely to attract premium demand.

Globally:

Initiatives like the Integrity Council for Voluntary Carbon Markets (IC-VCM) and Carbon Credit Quality Initiative (CCQI) are codifying permanence and additionality into rating frameworks.

In this landscape, Anaxee’s data-verified permanence gives Indian credits global credibility.

Infographic titled “The Value of High Quality of Carbon Credit” showing icons for credibility, market value, positive impact, and verification, over a natural landscape background.


Anaxee’s Permanence Tools

Component Function Outcome
dMRV System Tracks land, biomass, and soil changes via app + satellite Transparent data trail
Digital Runners Local monitoring and feedback loops Human verification layer
Climate Command Centre Centralized analytics dashboard Data integrity and early alerts
Community Contracts Shared revenue and maintenance clauses Ensures ongoing stewardship

Anaxee essentially operationalizes permanence — turning what was once a “paper claim” into data-backed continuity.


Why Permanence & Additionality Are the Future of Carbon Markets

1. Buyers Are Paying for Quality

The premium in today’s carbon market is not for tree counts, but for certainty and proof.
Durable, additional projects command 3–10x higher prices.

2. Rating Agencies Demand Evidence

Projects without measurable permanence or clear additionality are being downrated or delisted.

3. Regulatory Shifts

As India formalizes its carbon registry, “high-quality” projects will likely receive faster approvals and compliance eligibility.


The Anaxee Value Proposition

Anaxee is building the infrastructure of credibility in India’s carbon market.
Its unique combination of technology, traceability, and human verification ensures every credit sold is:

Real (Additional)
Lasting (Permanent)
Transparent (Digitally Verified)

Through its Tech for Climate model — powered by a 125+ member internal team and 40,000+ Digital Runners — Anaxee can implement and monitor carbon projects at unprecedented scale and reliability.

Whether it’s soil carbon, biochar, or ARR, permanence and additionality are not theoretical promises — they are measured outcomes.


Conclusion: Trust Is Built on Permanence

Carbon credits without permanence and additionality are hollow promises.
The world is demanding proof — not pledges.

By embedding long-term durability and verifiable additionality into every project, Anaxee is redefining what a “high-quality carbon credit” means in the Indian context.

In a market moving from offsetting to authentic removal, permanence isn’t just a metric — it’s the foundation of trust.


About Anaxee:

 Anaxee drives/develops large-scale, country-wide Climate and Carbon Credit projects across India. We specialize in Nature-Based Solutions (NbS) and community-driven initiatives, providing the technology and on-ground network needed to execute, monitor, and ensure transparency in projects like agroforestry, regenerative agriculture, improved cookstoves, solar devices, water filters and more. Our systems are designed to maintain integrity and verifiable impact in carbon methodologies.

Beyond climate, Anaxee is India’s Reach Engine- building the nation’s largest last-mile outreach network of 100,000 Digital Runners (shared, tech-enabled field force). We help corporates, agri-focused companies, and social organizations scale to rural and semi-urban India by executing projects in 26 states, 540+ districts, and 11,000+ pin codes, ensuring both scale and 100% transparency in last-mile operations. Connect with Anaxee at sales@anaxee.com 

Four Anaxee Digital Runners in branded vests walk down busy market street to map retailers

Biochar and Soil Amendments in India: Durable Carbon Storage for Sustainable Agriculture

Introduction: Beyond Short-Term Carbon

The world’s carbon removal efforts often focus on trees and soils — vital, but vulnerable. Trees can burn, soil carbon can erode. True climate impact needs durability — carbon that stays locked away for decades or even centuries.

This is where biochar and other soil amendments come in.

Biochar is a stable, carbon-rich material produced by heating organic matter (like crop residues, wood waste, or manure) under low oxygen — a process called pyrolysis. When applied to soils, biochar not only improves fertility and water retention, but also stores carbon for hundreds to thousands of years.

For India — a nation where agriculture and waste management intersect — biochar represents a powerful, scalable, and high-quality carbon removal solution.

The 2025 Criteria for High-Quality Carbon Dioxide Removal highlight durability and environmental co-benefits as essential principles. Biochar checks both boxes.


 What Is Biochar?

Infographic titled “What is Biochar?” showing icons for heating biomass in a low-oxygen environment, improving soil fertility and water retention, and locking carbon in a stable form for centuries, with Anaxee branding.

Biochar is produced when organic biomass — crop residues, husks, twigs, or even municipal green waste — is heated in a low-oxygen environment. Unlike open burning (which releases CO₂), pyrolysis converts much of that carbon into a stable, solid form that resists decomposition.

When applied to soil:

-It enhances soil structure and nutrient retention.

-Increases microbial activity and root growth.

Infographic titled “Benefits of Biochar Application” featuring icons and text highlighting improved soil health, enhanced fertility, cost savings, and carbon sequestration, with Anaxee logo.

-Holds carbon in a stable state for centuries.

Simply put, it transforms agricultural waste into a permanent carbon sink.


Why Biochar Matters for India

1. Agriculture-Driven Economy

India’s 150+ million smallholder farmers generate vast crop residues. Many burn this biomass, contributing to air pollution and CO₂ emissions. Biochar converts that same waste into soil health and carbon credits.

2. Soil Degradation Crisis

Over 30% of Indian soils are degraded or nutrient-depleted. Biochar improves organic matter, pH balance, and water retention — directly improving productivity.

3. Climate Commitments

Under India’s Nationally Determined Contributions (NDCs) and CCTS (Carbon Credit Trading Scheme), durable carbon removal like biochar will be crucial to long-term decarbonization.

4. Circular Economy Alignment

Biochar ties together agriculture, waste management, and carbon markets — converting local problems into revenue-generating, climate-positive outcomes.


Biochar and Soil Amendments: What’s the Difference?
Infographic titled “Biochar & Soil Amendments for Farmers” displaying icons representing additional income, government support, soil health & productivity, and waste utilization, over an agricultural background.

While “biochar” often gets the spotlight, soil amendments is a broader category.

Type Description Carbon Durability Example Application
Biochar Pyrolyzed biomass, highly stable carbon 100–1000 years Crop residue pyrolysis for farm use
Compost Organic matter decomposition 1–10 years Manure or green waste for fertility
Enhanced Rock Weathering Silicate mineral application capturing CO₂ 100–10,000 years Basalt dust on farmlands
Organic Manures / Vermicompost Natural nutrient recycling 1–5 years Fertility boost, low permanence

Biochar stands out for durability, but its synergy with other amendments (like compost or rock dust) maximizes soil and carbon benefits — a strategy Anaxee is deploying at scale.


What Makes Biochar “High-Quality” Carbon Removal?

The 2025 Criteria for High-Quality CDR define three pillars for durable removals:

1. Measurement and MRV

Every tonne of carbon must be quantifiable, traceable, and verifiable.

-Biochar MRV involves tracking feedstock type, pyrolysis temperature, and application rate.

-Anaxee’s dMRV system records all these in real time using mobile apps and satellite-linked systems.

2. Durability

Carbon in biochar is chemically stable. Studies show >80% of carbon remains sequestered after 100 years.
This makes biochar one of the most durable CDR pathways available today.

3. Environmental Co-Benefits

High-quality projects enhance soil health, reduce pollution, and improve yields.
Biochar projects align perfectly with climate justice and environmental integrity — avoiding trade-offs like monoculture plantations or fertilizer overuse.


The MRV Challenge (and Opportunity)

Biochar’s credibility depends on robust data — how much carbon is actually stored and for how long.
Traditional MRV struggles with:

-Inconsistent feedstock records

-Lack of local lab analysis

-Fragmented data management

Anaxee’s Digital MRV (dMRV) overcomes this through:

-Geotagged data on biomass source and pyrolysis unit.

-Automated reporting of application areas.

-Satellite imagery cross-verification.

-Blockchain-based data integrity (for future registry integration).

Result: Lower verification costs, faster credit issuance, and traceable impact.


Anaxee’s Biochar and Soil Amendment Model

Infographic titled “Anaxee’s Biochar Workflow” showing five key stages — Feedstock, Pyrolysis, dMRV, Application, and Durability — represented by green icons on a beige background with Anaxee branding.

Anaxee integrates biochar into its Tech for Climate execution ecosystem, connecting farmers, technology, and markets:

1. Feedstock Collection via Digital Runners

-Rural Digital Runners mobilize local crop residue collection.

-Prevents burning and creates a carbon-positive supply chain.

2. Decentralized Pyrolysis Units

-Small-scale, locally operated pyrolysis units convert biomass to biochar.

-Supports village-level entrepreneurship.

3. dMRV Tracking

-Every batch of biochar is logged with feedstock details, GPS, timestamp, and application area.

-Farmers and buyers can trace carbon from field to registry.

4. Application and Soil Benefits

-Biochar applied on degraded farmlands increases yield, water retention, and soil carbon content.

-Results shared with buyers and verifiers through Anaxee dashboards.

5. Long-Term Durability

-Once sequestered, carbon in biochar remains stable for centuries.

-Regular satellite checks ensure no reversal or land-use change.

Anaxee thus bridges tech-enabled monitoring with community-centered implementation — ensuring carbon removals are real, durable, and fair.


Biochar in Carbon Markets

1. Growing Global Demand

Buyers like Microsoft, Shopify, and Carbonfuture are investing heavily in durable removals, including biochar. Credits fetch $100–$300 per tonne, far above typical forestry credits.

2. Emerging Methodologies

Standards like Puro.Earth, Verra’s Biochar Methodology, and Charm Industrial’s model are shaping a robust global market.

3. India’s Potential

With abundant biomass, low-cost labor, and supportive policy, India could become a biochar export powerhouse — provided quality and verification match global expectations.

Anaxee is positioning its projects to align with these premium markets, offering corporates traceable, durable, and community-positive credits.


The Co-Benefits: Climate, Soil, and People

High-quality biochar projects go beyond carbon:

Impact Area Description Example
Climate Long-term CO₂ sequestration, reduced burning Avoids stubble burning emissions
Soil Health Improved fertility, moisture retention, structure Higher yields for smallholders
Air Quality Eliminates crop-burning smoke Cleaner air in rural belts
Livelihoods Adds rural income via carbon finance Farmer revenue + local jobs
Circular Economy Reuses waste, reduces landfill Biomass → Biochar → Soil health

This is carbon removal that benefits both people and planet.


India’s Biochar Future

India’s next agricultural revolution won’t come from fertilizers — it’ll come from carbon-smart farming.
By 2030, India could:

-Produce 50 million tonnes of biochar annually,

-Sequester over 100 million tonnes of CO₂e, and

-Create millions of rural green jobs.

With the right infrastructure, MRV, and financing, biochar could become India’s signature carbon removal export.


Conclusion: Building Durability into India’s Carbon Story

Carbon markets are evolving fast. The next wave is about durability, traceability, and co-benefits — not just offsets.
Biochar embodies all three.

The 2025 Criteria for High-Quality CDR call for long-lasting, verifiable, socially just solutions.
Anaxee’s biochar model — integrating tech, communities, and dMRV — shows how India can lead this frontier.

As carbon buyers shift from “cheap” to credible, projects like Anaxee’s will define the new gold standard.


👉 Call to Action
Partner with Anaxee to scale biochar and soil carbon projects that deliver durable climate impact and rural prosperity across India.


About Anaxee:

 Anaxee drives/develops large-scale, country-wide Climate and Carbon Credit projects across India. We specialize in Nature-Based Solutions (NbS) and community-driven initiatives, providing the technology and on-ground network needed to execute, monitor, and ensure transparency in projects like agroforestry, regenerative agriculture, improved cookstoves, solar devices, water filters and more. Our systems are designed to maintain integrity and verifiable impact in carbon methodologies.

Beyond climate, Anaxee is India’s Reach Engine- building the nation’s largest last-mile outreach network of 100,000 Digital Runners (shared, tech-enabled field force). We help corporates, agri-focused companies, and social organizations scale to rural and semi-urban India by executing projects in 26 states, 540+ districts, and 11,000+ pin codes, ensuring both scale and 100% transparency in last-mile operations. Connect with Anaxee at sales@anaxee.com 


IETA VCM Guidelines 2.0 Explained: High-Integrity Carbon Credits & Anaxee’s Role

IETA VCM Guidelines 2.0 Explained: High-Integrity Carbon Credits & Anaxee’s Role

Introduction

The world is racing against time. The Intergovernmental Panel on Climate Change (IPCC) has made it painfully clear: global emissions must peak immediately and almost halve by 2030 to keep the 1.5°C target alive. Yet, corporate climate action is not keeping pace. Many companies either lack credible net zero targets or are falling behind on their commitments.

In this landscape, the Voluntary Carbon Market (VCM) plays a critical role. It offers companies a flexible, cost-effective pathway to complement internal decarbonisation with credible climate action. But trust in the VCM has been shaken by concerns over quality, transparency, and inconsistent standards. That’s why the International Emissions Trading Association (IETA) released the updated VCM Guidelines 2.0 in September 2025.

These guidelines set out a roadmap for high-integrity use of verified carbon credits (VCCs)—ensuring that offsets go beyond being just “carbon accounting tools” and instead become powerful levers for real climate impact.

For India, where carbon markets are still evolving and the government is piloting mechanisms like the Carbon Credit Trading Scheme (CCTS), aligning with international integrity standards is crucial. And this is where Anaxee Digital Runners Pvt. Ltd. steps in—as India’s climate execution engine, ensuring that global principles of integrity translate into real action on the ground.


Section 1: The State of the Voluntary Carbon Market

The VCM has grown into a multi-billion-dollar ecosystem. By allowing companies to buy Verified Carbon Credits (VCCs) from projects that reduce or remove emissions, it creates a financial channel to scale climate solutions, from afforestation to renewable energy.

But after peaking in 2021, voluntary retirements of carbon credits stagnated. Several reasons explain this slowdown:

-Reputational risks: Companies fear being accused of “greenwashing” if their credit purchases are seen as low-quality or tokenistic.

-Quality concerns: Not all carbon credits are equal. Some projects failed to deliver the promised climate benefits.

-Regulatory uncertainty: Different frameworks—VCMI, ICVCM, SBTi, ISO—provide overlapping but inconsistent guidance.

-Market complexity: With multiple registries, methodologies, and rules, corporates face confusion about what counts as “credible” action.

Yet, demand for high-quality carbon credits remains essential. According to IETA’s modelling, international carbon markets could cut global mitigation costs by up to 32%. And for countries like India, carbon markets can unlock vital climate finance to support communities, smallholder farmers, and nature-based solutions.

The IETA Guidelines 2.0 are designed to address these bottlenecks and restore trust.


Section 2: What Are the IETA VCM Guidelines 2.0?

IETA first launched its high-integrity guidelines in April 2024. Version 2.0, released in September 2025, builds on feedback from corporates, governments, and independent initiatives. The goal: create clear, pragmatic rules for companies that want to integrate carbon credits into their net zero strategies without losing credibility.

The guidelines outline seven pillars of integrity:

  1. Demonstrate support for the Paris Agreement goals – Companies must set science-based targets aligned with 1.5°C.

  2. Quantify and disclose Scope 1, 2, and 3 emissions – No shortcuts. Transparency is non-negotiable.

  3. Establish a net zero pathway and near-term targets – Companies must show measurable interim steps, not vague 2050 promises.

  4. Use VCCs in line with the mitigation hierarchy – Prioritise internal reductions first, use credits only for what cannot be abated.

  5. Ensure only high-quality credits are used – Credits must be additional, verifiable, permanent, and issued by credible standards.

  6. Transparent accounting and disclosure – Report gross vs. net emissions, credit vintages, registries, and methodologies used.

  7. Make robust and credible claims – Companies must avoid misleading labels like “carbon neutral” unless they meet strict conditions.

This framework sends a strong message: carbon credits are not excuses; they are enablers of ambitious decarbonisation.


Section 3: Why High-Integrity Use Matters

The credibility of the VCM hinges on integrity. When companies misuse credits—buying cheap offsets while continuing business-as-usual emissions—they undermine trust in the entire system.

This has real consequences:

-NGOs and watchdogs accuse corporates of greenwashing.

-Regulators consider tightening rules, adding compliance risks.

-Investors lose confidence in ESG disclosures.

-Genuine climate finance flows to vulnerable regions slow down.

High-integrity use ensures that:

-Every credit corresponds to a real, measurable emission reduction or removal.

-Companies are transparent about how credits fit into their climate strategy.

-VCM finance actually accelerates global net zero, instead of being a distraction.

IETA’s Guidelines are therefore as much about protecting corporate reputations as they are about protecting the climate.


Section 4: Corporate Use Cases of VCCs

One of the strengths of the IETA Guidelines 2.0 is their recognition of multiple legitimate use cases for carbon credits. Instead of seeing credits only as end-of-pipe offsets, the guidelines outline broader roles:

  1. Meeting Interim Targets – Companies can use credits to stay accountable in the 2020s and 2030s, while technology solutions scale up.

  2. Staying on Track – If a company falls behind its science-based trajectory, credits can bridge the gap temporarily.

  3. Insetting – Credits generated within a company’s supply chain (e.g., regenerative agriculture projects) to cut Scope 3 emissions.

  4. Counterbalancing Residual Emissions – At net zero, credits are vital to address unavoidable emissions.

  5. Addressing Historical Emissions – Ambitious companies can go further by compensating for their legacy impact.

  6. Going Beyond Net Zero – Contributing extra credits to accelerate global decarbonisation.

This flexible approach makes credits not just compliance tools, but strategic assets for companies that want to demonstrate climate leadership.


Section 5: VCC Quality and Risk Management

Not all credits are created equal. IETA emphasizes strict quality filters:

-Additionality – Projects must deliver emission reductions that wouldn’t have happened otherwise.

-Permanence – Risks of reversal (e.g., forest fires) must be managed via buffers or insurance.

-Verification – Independent auditors must validate methodologies and outcomes.

-Transparency – Project details, vintages, and retirement records must be public.

Emerging tools to support quality include:

-ICVCM’s Core Carbon Principles (CCPs)

-Carbon rating agencies (CRAs) like Sylvera and BeZero

-Carbon insurance products to mitigate project failure risks

The message is clear: a credit with integrity is an investment in climate stability; a poor-quality credit is a liability.


Section 6: Policy & Market Convergence

Carbon markets are no longer siloed. Voluntary and compliance frameworks are converging:

-Under Article 6 of the Paris Agreement, countries can use VCCs to meet their Nationally Determined Contributions (NDCs).

-Domestic markets (California ETS, Singapore carbon tax, China ETS) already allow limited use of credits.

-India’s Carbon Credit Trading Scheme (CCTS) is preparing to integrate credits into regulated trading.

For corporates, this convergence means two things:

  1. Credits used voluntarily today may soon count under compliance.

  2. Regulatory scrutiny on claims will only increase.

Aligning with IETA’s guidelines now helps companies future-proof their climate strategies.


Section 7: What This Means for India

India is at the center of the climate-finance equation. As a fast-growing economy and one of the world’s largest emitters, India must decarbonise without stalling development.

The VCM offers three major opportunities for India:

-Channel private finance into nature-based solutions (NbS) like agroforestry, mangroves, and soil carbon.

-Support smallholder farmers and rural communities by making them stakeholders in carbon markets.

-Position Indian corporates to meet global supply chain expectations around net zero and Scope 3 accounting.

But to tap this opportunity, integrity is non-negotiable. Projects must avoid leakage, ensure permanence, and deliver verifiable co-benefits. That’s where local execution capacity becomes critical.


Section 8: Anaxee’s Value in This Context

For international buyers and Indian corporates, the biggest question is: who will ensure integrity on the ground?

This is where Anaxee Digital Runners Pvt. Ltd. adds unique value:

  1. Execution Engine at Scale

    -With 125+ professionals and a network of 40,000+ Digital Runners, Anaxee can implement and monitor projects across India’s villages and farmlands.
    -This local capacity solves the biggest bottleneck: execution.

  2. dMRV & Transparency Tools

    -Anaxee integrates satellite monitoring, AI-driven analytics, and mobile-based data collection.
    -This ensures census-level verification, making every credit auditable, transparent, and trustworthy.

  3. Community Engagement

    -Projects are designed with farmer and community participation, ensuring permanence and social co-benefits.
    -This aligns with IETA’s emphasis on stakeholder consultation and just transition.

  4. Risk Reduction for Corporates

    -By ensuring credits meet international quality standards, Anaxee reduces reputational and compliance risks for buyers.

  5. Alignment with IETA Guidelines

    -Scope 1–3 emissions tracking for clients → supports disclosure.
    -High-quality, verified credits → ensures integrity.
    -Transparent registries and reporting → supports guideline 6.
    -Enabling corporates to make credible claims → prevents greenwashing.

In short: Anaxee translates IETA’s global guidelines into Indian ground reality.


Conclusion

The IETA VCM Guidelines 2.0 are more than a policy paper. They are a blueprint for credibility in carbon markets. By following them, companies can avoid greenwashing, build trust, and channel finance into solutions that truly matter.

But guidelines alone cannot deliver impact. Execution on the ground—across diverse geographies, communities, and ecosystems—remains the missing link.

That’s where Anaxee steps in. With its blend of last-mile execution, community partnerships, and technology-driven monitoring, Anaxee ensures that every carbon credit is real, additional, and trustworthy.

For corporates navigating India’s climate market, this means confidence:

-Confidence that credits are high-quality.

-Confidence that investments are future-proof.

-Confidence that climate claims will stand scrutiny.

The voluntary carbon market is at a crossroads. It can either regain credibility and scale—or stagnate under distrust. With IETA’s guidelines and Anaxee’s execution capacity, there’s a clear pathway forward: climate action with integrity.


 About Anaxee:

 Anaxee drives/develops large-scale, country-wide Climate and Carbon Credit projects across India. We specialize in Nature-Based Solutions (NbS) and community-driven initiatives, providing the technology and on-ground network needed to execute, monitor, and ensure transparency in projects like agroforestry, regenerative agriculture, improved cookstoves, solar devices, water filters and more. Our systems are designed to maintain integrity and verifiable impact in carbon methodologies.

Beyond climate, Anaxee is India’s Reach Engine- building the nation’s largest last-mile outreach network of 100,000 Digital Runners (shared, tech-enabled field force). We help corporates, agri-focused companies, and social organizations scale to rural and semi-urban India by executing projects in 26 states, 540+ districts, and 11,000+ pin codes, ensuring both scale and 100% transparency in last-mile operations. Connect with Anaxee atsales@anaxee.com 

Scope 1, 2, and 3 Emissions Explained: A Complete Guide for Businesses

Introduction: Why Are Scope 1, 2, and 3 Important?

Every business today faces the same question: How sustainable are your operations?

Governments, investors, customers, and even employees want answers. And when companies reply, they don’t just talk about their own fuel use or electricity bills. They speak in the language of Scope 1, 2, and 3 emissions.

Infographic showing Scope 1, Scope 2, and Scope 3 emissions categories with icons of factory, electricity grid, supplier truck, and waste bin.

These three categories, defined by the Greenhouse Gas (GHG) Protocol, have become the global framework for measuring and reporting emissions. Without them, climate commitments like Net Zero by 2050 would remain vague promises.

But while Scope 1 and Scope 2 are relatively easy to understand, Scope 3 is the real challenge. It extends far beyond a company’s direct operations, covering suppliers, customers, and waste streams.

In this guide, we’ll break down each scope, provide examples from different industries, explain why Scope 3 dominates discussions, and finally show how Anaxee Digital Runners brings technology and community power together to make Scope accounting and reduction practical on the ground.


The GHG Protocol and Its Scopes

The GHG Protocol Corporate Standard, developed by the World Resources Institute (WRI) and the World Business Council for Sustainable Development (WBCSD), is the most widely used carbon accounting framework.

It divides corporate emissions into three “scopes”:

-Scope 1: Direct emissions from owned or controlled sources.

-Scope 2: Indirect emissions from purchased energy.

-Scope 3: All other indirect emissions in the value chain.

This classification helps businesses:

  1. Avoid double counting.

  2. Compare performance across industries.

  3. Identify where emissions reductions are most impactful.


Infographic with examples of Scope 1, 2, and 3 emissions: manufacturing facilities, purchased electricity, business travel and waste.

Scope 1 Emissions — Direct and Visible

Scope 1 is the most straightforward category. It includes emissions from sources that a company owns or controls.

Examples:

-Burning fuel in company-owned vehicles, generators, or boilers.

-On-site industrial processes, such as chemical production or steelmaking.

-Fugitive emissions from refrigeration, air conditioning, or gas leaks.

Sector snapshots:

-Manufacturing: Gas-fired furnaces, diesel forklifts.

-Logistics: Truck fleets running on petrol or diesel.

-Agriculture: Methane from company-owned livestock herds.

Why it matters:
Scope 1 represents a company’s most visible footprint. These are the emissions regulators and communities often point to when discussing local air quality or compliance with national targets.

Reduction strategies:

-Transition company fleets to EVs or CNG.

-Replace oil-fired boilers with solar thermal systems.

-Improve process efficiency using automation and data monitoring.


Scope 2 Emissions — The Outsourced Chimney

Scope 2 covers emissions from purchased energy — electricity, heat, or steam.

Examples:

-An IT company powering data centers with coal-heavy grid electricity.

-A textile factory buying steam from a district heating plant.

-Office spaces running on air conditioning powered by fossil-fuel grids.

These emissions don’t occur inside the company fence line. They occur at the power plant that generates the electricity. But since the company consumes that energy, it bears responsibility.

Sector snapshots:

-Tech & IT: Data centers are Scope 2 heavy.

-Retail chains: Electricity for lighting, cooling, and refrigeration.

-Hospitals: High power consumption for equipment and HVAC.

Reduction strategies:

-Purchase renewable electricity via PPAs (Power Purchase Agreements).

-Install rooftop solar or captive renewable plants.

-Improve building energy efficiency (LEDs, insulation, HVAC upgrades).

👉 Scope 2 is often the low-hanging fruit for businesses aiming to quickly cut emissions.


Scope 3 Emissions — The Giant in the Room

Scope 3 is the most complex — and usually the largest — part of a company’s footprint. It covers all other indirect emissions in the value chain.

Examples:

-Extraction and processing of purchased raw materials.

-Business travel and employee commuting.

-Transportation and logistics of goods.

-Use of sold products (fuel in cars, electricity in appliances).

-End-of-life disposal (waste, recycling, landfilling).

Why Scope 3 matters:

-For consumer goods companies, Scope 3 can make up 90–95% of total emissions.

-For banks, investments in carbon-intensive industries fall under Scope 3.

-For oil companies, customer use of fuels is Scope 3 and dwarfs Scope 1 and 2.

Sector snapshots:

-Automotive: Customer driving (fuel combustion) is the largest Scope 3.

-Food industry: Farming inputs and supply chains dominate Scope 3.

-Fashion: Raw material production (cotton, polyester), logistics, and waste.

Challenges:

-Data gaps: Companies rely on suppliers for accurate information.

-Complexity: Thousands of suppliers, multiple geographies.

-Double counting risks: One company’s Scope 3 may be another’s Scope 1.

Reduction strategies:

-Collaborate with suppliers on low-carbon materials.

-Design products for circularity (reuse, recycling).

-Offer low-carbon alternatives (EVs, energy-efficient appliances).

-Influence customer behavior through product innovation.

👉 Scope 3 isn’t optional anymore. Regulators and investors increasingly expect full disclosure.


Step-by-step infographic titled "Steps to Measure Greenhouse Gas Emissions," listing organizational boundaries, data collection, total emissions calculation, and reduction targets.
Why Splitting into Scopes Makes Sense

The three-scope framework exists for a reason:

  1. Clarity: Companies know what they are directly responsible for.

  2. Comparability: Industries can benchmark performance.

  3. Accountability: Prevents multiple companies from claiming the same reductions.

For instance, a coal power plant counts emissions as Scope 1. A manufacturing company using that power counts them as Scope 2. The suppliers and customers downstream consider relevant portions under Scope 3.

This layered approach creates a global map of carbon responsibility.


Case Studies Across Industries

-IBM: Reduced Scope 2 emissions in Texas by switching to wind power, cutting 4,100 tonnes of CO₂ annually.

-DHL Sweden: Found 98% of emissions came from outsourced logistics (Scope 3).

-Tata Steel: Tracks Scope 1 and 2 using digital systems, aligning with global benchmarks.

-Ford Motor Company: Expanded inventory to include Scope 3, enabling it to join emissions trading programs. These examples show how companies worldwide are aligning business strategy with the GHG Protocol.


Common Pitfalls in Scope Reporting

-Over-focusing on Scope 1: Easy to measure, but often small compared to Scope 3.

-Ignoring suppliers: Without supplier data, Scope 3 becomes guesswork.

-Greenwashing: Selective disclosure without full transparency.

-Static reporting: Failing to update inventories as supply chains evolve.

The lesson? All three scopes matter — and need continuous updating.


The Future of Scope Accounting

The world is moving toward mandatory carbon disclosure.

-The EU’s CSRD (Corporate Sustainability Reporting Directive) requires detailed scope reporting.

-The US SEC is considering Scope 3 disclosure for listed companies.

-India’s BRSR (Business Responsibility and Sustainability Reporting) framework is pushing corporates in this direction.

Science-Based Targets initiative (SBTi) also mandates that companies include Scope 3 if it makes up more than 40% of their total footprint.

The future is clear: Scope 3 disclosure will be non-negotiable.


How Anaxee Adds Value

Here’s where Anaxee Digital Runners steps in. Managing Scopes isn’t just about reporting — it’s about execution on the ground.

Anaxee brings a unique combination of Tech + Community:

-Digital Runners Network: 40,000+ trained local people across India collecting last-mile data, ensuring accurate Scope 1–3 inventories.

-dMRV Tools: Digital monitoring, reporting, and verification systems that replace outdated spreadsheets.

-Community Engagement: Scope 3 depends heavily on supplier and consumer behavior. Anaxee’s grassroots presence helps companies drive awareness and behavior change.

-Implementation Power: From agroforestry to renewable adoption, Anaxee doesn’t just advise — it executes projects across thousands of villages.

-Transparency Dashboards: Real-time visibility for corporates to track reductions against Scope targets.

For businesses in India and global investors looking at Nature-based Solutions (NbS), Anaxee provides the execution muscle and tech backbone to actually deliver reductions, not just commitments.


Conclusion: Turning Scopes into Action

Scopes 1, 2, and 3 give companies a complete picture of their carbon footprint.

-Scope 1 is about direct control.

-Scope 2 is about the energy you rely on.

-Scope 3 is about the full value chain.

The hard truth? Scope 3 is the elephant in the room — but also the biggest opportunity. Companies that master it will not only cut emissions but also build resilience, efficiency, and stronger brands.

And with partners like Anaxee, businesses don’t have to navigate this alone. Anaxee’s Tech for Climate approach brings credibility, scale, and ground-level execution to help companies not just measure emissions — but reduce them, for real.

Because in the end, what matters isn’t just counting carbon. It’s cutting it.