What Is a Carbon Credit Worth? Understanding the Real Value in 2025
Introduction: Why Carbon Credit Value Matters
In climate action, “carbon credits” have become a kind of currency — a unit that represents one metric tonne of carbon dioxide (or equivalent greenhouse gases) reduced, removed, or avoided. But like any currency, its worth isn’t fixed. Prices shift dramatically depending on the type of project, the market it’s traded in, and even the perceived integrity of the credit itself.
In 2025, the question “What is a carbon credit worth?” has no single answer. A credit from a community-led forest conservation project in Kenya may fetch $18 in the voluntary market, while a carbon removal credit from a cutting-edge direct air capture facility might sell for $400 or more. Meanwhile, a compliance market allowance under the European Union Emissions Trading System (EU ETS) could trade at €90 (~$98).
The variation is vast. And for companies, investors, and project developers, knowing why these price differences exist is critical — both for budgeting and for ensuring impact.
In this blog, we’ll break down:
-How voluntary and compliance markets price credits
-The current price ranges for 2025
-The main factors that push prices up or down
-Examples of real transactions
-Why “price” isn’t the same as “value”
-What buyers should watch for when sourcing credits
1. Carbon Credit Basics
Before diving into numbers, let’s set the stage.
A carbon credit equals one metric tonne of CO₂e reduced, removed, or avoided. They are generated through projects that either:
-
Avoid emissions — e.g., protecting forests that would otherwise be cut down, distributing clean cookstoves that replace wood-burning fires.
-
Remove emissions — e.g., planting trees (afforestation/reforestation), biochar application, or using technology like direct air capture.
Two Main Markets
a) Compliance Markets
-These exist because governments set legally binding caps on emissions.
-Examples: EU ETS, California Cap-and-Trade, China ETS.
-Companies that emit more than their allowance must buy extra permits or offsets.
-Prices here are usually higher, because demand is driven by law.
b) Voluntary Carbon Markets (VCM)
-Companies and individuals buy credits to meet self-imposed climate targets (e.g., “net zero” pledges).
-No legal obligation — purchases are for CSR, ESG reporting, or brand reputation.
-Prices vary more here, as demand is voluntary and influenced by perceptions of quality.
2. The Price Spectrum in 2025
The worth of a carbon credit is not fixed — it’s a spectrum.
Voluntary Carbon Market Prices (2025)
| Project Type | Price Range (USD/tCO₂e) | Notes |
| Nature-based (REDD+, ARR, mangroves) | $7 – $24 | Highest prices for projects with biodiversity & community benefits |
| Technology-based removals (DAC, BECCS) | $170 – $500 | Still small volume, but growing demand |
| Agriculture/soil carbon | $8 – $15 | Quality varies; permanence risk |
| Renewable energy (older projects) | $2 – $5 | Oversupplied, low demand |
-ARR (Afforestation, Reforestation, Revegetation) credits with high ratings (e.g., BBB+) are trading around $24 in primary markets.
-Credits rated lower or with less stringent verification may trade below $10.
Source: Gold Standard, CarbonCredits.com, Sylvera data (2025 updates)
Compliance Market Prices (2025)
| Market | Price (USD/tCO₂e) | Comment |
| EU ETS | ~$98 | Highly regulated, stable demand |
| California Cap-and-Trade | ~$42 | Slight upward trend |
| China ETS | ~$9 | Large volume, lower price point |
Key takeaway: A credit could be “worth” anywhere from $2 to $500 depending on where and what it comes from.
3. What Drives Carbon Credit Prices
Several interlinked factors influence what a carbon credit sells for.
a) Market Type
Compliance market prices are anchored by regulation — demand is mandatory. Voluntary market prices fluctuate more because demand is discretionary.
b) Project Type & Methodology
-Technology-based removals cost more to produce and command higher prices.
-Nature-based projects often include co-benefits (biodiversity, livelihoods), which can push up value.
-Methodologies like Verra’s VM0047 for agroforestry or Gold Standard’s cookstove methodology define how credits are quantified — some are more trusted than others.
c) Quality & Integrity
-High-integrity credits (verified additionality, permanence, co-benefits) can sell for 2–3x the price of generic credits.
-Low-integrity credits may be cheap but carry reputational risk.
d) Supply & Demand
-Oversupply in certain segments (e.g., renewable energy credits) pushes prices down.
-Anticipated scarcity (e.g., for removal credits) drives prices up.
e) Co-Benefits
Credits with community health, water access, gender empowerment, or biodiversity benefits can fetch a 78% premium over similar credits without them.
f) Certification
-Verified Carbon Standard (Verra), Gold Standard, American Carbon Registry, Climate Action Reserve all influence buyer trust.
-Buyers pay more for credits from standards they recognize as rigorous.
4. Real-World Example: Acre, Brazil
In 2025, Standard Chartered signed a deal to market up to 5 million jurisdictional forest carbon credits from the state of Acre, Brazil, starting in 2026.
-Potential value: $150 million over project life.
-72% of proceeds go to local communities — increasing both impact and buyer confidence.
-Backed by Acre’s jurisdictional REDD+ program, ensuring large-scale, government-aligned integrity.
This is a perfect example of how integrity + jurisdictional backing can push credit prices into the upper range for nature-based offsets.
5. The Gap Between Market Price and Social Cost
One of the more sobering realities is that most carbon credits sell for far less than the social cost of carbon — the estimated economic damage caused by emitting one tonne of CO₂.
-US EPA estimates: between $11 and $212/tCO₂e (depending on model).
-Most voluntary credits trade below $20 — meaning the climate damage cost is often higher than the price paid to prevent it.
This gap highlights that buying credits alone won’t solve climate change — but they can be a valuable tool when paired with real emission reductions.
6. Risks and Criticisms
Even as the market matures, risks remain:
-Greenwashing: Using credits to avoid actual emission cuts.
-Integrity scandals: Investigations have shown some rainforest credits overstated benefits.
-Permanence risks: Forest fires, policy changes, or project failures can erase carbon benefits.
-Price volatility: Particularly in voluntary markets, prices can swing sharply.
For buyers, due diligence is essential.
7. The Future: Where Are Prices Headed?
Analysts expect:
-Voluntary market demand to grow sharply, possibly hitting $50B by 2030.
-Price increases for high-quality credits, especially removals.
-Integration with compliance markets — blurring the line between “voluntary” and “regulated.”
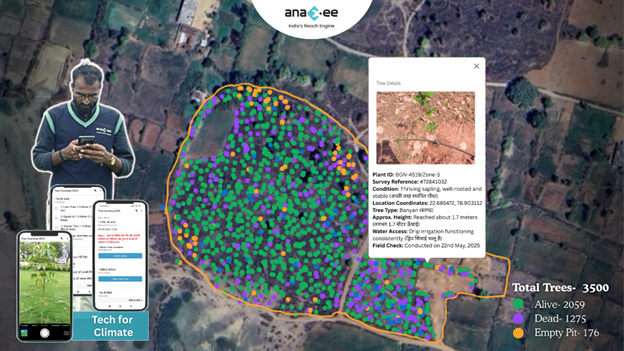
-Digital MRV (dMRV) will reduce verification costs and increase trust.
For example, under some scenarios, voluntary removal credits could trade above $200/t by 2030.
8. Practical Guidance for Buyers
When sourcing credits:
-
Know Your Purpose — Are credits for compliance, voluntary targets, or brand reputation?
-
Check Certification — Stick to recognized standards.
-
Assess Co-Benefits — Biodiversity and community impact can enhance brand value.
-
Plan for Price Rises — Lock in forward contracts if possible.
-
Pair with Real Reductions — Credits work best when complementing, not replacing, internal decarbonization.
Conclusion: Worth is More Than Price
In 2025, a carbon credit’s “worth” is multi-layered:
-Financial worth — The market price per tonne.
-Climate worth — The actual impact on emissions.
-Social worth — Benefits to communities, biodiversity, and resilience.
For corporates, NGOs, and investors, this means looking beyond the cheapest option. The most “valuable” credits may cost more upfront, but deliver greater long-term benefits — both for the planet and for reputation.
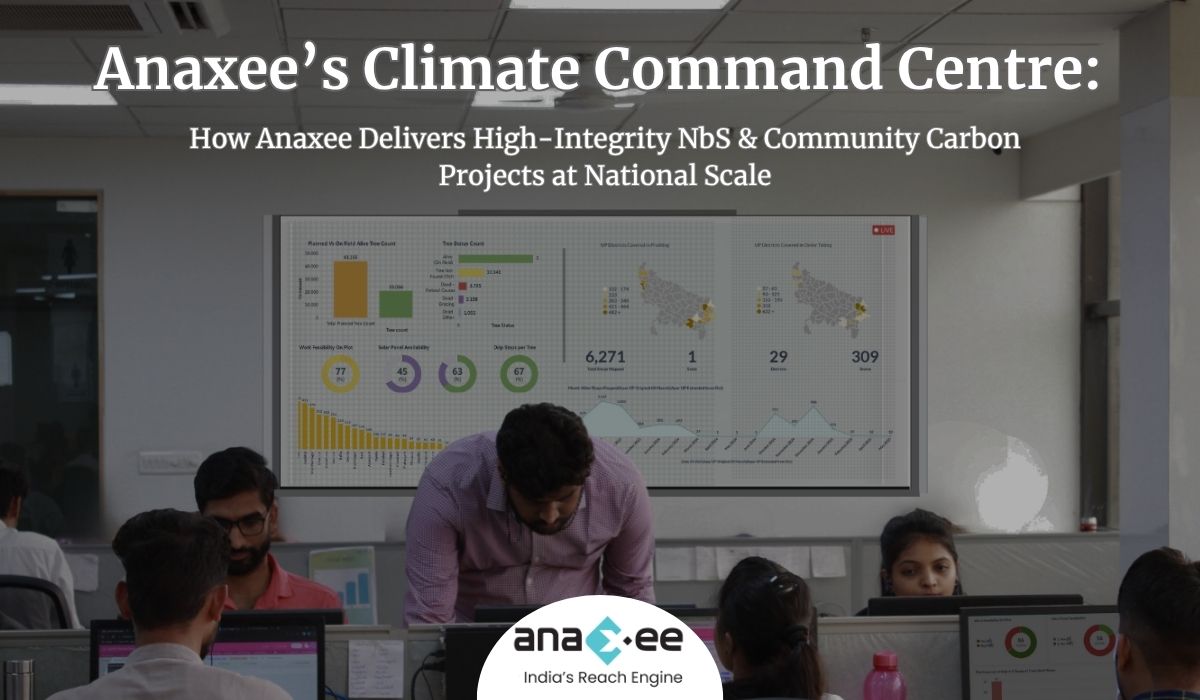
At Anaxee, we work with partners to design, implement, and monitor high-integrity carbon and nature-based projects, ensuring that every credit carries not just a price tag — but a story worth telling.
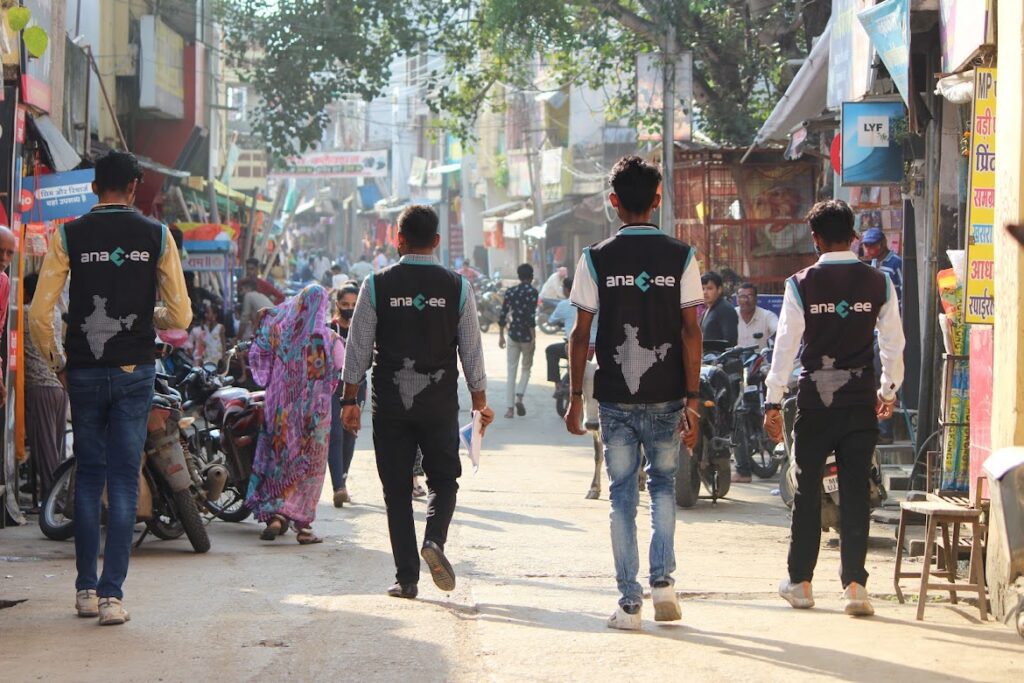
About Anaxee:
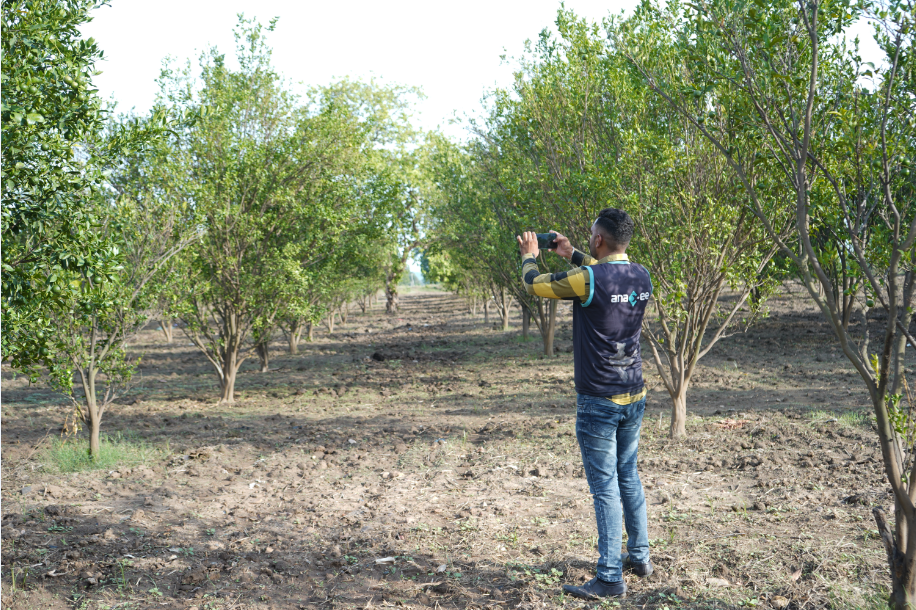
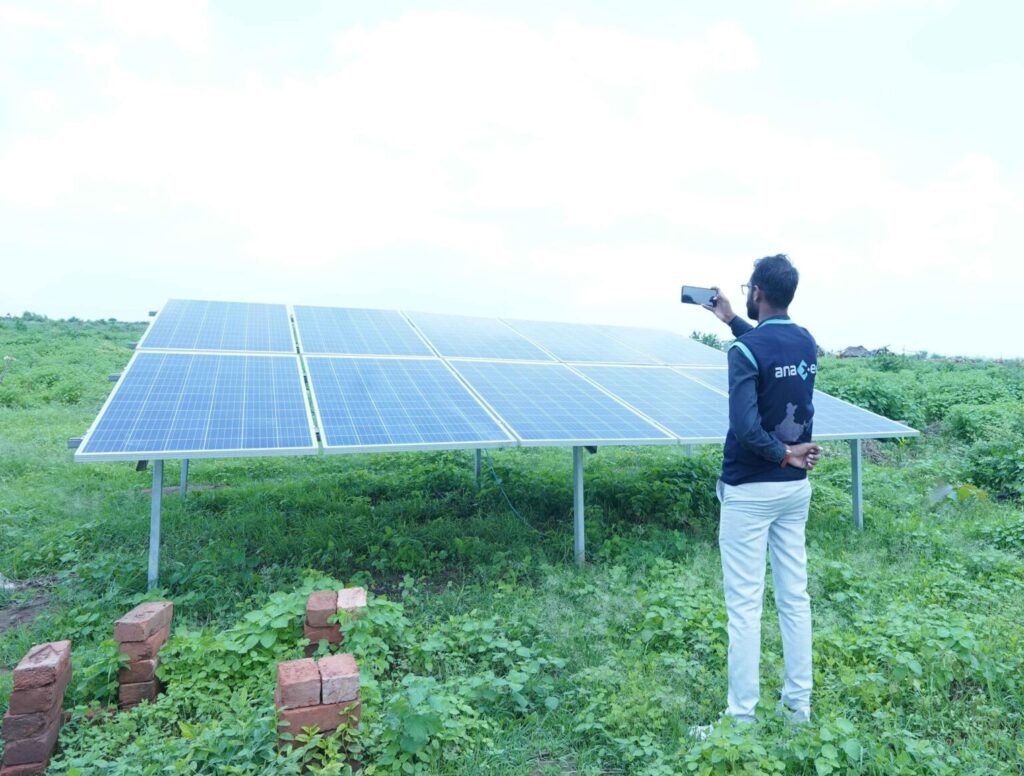
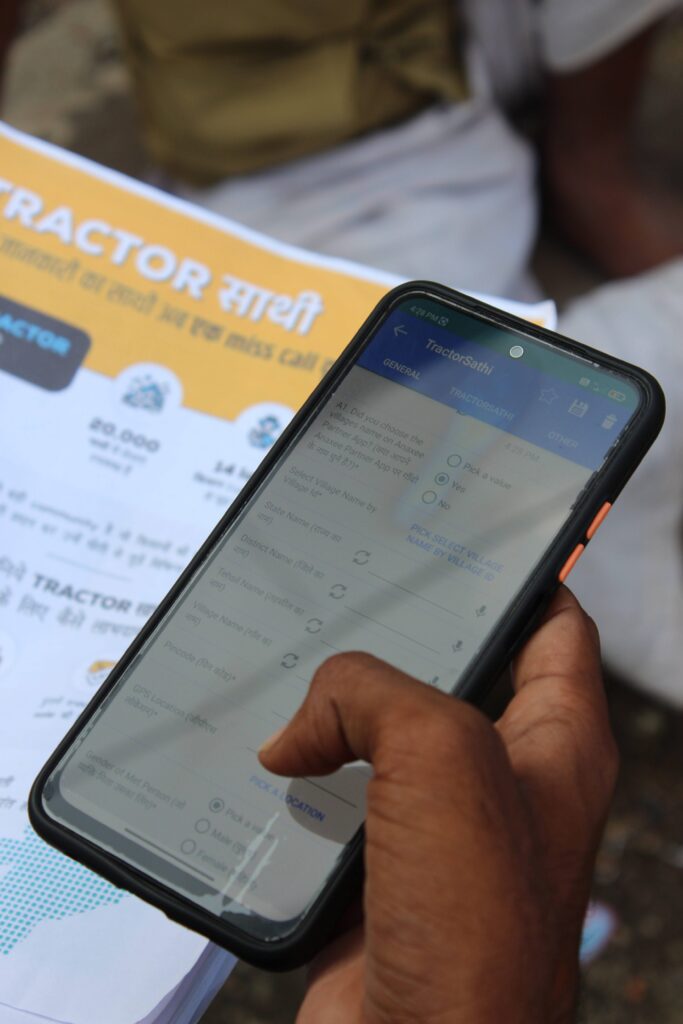
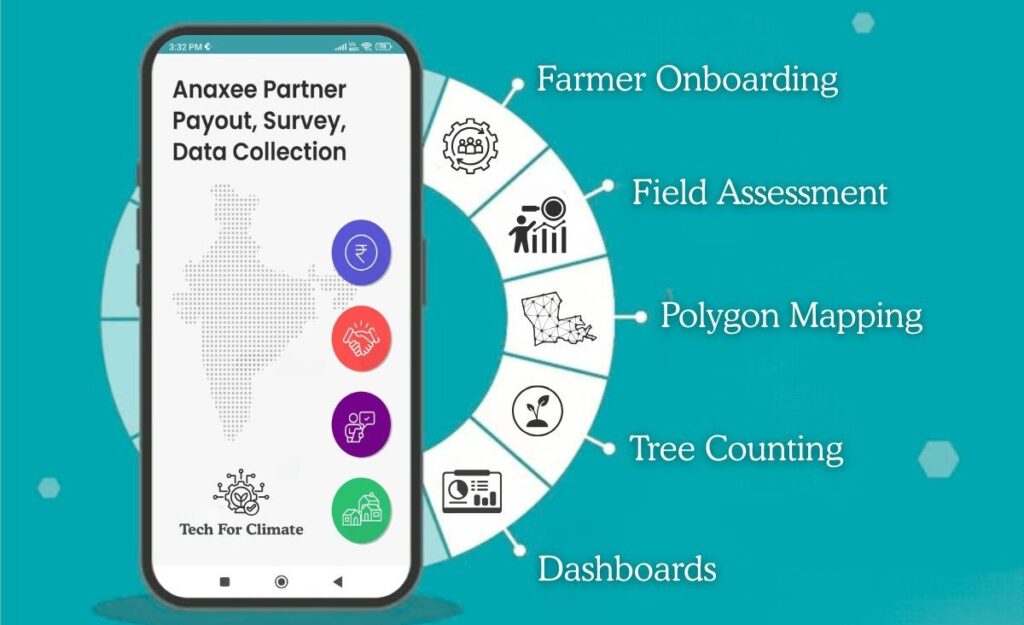
Anaxee drives large-scale, country-wide Climate and Carbon Credit projects across India. We specialize in Nature-Based Solutions (NbS) and community-driven initiatives, providing the technology and on-ground network needed to execute, monitor, and ensure transparency in projects like agroforestry, regenerative agriculture, improved cookstoves, solar devices, water filters and more. Our systems are designed to maintain integrity and verifiable impact in carbon methodologies.
Beyond climate, Anaxee is India’s Reach Engine- building the nation’s largest last-mile outreach network of 100,000 Digital Runners (shared, tech-enabled field force). We help corporates, agri-focused companies, and social organizations scale to rural and semi-urban India by executing projects in 26 states, 540+ districts, and 11,000+ pin codes, ensuring both scale and 100% transparency in last-mile operations.