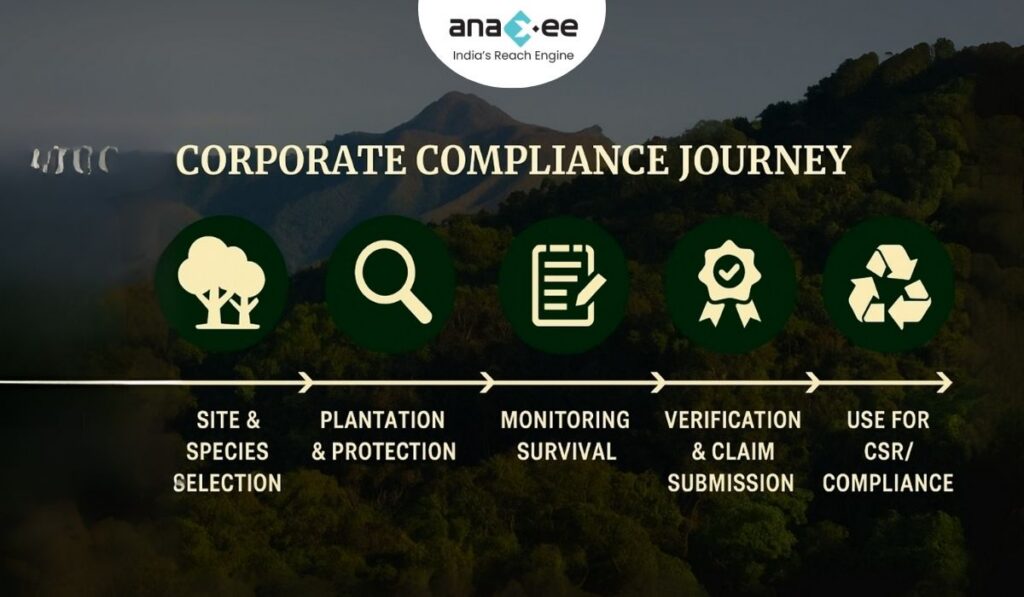
Trees are one of the most iconic symbols of climate action. They pull carbon from the atmosphere, provide oxygen, restore biodiversity, and improve livelihoods. Afforestation (planting trees where none existed) and reforestation (restoring degraded forests) together are known as ARR projects.
Globally, ARR is one of the most widely adopted pathways in carbon markets. In India, with its vast degraded lands and dependence on agriculture and forests, ARR has immense potential.
But ARR also faces heavy scrutiny. Many projects promise more than they deliver: trees that never survive, monoculture plantations that harm biodiversity, or communities left out of benefits.
The 2025 Criteria for High-Quality CDR stress that ARR projects must be measured, durable, and just. That’s where Anaxee steps in—with last-mile reach, dMRV tools, and community-first models.
What Is ARR (Afforestation and Reforestation)?
ARR projects include:
-Afforestation: Establishing forests on land that has not been forested for decades.
-Reforestation: Restoring forests on degraded or recently deforested lands.
-Agroforestry & Bund Plantations: Integrating trees into farms, hedges, and bunds.
Done right, ARR not only removes carbon but delivers ecosystem resilience, biodiversity, and livelihoods.
Why ARR Matters for India
1. Huge Degraded Land Base
India has over 30 million hectares of degraded land—an untapped opportunity for carbon removal and ecosystem restoration.
2. Rural Livelihoods
Tree planting provides fuel, fodder, fruits, and timber—direct benefits for farmers and communities. With carbon finance, ARR becomes a long-term income stream.
3. Climate Targets
India’s NDCs under the Paris Agreement call for creating an additional 2.5–3 billion tonnes of CO₂ equivalent carbon sink by 2030 through forests and trees. ARR is central to this goal.
What Makes High-Quality ARR Projects?
The 2025 Criteria define key principles:
1. Social and Environmental Justice
-Avoid land grabs.
-Secure community consent and benefits.
-Respect Indigenous rights and cultural landscapes.
2. Biodiversity and Ecosystem Integrity
-No monoculture plantations in natural ecosystems.
-Native species, mixed forests, and landscape restoration.
3. Additionality and Baselines
-Projects must prove trees would not have grown without carbon finance.
-Conservative baselines for carbon stock.
4. MRV and Transparency
-Geotagged planting data.
-Satellite and ground verification.
-Independent third-party audits.
5. Durability
-Fire, drought, pests—ARR faces reversal risks. Projects must plan long-term maintenance and insurance buffers.
6. Leakage Control
-Ensure planting here doesn’t drive deforestation elsewhere.
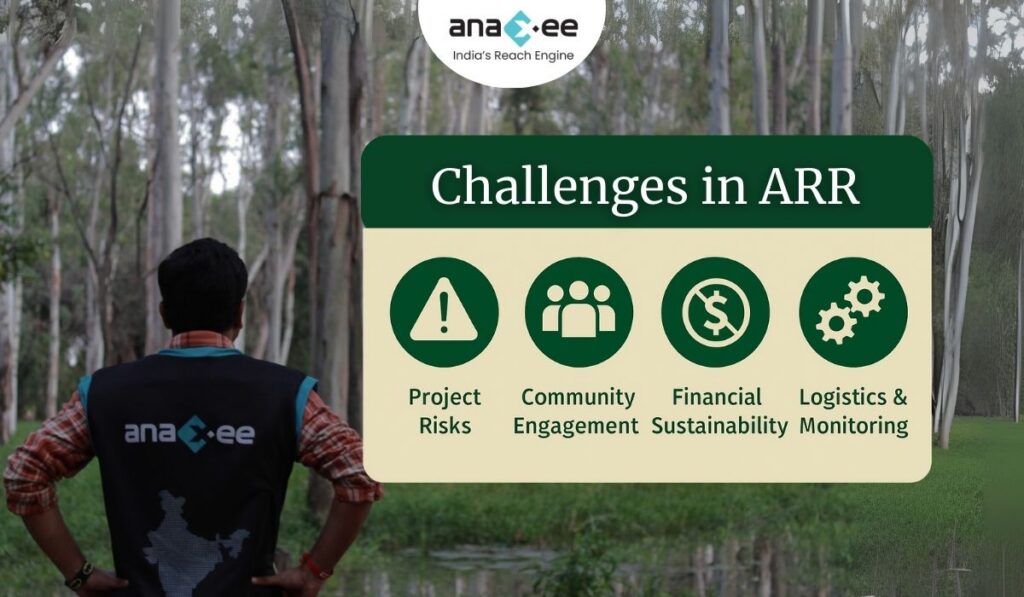
The Challenges of ARR
-Low Survival Rates: Many plantation drives see <30% survival after a few years.
-Monocultures: Quick-growing species like eucalyptus harm ecosystems.
-Short-Termism: Projects collapse after initial funding.
-Community Exclusion: Farmers and locals often see no benefits.
This is why ARR projects face skepticism. To be credible, they must deliver quality, not just quantity.
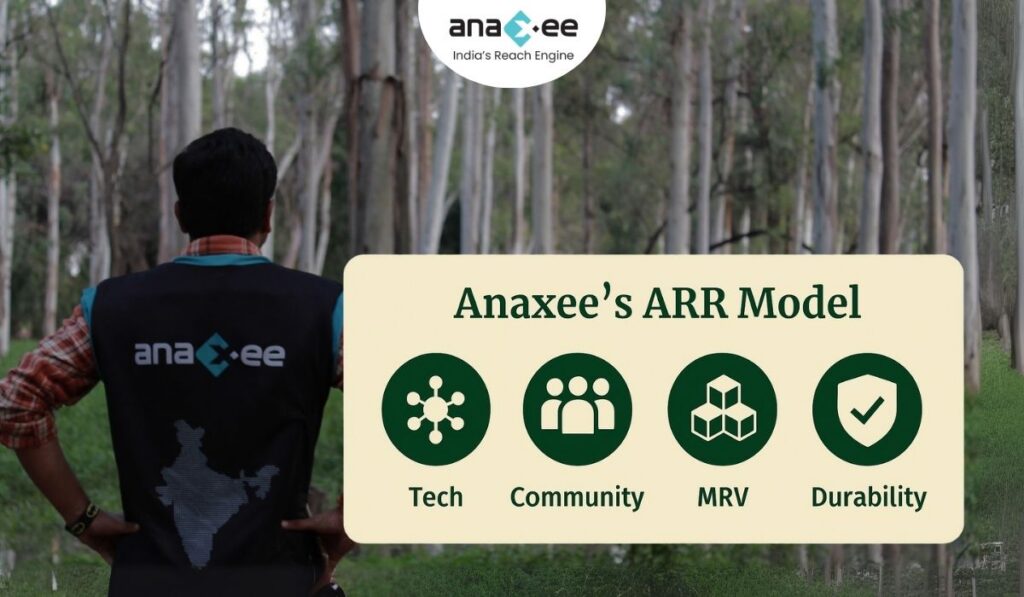
Anaxee’s Approach to High-Quality ARR
Anaxee ensures ARR projects meet global standards while delivering local value.
1. Last-Mile Reach
-40,000+ Digital Runners mobilize communities across 26 states.
-Farmers are trained and incentivized for long-term tree care.
-Projects aligned with Verra (ARR methodologies), Gold Standard, and 2025 Criteria.
-Buyers receive auditable, traceable credits.
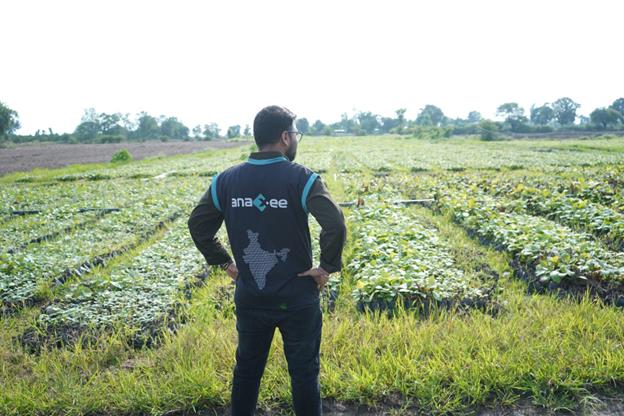
Case Example: Bund Plantations in Madhya Pradesh
Anaxee has pioneered bund plantations—trees planted along farm bunds:
-Carbon Removal: Sequesters carbon in biomass + soils.
-Farmer Benefits: Provides fodder, shade, and reduced erosion.
-Traceability: Each tree is geotagged and tracked in dMRV.
-Durability: Farmers protect trees because they share in revenue.
This model combines climate action, community income, and transparent reporting—a blueprint for scaling ARR in India.
India’s Global ARR Opportunity
Global buyers are looking for high-quality ARR credits:
-Microsoft, Shell, and major corporates invest in forest carbon.
-ARR credits trade actively in voluntary markets.
-Compliance markets (like India’s CCTS) may also integrate ARR soon.
If ARR in India meets quality benchmarks, it can:
-Unlock billions in carbon finance.
-Restore degraded landscapes.
-Create millions of rural jobs.
Scaling ARR: Quality over Hype
The world has seen too many “plant a billion trees” campaigns with little impact. The future is not about numbers—it’s about verified, durable, community-led ARR projects.
Scaling ARR requires:
-Quality-first design.
-Digital MRV for transparency.
-Farmer and community partnerships.
-Long-term management and durability planning.
Anaxee is building exactly this system in India.
Conclusion: Planting Trust Alongside Trees
ARR has the potential to be India’s most powerful carbon removal tool. But only if done right. The 2025 Criteria for High-Quality CDR provide the guardrails.
Anaxee ensures ARR projects are transparent, durable, and community-driven. By planting trust alongside trees, we create climate solutions that endure.
👉 Call to Action Partner with Anaxee to build high-quality afforestation and reforestation projects in India. Together, we can restore ecosystems, empower communities, and deliver credible carbon removals. Connect with us at sales@anaxee.com
Introduction: Why MRV Is the Backbone of Carbon Markets
Every carbon credit is supposed to represent one tonne of CO₂ removed or avoided. But how do we know that tonne is real? How do we ensure it isn’t double-counted, exaggerated, or reversed?
The answer is MRV—Measurement, Reporting, and Verification. Without MRV, carbon markets collapse into greenwashing and mistrust. With MRV, they become a credible climate solution.
The 2025 Criteria for High-Quality Carbon Dioxide Removal makes MRV one of its central pillars. High-quality projects must measure transparently, report consistently, and verify independently.
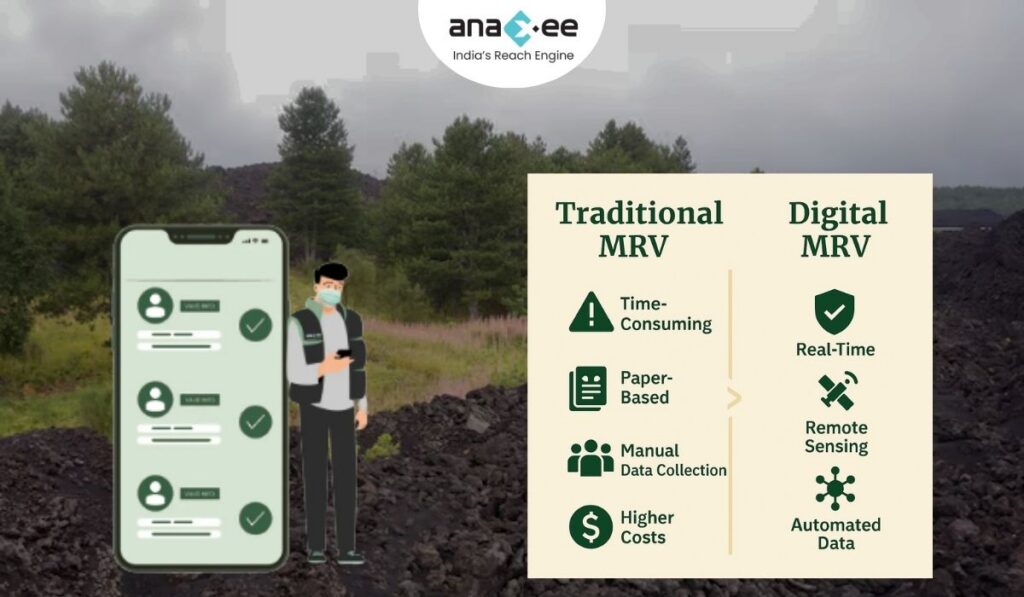
In India, where projects span millions of smallholders and diverse landscapes, this is even more critical. Traditional MRV methods—paper-based surveys, occasional audits—are too slow and prone to error. What’s needed is digital MRV (dMRV): scalable, transparent, and cost-effective.
That’s where Anaxee comes in.
What Is MRV in Carbon Projects?
MRV stands for:
Measurement – collecting accurate data on carbon removal or emissions reduction.
Reporting – documenting and sharing the data in a standardized format.
Verification – independent auditing to ensure credibility.
For example:
-In a soil carbon project, measurement involves soil sampling and remote sensing.
-Reporting involves compiling data into methodologies like Verra’s VM0047.
-Verification means third-party auditors checking data integrity.
Without these steps, credits are just promises on paper.
Why MRV Is So Challenging in India
India’s carbon opportunity is massive—but so are the MRV challenges:
-Scale: Millions of farmers across thousands of villages.
-Diversity: Crops, soils, and practices vary by region.
-Data Gaps: Smallholders often lack records or connectivity.
-Cost: Traditional MRV can eat up 30–40% of project revenues.
-Timeliness: Manual audits take months or years, delaying credits.
These challenges risk excluding smallholders or creating low-quality credits.
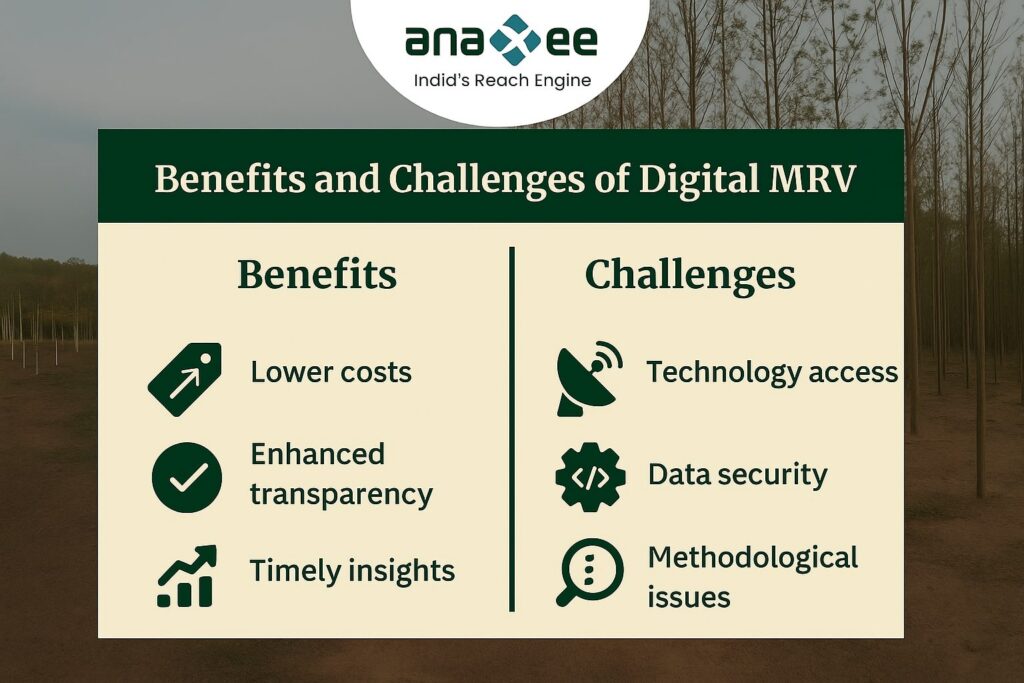
Digital MRV (dMRV): The Next Generation
Digital MRV uses technology to make monitoring real-time, scalable, and verifiable. Tools include:
-Remote Sensing: Satellite and drone imagery for land-use tracking.
-IoT Sensors: Soil moisture, carbon flux, and weather data.
-Mobile Apps: Farmer surveys, geotagged photos, and activity logs.
-AI & Machine Learning: Pattern recognition for crop and forest growth.
-Blockchain: Immutable reporting and transparent registries.
Together, these make MRV faster, cheaper, and more credible.
Why MRV Is a Pillar of High-Quality Carbon Removal
The 2025 Criteria for High-Quality CDR stress MRV for three reasons:
Integrity – ensuring every claimed tonne is real.
Transparency – buyers, auditors, and communities see the same data.
Durability – tracking projects over decades to prevent reversals.
MRV isn’t just a technical box to tick—it’s what separates a market built on trust from one riddled with greenwashing.
Anaxee’s dMRV: Tech-Enabled Trust at Scale
Anaxee has built a digital MRV ecosystem designed for India’s unique challenges:
-Reversal blind spots: missing when carbon is re-released.
Weak MRV undermines market trust. Buyers walk away, farmers lose out, and the climate suffers.
India’s Opportunity: Becoming a Hub for Transparent Credits
If India can solve MRV at scale, it can become the world’s hub for credible NbS credits. Global buyers increasingly demand transparency: Microsoft, Stripe, and Frontier all require rigorous MRV.
With dMRV, India can:
-Unlock farmer participation.
-Build buyer confidence.
-Reduce project costs.
-Position itself as a global leader in carbon credit quality.
Case Example: Bund Plantations + dMRV
In Anaxee’s bund plantation projects in Madhya Pradesh:
-Digital Runners record tree planting with geotagged photos.
-Satellites confirm survival and growth.
-AI models estimate biomass accumulation.
-Dashboards show transparent progress to buyers.
The result: credits that are traceable, auditable, and trusted.
Future of MRV: Beyond Compliance
MRV will evolve from being a compliance burden to a value creator:
-Farmers can use data for better crop management.
-Corporates gain brand trust through transparent offsets.
-Communities build resilience through shared monitoring.
Anaxee’s Climate Command Centre is already pioneering this future—linking MRV with community development, financial flows, and SDG impacts.
Conclusion: MRV as the Engine of Trust
Carbon markets live or die by trust. MRV is the engine of that trust. Without it, credits are empty promises. With it, credits become real climate action.
The 2025 Criteria for High-Quality CDR made this clear. For India, the challenge is scale and credibility. Anaxee’s dMRV shows how to bridge that gap—combining last-mile reach, digital tools, and transparent systems.
The future of carbon removal will be digital, transparent, and community-driven. Anaxee is already building it.
Partner with Anaxee to deploy scalable, transparent dMRV solutions in India’s carbon projects. Let’s build trust, credibility, and impact together.
About Anaxee:
Anaxee drives/develops large-scale, country-wide Climate and Carbon Credit projects across India. We specialize in Nature-Based Solutions (NbS) and community-driven initiatives, providing the technology and on-ground network needed to execute, monitor, and ensure transparency in projects like agroforestry, regenerative agriculture, improved cookstoves, solar devices, water filters and more. Our systems are designed to maintain integrity and verifiable impact in carbon methodologies.
Beyond climate, Anaxee is India’s Reach Engine- building the nation’s largest last-mile outreach network of 100,000 Digital Runners (shared, tech-enabled field force). We help corporates, agri-focused companies, and social organizations scale to rural and semi-urban India by executing projects in 26 states, 540+ districts, and 11,000+ pin codes, ensuring both scale and 100% transparency in last-mile operations. Connect with Anaxee at sales@anaxee.com
When we talk about climate solutions, the focus often goes to trees, solar panels, or electric vehicles. But there’s a silent climate ally right beneath us: soil.
Globally, soils store more carbon than the atmosphere and vegetation combined. Healthy soils are not just the backbone of agriculture; they are also a massive carbon sink. By adopting the right practices, farmers can draw down atmospheric carbon into soils—locking it away while boosting fertility, water retention, and resilience.
The 2025 Criteria for High-Quality CDR recognizes soil carbon as a key pathway, but with important caveats: measurement, durability, and community justice are critical.
For India—a country with over 150 million smallholder farmers—soil carbon is not just about climate. It’s about livelihoods, food security, and creating a new income stream through carbon finance.
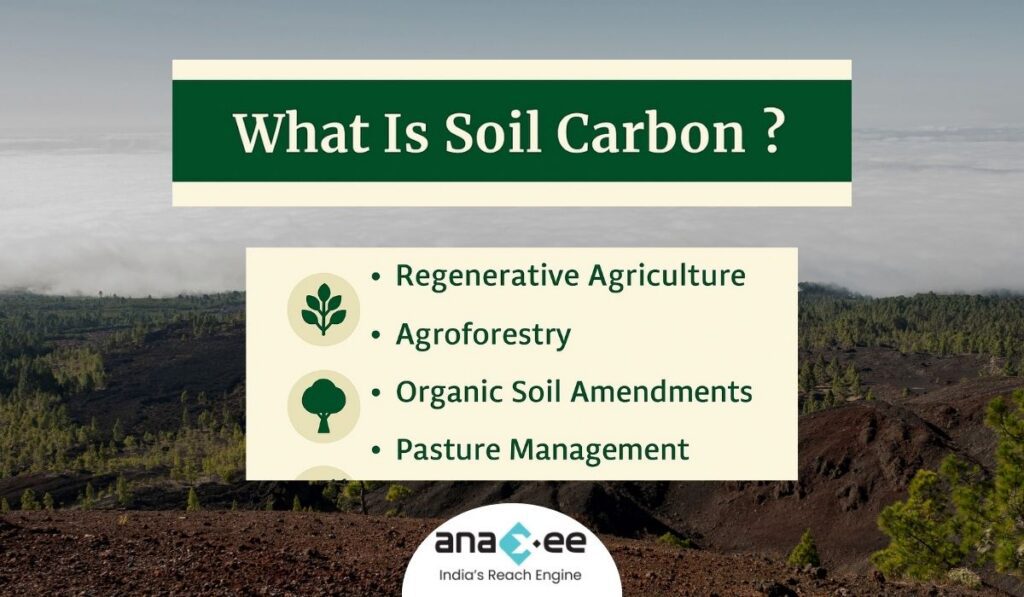
What Is Soil Carbon Removal?
Soil carbon removal involves changing land management practices so that more carbon is stored in soils. This can be achieved through:
-Organic soil amendments – compost, biochar, or enhanced rock weathering.
-Pasture management – rotational grazing that enhances soil cover.
These changes help soils absorb and retain more organic carbon, turning farms into climate-positive landscapes.
Why Soil Carbon Matters for India
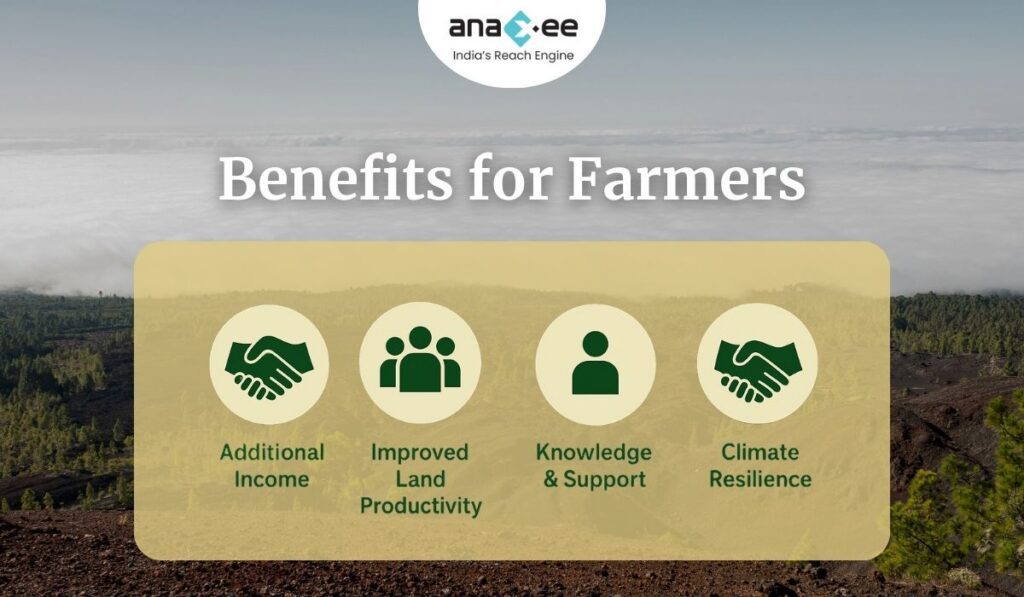
1. Agriculture Is Both Vulnerable and Powerful
Agriculture contributes to India’s emissions (methane, nitrous oxide), but it is also extremely vulnerable to climate change. Soil carbon projects can reverse degradation, improve yields, and build resilience.
2. Rural Livelihoods
Most Indian farmers operate on marginal lands with tight incomes. Soil carbon credits offer new revenue streams through global carbon markets—helping farmers while fighting climate change.
3. Scale
With millions of hectares of farmland, even modest improvements in soil carbon storage can translate into gigatonne-scale removals.
What Makes a High-Quality Soil Carbon Project?
According to the 2025 Criteria, soil carbon projects must meet strict benchmarks:
1. Social and Environmental Justice
-Ensure farmers are not locked into harmful contracts.
-Guarantee fair benefit-sharing from carbon revenues.
-Protect communities from risks like rising input costs.
2. Environmental Integrity
-Avoid overuse of fertilizers or chemicals that harm ecosystems.
-Promote biodiversity, soil health, and water retention.
3. Additionality and Baselines
-Show that soil practices would not have been adopted without carbon finance.
-Set conservative baselines that account for natural regeneration.
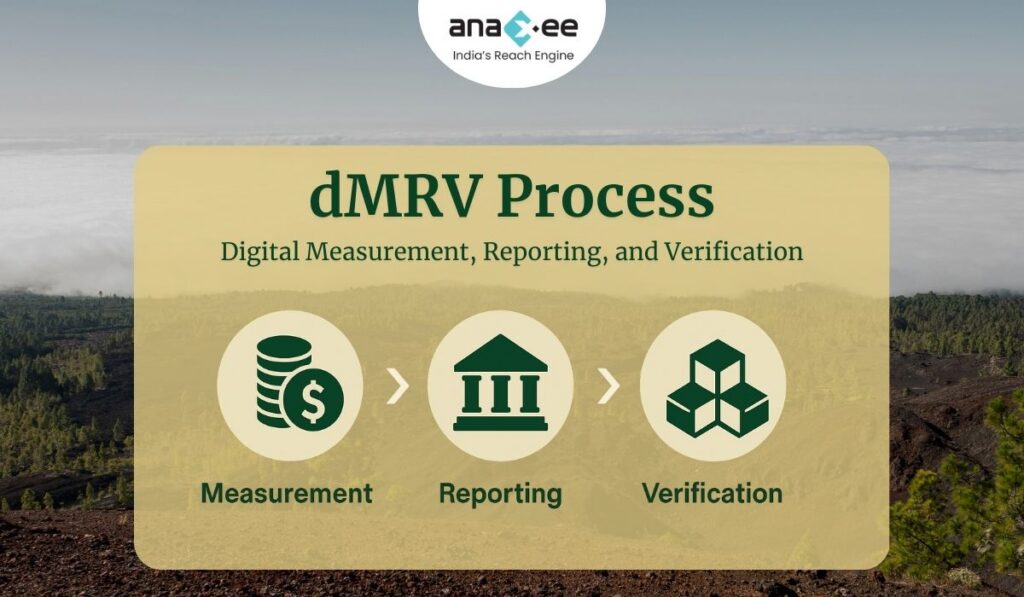
4. MRV (Measurement, Reporting, Verification)
-Use peer-reviewed models and direct sampling.
-Monitor soil carbon changes with scientific rigor.
-Combine field sampling with remote sensing for accuracy.
5. Durability
-Soil carbon is reversible—droughts, floods, or practice abandonment can release carbon. Projects must plan for long-term adoption and risk mitigation.
6. Leakage
-Prevent displacement of practices—e.g., if reduced tillage here leads to over-tillage elsewhere.
The Challenges in Soil Carbon
Soil carbon is powerful but tricky:
-Measurement Uncertainty – detecting small year-to-year changes is scientifically challenging.
-Permanence Risks – carbon can be re-released if practices stop.
-Farmer Adoption – smallholders may hesitate without upfront support.
-Market Trust – buyers worry about inflated or unverifiable credits.
This is why soil carbon must be implemented with robust MRV, long-term planning, and community-first approaches.
Anaxee’s Approach to Soil Carbon in India
Anaxee is working to make soil carbon projects credible, scalable, and farmer-friendly. Here’s how:
1. Farmer-Centric Model
-Farmers are partners, not just participants.
-We ensure clear contracts and transparent revenue sharing.
-We provide training in regenerative practices so benefits last beyond credits.
2. Digital MRV
-Our dMRV system combines:
Soil sampling protocols.
Remote sensing and satellite data.
Mobile-based farmer reporting (via Digital Runners).
-This ensures every tonne of soil carbon is traceable and verifiable.
3. Risk Mitigation
-Long-term engagement: multi-year contracts to prevent reversals.
-Blended portfolios: combining soil projects with agroforestry for durability.
-Early warning systems for risks like droughts.
4. Scale and Reach
-With 40,000+ Digital Runners across 26 states, we can engage farmers at scale.
-From Bund plantations in central India to regenerative farming in Punjab, Anaxee ensures projects are grounded in local context.
Soil Carbon and Global Carbon Markets
Buyers like Microsoft, Stripe, and Frontier are seeking high-quality removals—not just offsets. Soil carbon, if implemented well, can meet this demand.
However, buyers demand:
-Transparency in MRV.
-Durability guarantees.
-Clear community benefits.
By embedding the 2025 Criteria, Anaxee ensures Indian soil carbon projects meet global expectations while delivering local impact.
Case Example: Bund Plantations with Soil Benefits
In Madhya Pradesh, Anaxee has been implementing bund plantations (tree planting along farm bunds). These projects not only sequester carbon in trees but also:
-Reduce soil erosion.
-Improve water retention.
-Enhance soil organic matter.
Farmers see higher yields, lower risks, and additional carbon revenue—a model that aligns with soil carbon criteria while benefiting communities.
India’s Role in Scaling Soil Carbon
Globally, soil carbon is seen as one of the most scalable and affordable CDR solutions. For India:
-The sheer scale of agriculture makes it a climate opportunity.
-Programs like National Mission for Sustainable Agriculture can align with soil carbon.
-Carbon finance can create new rural economies.
The challenge is ensuring projects are high-quality, transparent, and durable. That’s the gap Anaxee fills.
Conclusion: Soil Carbon as India’s Climate and Rural Opportunity
Soil carbon is more than a climate tool—it’s a bridge between global carbon markets and local livelihoods. Done right, it improves soils, strengthens food systems, and rewards farmers while delivering credible removals.
But the “done right” is key. Without robust MRV, durability, and justice, soil carbon risks becoming another failed promise. With frameworks like the 2025 Criteria for High-Quality CDR, we now have the roadmap.
Anaxee is bringing that roadmap to life in India—combining tech, trust, and last-mile execution to ensure soil carbon projects are globally credible and locally transformative.
The future of climate action lies beneath our feet. It’s time we nurture it.
👉 Call to Action Partner with Anaxee to unlock India’s soil carbon potential. Together, we can build credible, farmer-first, and globally trusted carbon projects.
About Anaxee:
Anaxee drives/develops large-scale, country-wide Climate and Carbon Credit projects across India. We specialize in Nature-Based Solutions (NbS) and community-driven initiatives, providing the technology and on-ground network needed to execute, monitor, and ensure transparency in projects like agroforestry, regenerative agriculture, improved cookstoves, solar devices, water filters and more. Our systems are designed to maintain integrity and verifiable impact in carbon methodologies.
Beyond climate, Anaxee is India’s Reach Engine- building the nation’s largest last-mile outreach network of 100,000 Digital Runners (shared, tech-enabled field force). We help corporates, agri-focused companies, and social organizations scale to rural and semi-urban India by executing projects in 26 states, 540+ districts, and 11,000+ pin codes, ensuring both scale and 100% transparency in last-mile operations. Connect with Anaxee at sales@anaxee.com
The climate clock is ticking. The IPCC’s AR6 report is clear: reducing emissions alone will not keep us under the 1.5°C threshold. Alongside decarbonization, the world must actively remove between 100–1000 billion tonnes of CO₂ by 2100. That means by 2050, we need 5–10 billion tonnes of carbon removed annually.
But not all carbon removal is created equal. Many projects claim removals, yet face problems—weak baselines, double counting, lack of monitoring, or poor durability. This is why the 2025 Criteria for High-Quality Carbon Dioxide Removal was published—to set clear principles that ensure credibility, durability, and justice in the CDR industry.
For India, where millions depend on land, forests, and agriculture, ensuring quality in carbon projects is not just about climate—it is about livelihoods, ecosystems, and trust. And that’s where Anaxee steps in.
2. What Makes CDR “High-Quality”?
The 2025 criteria highlight seven essential pillars that define quality in carbon removal projects:
Social and Environmental Justice – projects must avoid harms and deliver fair benefits to local communities.
Environmental Integrity – protecting biodiversity, soil health, and water.
Additionality and Baselines – removals must be real and beyond business-as-usual.
Durability – ensuring captured carbon stays out of the atmosphere for decades or centuries.
Leakage Control – avoiding displacement of emissions elsewhere.
Effective Project Management – governance, transparency, and accountability.
Without these principles, carbon projects risk becoming “paper credits”—numbers that look good for corporate reporting but fail to deliver real climate impact.
3. Nature-Based vs. Engineered CDR
The report covers both nature-based (forestation, mangroves, soil carbon, agroforestry, rock weathering) and engineered methods (direct air capture, mineralization, biomass with storage).
-Nature-based solutions (NbS): cost-effective, co-benefits like biodiversity and livelihoods, but challenges in durability and MRV.
-Engineered solutions: durable storage, but expensive and limited in scale today.
In India, the immediate opportunity lies in NbS—where rural landowners, farmers, and communities can participate, provided projects follow high-quality criteria.
4. The Risk of Low-Quality Carbon Projects
A growing criticism of carbon markets is the prevalence of low-quality credits:
-Plantations in wrong ecosystems (biodiversity loss).
-Short-term projects that collapse after a few years.
-Lack of consent or benefit-sharing with communities.
-Inflated baselines that exaggerate impact.
Such failures create reputational risk for buyers and resentment among communities. Worse, they delay real climate action. That’s why frameworks like the 2025 Criteria matter—they separate meaningful carbon removals from greenwashing.
5. How Anaxee Adds Value in High-Quality CDR
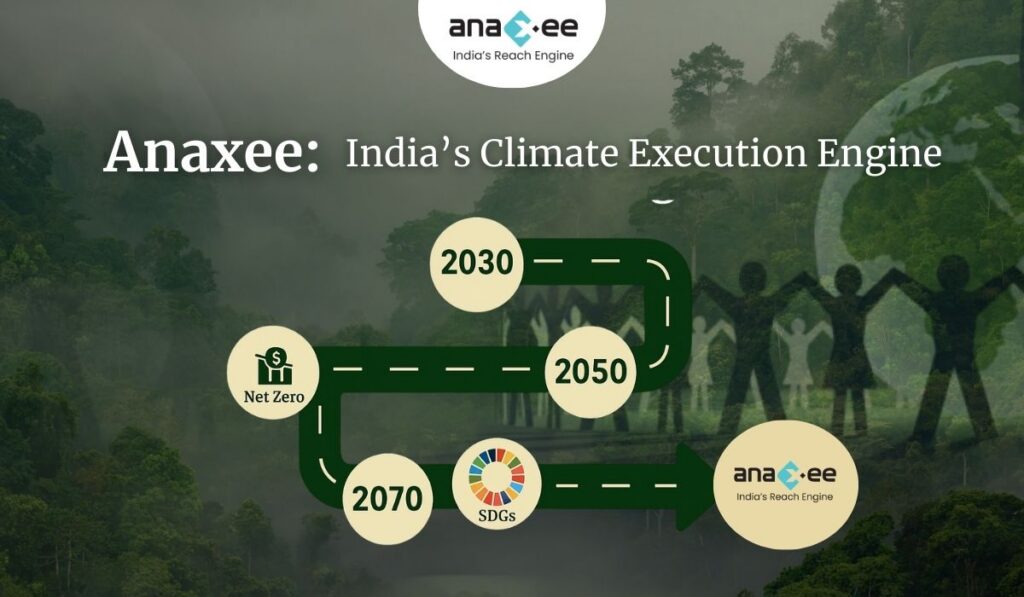
Anaxee is positioning itself as India’s Climate Execution Engine, ensuring projects meet the highest global benchmarks. Here’s how:
-Last-Mile Reach: With 40,000+ Digital Runners across 26 states, Anaxee mobilizes rural communities at scale for afforestation, soil carbon, and agroforestry projects.
-dMRV Tools: In-house apps, geotagging, and AI-driven verification ensure transparent and traceable monitoring of every tree, farm, and intervention.
-Community-Centered Models: Farmers and landowners are direct beneficiaries—through revenue share, training, and alternative livelihoods.
-Transparency & Compliance: Projects align with Verra (VM0047, ARR, Soil Carbon), Gold Standard, and now emerging high-quality CDR criteria.
In short, Anaxee bridges the gap between global buyers demanding quality and local communities implementing projects on the ground.
6. India’s Role in the Global CDR Market
Globally, companies like Microsoft are already purchasing millions of tonnes of removals, For India, this creates an economic opportunity:
-Farmers and rural communities can access carbon finance.
-Corporates can meet CCTS (Carbon Credit Trading Scheme) compliance and voluntary commitments.
-India can position itself as a hub for NbS carbon credits, provided the projects are high-quality.
Anaxee’s role is to ensure India’s carbon projects are not just cheap offsets, but globally credible removals that meet durability, MRV, and justice standards.
7. The Road Ahead: Scaling Quality, Not Just Quantity
Scaling CDR is not just about planting millions of trees—it’s about doing it right. The future of the carbon market depends on trust. That means:
-Buyers must demand high-quality removals only.
-Developers must invest in dMRV and transparent reporting.
-Communities must be equal partners in the climate economy.
Anaxee’s Climate Command Centre, community-first models, and tech-driven transparency offer a template for how India can scale CDR without repeating past mistakes.
8. Conclusion
High-quality carbon removal is no longer optional—it is the foundation of credible climate action. The 2025 criteria give the world a common yardstick. For India, the challenge is turning these principles into practice at scale.
Anaxee is already doing this—by combining tech, trust, and last-mile reach to deliver projects that remove carbon, support communities, and stand up to global scrutiny.
The climate challenge is massive, but with quality, transparency, and collaboration, India can be a leader in the next generation of carbon removal.
About Anaxee:
Anaxee drives large-scale, country-wide Climate and Carbon Credit projects across India. We specialize in Nature-Based Solutions (NbS) and community-driven initiatives, providing the technology and on-ground network needed to execute, monitor, and ensure transparency in projects like agroforestry, regenerative agriculture, improved cookstoves, solar devices, water filters and more. Our systems are designed to maintain integrity and verifiable impact in carbon methodologies.
Beyond climate, Anaxee is India’s Reach Engine- building the nation’s largest last-mile outreach network of 100,000 Digital Runners (shared, tech-enabled field force). We help corporates, agri-focused companies, and social organizations scale to rural and semi-urban India by executing projects in 26 states, 540+ districts, and 11,000+ pin codes, ensuring both scale and 100% transparency in last-mile operations. Connect with Anaxee at sales@anaxee.com
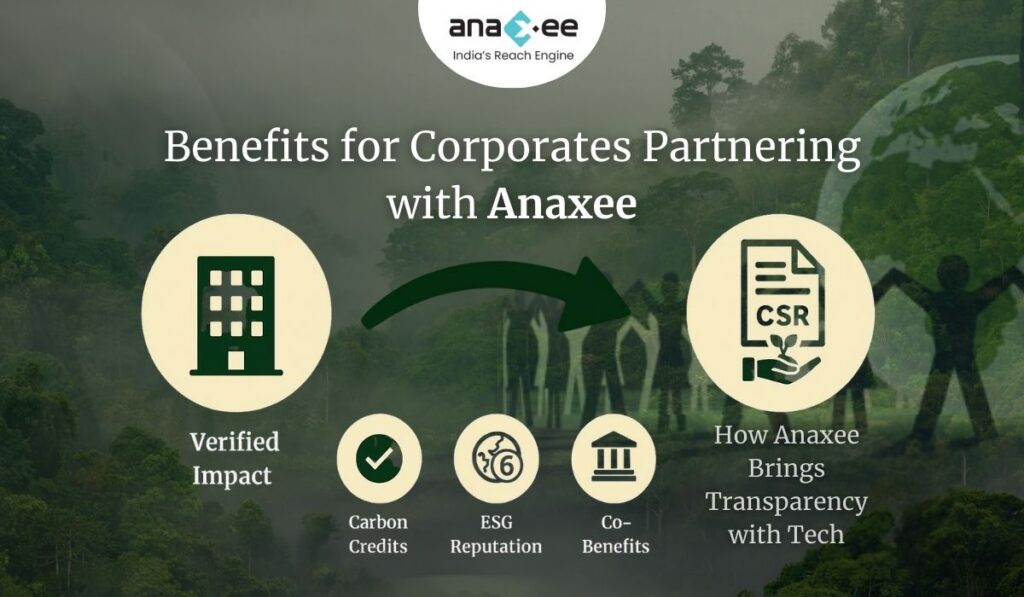
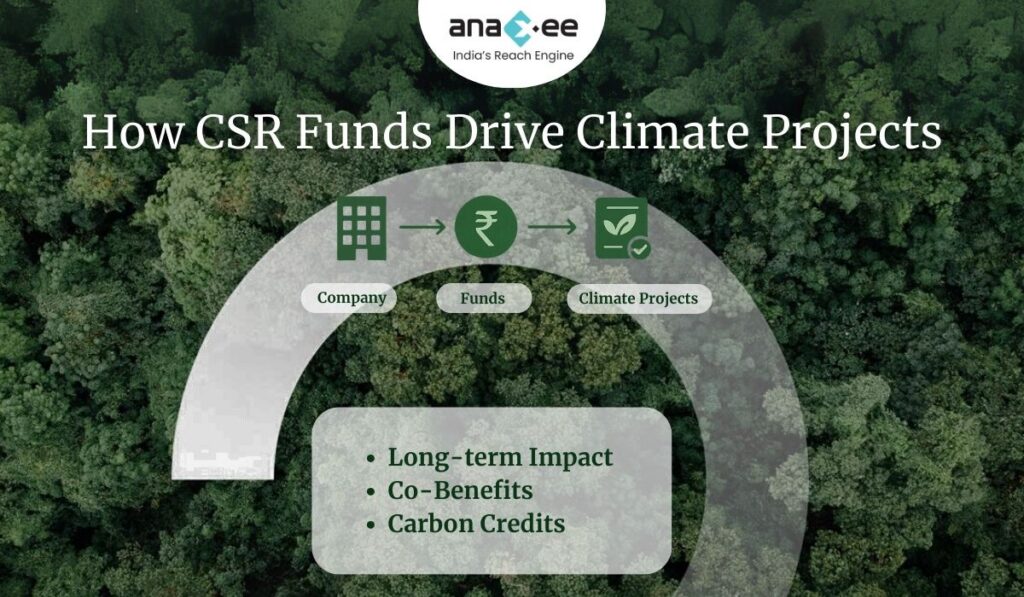
India has emerged as a global pioneer in Corporate Social Responsibility (CSR) by making it mandatory under the Companies Act, 2013. Each year, thousands of crores flow into CSR initiatives, touching lives across education, health, livelihood, environment, and community development.
But when it comes to climate and carbon-linked CSR projects, the picture is less inspiring. While companies are increasingly allocating funds to environmental projects, questions persist:
-Do corporates have real-time visibility into how projects are performing?
-Are NGOs empowered enough to implement long-term, carbon-accounted projects?
The reality is stark. Most CSR projects struggle with short-term focus, dependency on NGOs with limited resources, and lack of robust monitoring systems. As a result, transparency and credibility—the two pillars of impactful climate action—are often missing.
This is where Anaxee Digital Runners Pvt. Ltd. is changing the narrative. Positioned at the intersection of tech, community reach, and climate action, Anaxee offers a new model of CSR execution—one that makes climate projects transparent, scalable, and accountable.
The Shift: From Welfare CSR to Climate CSR
Traditionally, CSR in India has been focused on welfare projects—schools, hospitals, skill training, community services. These are important, but with the mounting urgency of the climate crisis, the corporate focus is shifting.
-Companies are expected to go beyond welfare and invest in sustainability.
-Climate-linked CSR is becoming part of ESG reporting and net-zero commitments.
-Regulators and stakeholders are pushing for measurable outcomes—not just good intentions.
Yet, many corporates face a gap. They want to invest CSR money into climate projects but lack credible, transparent partners who can bridge the gap between corporate boardrooms and rural landscapes where these projects take root.
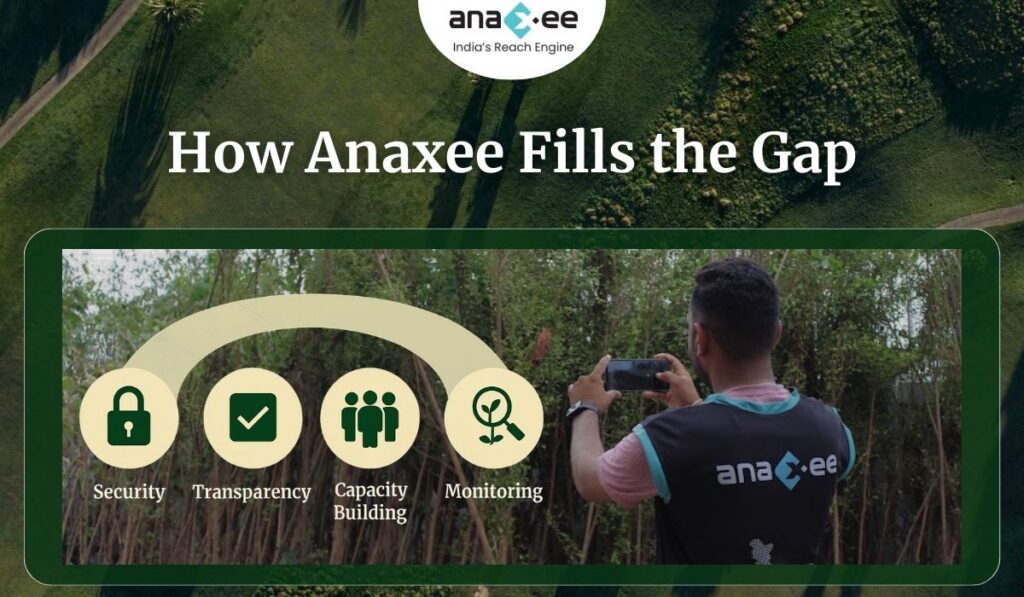
Anaxee fills this gap.
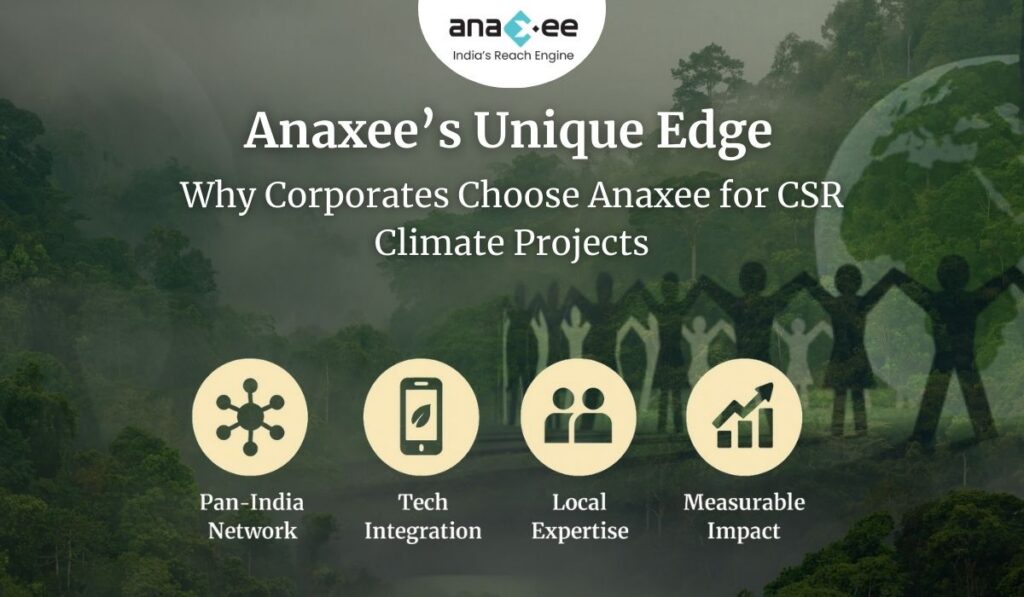
Anaxee’s Unique Position in the CSR-Climate Space
Anaxee is not just another implementation partner. It is a tech-enabled climate execution engine with unmatched last-mile reach across India.
Here’s what sets Anaxee apart:
Nationwide Reach
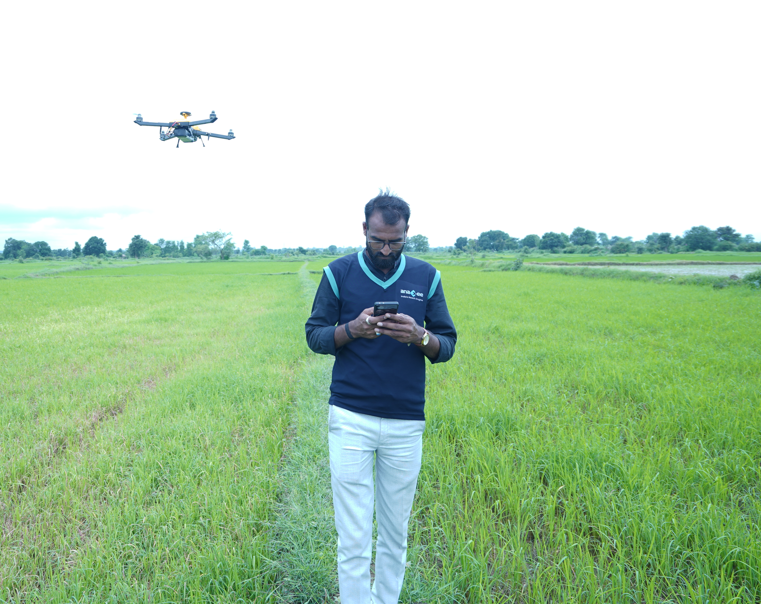
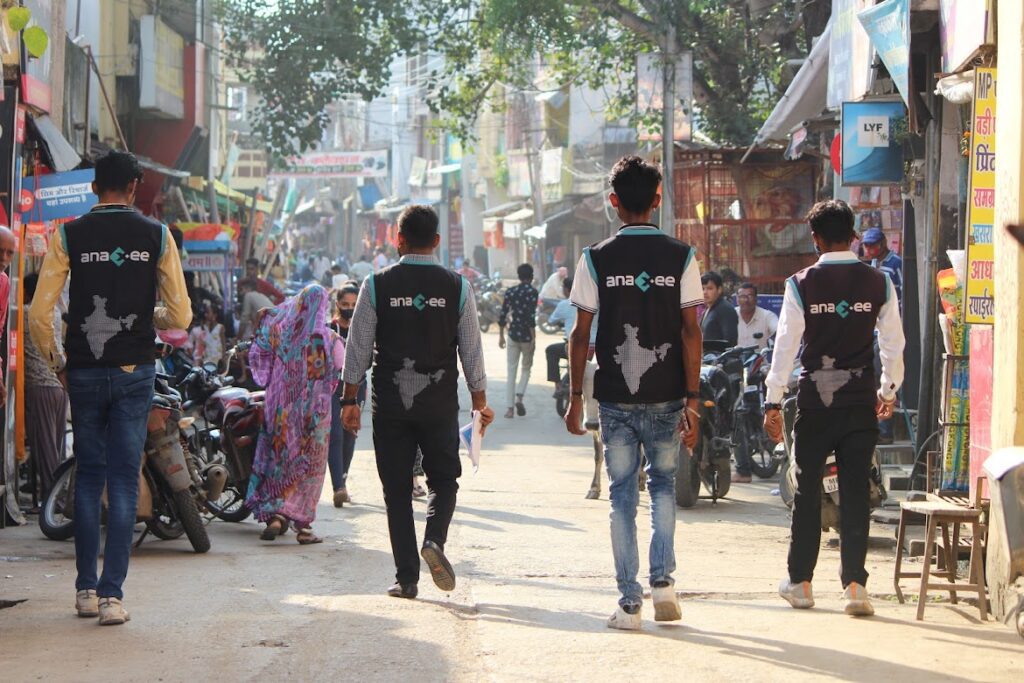
With a network of 40,000+ Digital Runners, Anaxee has the capacity to execute projects in remote villages, tribal areas, and Tier-3 towns—where climate action truly matters.
This grassroots presence ensures authentic community engagement and trusted local participation.
Tech-Driven Execution
Anaxee integrates digital monitoring, reporting, and verification (dMRV) tools into every CSR project.
Real-time dashboards give corporates visibility into where their funds are going and what impact is being created.
Proven Track Record
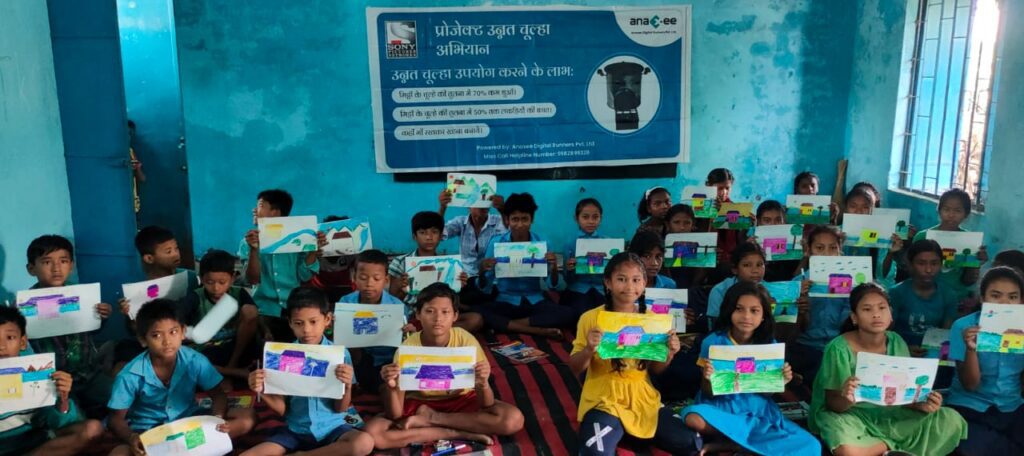
From Clean cooking initiatives to agroforestry bund plantations under VM0047, Anaxee has delivered climate impact with social co-benefits.
Unlike NGOs struggling with scale, Anaxee can run multiple large-scale projects simultaneously.
Bridging NGO Gaps
NGOs bring local trust and mobilization power, but lack tech, carbon expertise, and roadmaps.
Anaxee empowers NGOs with technology, training, and transparent processes—making them more effective partners.
In short, Anaxee is the missing link between corporate CSR funds, NGOs, and transparent carbon outcomes.
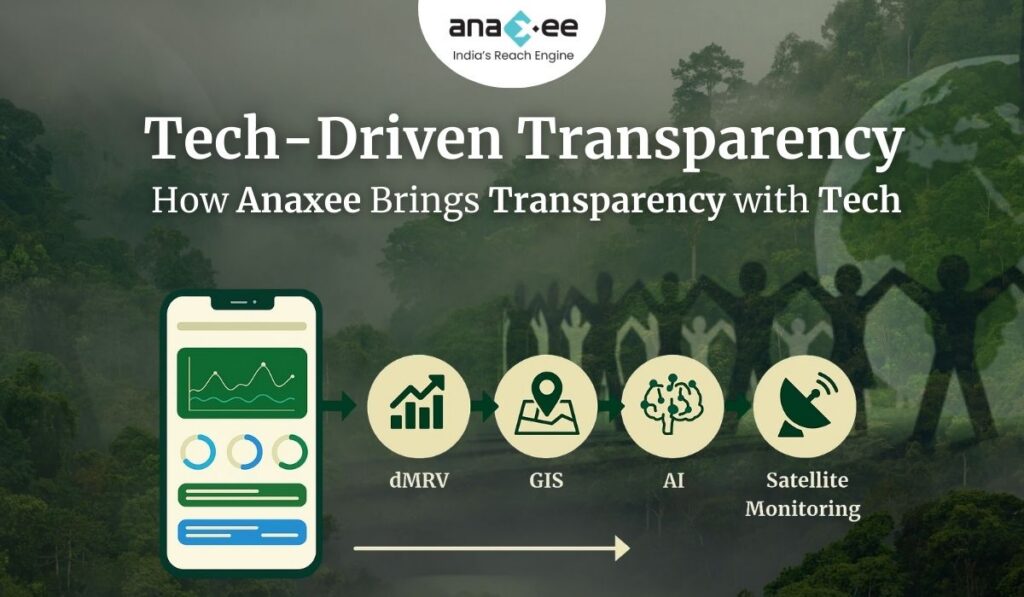
Bringing Transparency with Tech
The biggest challenge in CSR is trust. Companies often struggle to prove that:
-CSR funds were used as intended.
-The claimed impact is real and measurable.
-The benefits go beyond tokenism to long-term climate goals.
Anaxee addresses this through technology.
1. dMRV Tools for CSR and Carbon Projects
-Digital data collection through mobile apps.
-Geo-tagged photos, videos, and records.
-Automated carbon accounting integrated with project data.
2. Real-Time Dashboards for Corporates
-Corporates can log in and see project progress in real-time.
-Metrics like trees planted, survival rates, carbon sequestered, households impacted are visible at a click.
3. GIS and Satellite Integration
-Projects are cross-verified with remote sensing data.
-This eliminates false claims and ensures verifiable impact.
4. AI-Powered Monitoring
-Predictive analytics help corporates understand long-term project impact.
-Issues like sapling survival, resource gaps, or community participation can be addressed proactively.
This tech backbone makes Anaxee’s CSR projects auditable, transparent, and investor-grade.
Empowering NGOs Through Capacity Building
NGOs remain critical in India’s climate story. They are the ones who connect with communities, mobilize local participation, and create awareness. But they face limitations:
-Limited resources and manpower.
-Minimal exposure to carbon methodologies like VM0047.
-No 15–20-year roadmap planning.
-Lack of tech-enabled monitoring.
Anaxee doesn’t bypass NGOs—it empowers them.
-Training programs on climate project implementation.
-Digital tools to record and report their activities.
-Capacity building for long-term planning.
-Integration into carbon markets where NGOs couldn’t participate alone.
By partnering with Anaxee, NGOs are strengthened, not sidelined. They continue to bring local trust while Anaxee ensures transparency and scalability.
Corporates can communicate authentic stories to stakeholders.
Builds credibility with investors, regulators, and customers.
Carbon Credit Potential
CSR funds can unlock long-term carbon credits for corporates.
This positions them ahead of compliance requirements like India’s Carbon Credit Trading Scheme (CCTS).
Long-Term Vision: Anaxee as India’s Climate Execution Engine
Anaxee is not solving for one CSR cycle. It is building the execution backbone for India’s climate action.
-Scaling CSR into carbon markets: Turning CSR spends into verified carbon assets.
-Aligning with India’s Net Zero 2070: Supporting corporates in meeting national targets.
-Global recognition: Positioning Indian CSR projects as credible contributors in the voluntary carbon market.
With its blend of tech, grassroots execution, and NGO empowerment, Anaxee is uniquely placed to become India’s climate execution engine.
Conclusion: Partner with Anaxee for Transparent CSR Climate Projects
The future of CSR is climate-linked, transparent, and accountable. Corporates can no longer afford token projects—they need real impact backed by data.
NGOs alone cannot ensure this. Corporates alone cannot reach villages. But with Anaxee, CSR funds can:
-Empower NGOs.
-Deliver measurable climate outcomes.
-Align with ESG and net-zero goals.
-Build credibility in carbon markets.
Anaxee is where CSR meets transparency, where technology meets community, and where corporates meet climate action.
About Anaxee: Anaxee drives large-scale, country-wide Climate and Carbon Credit projects across India. We specialize in Nature-Based Solutions (NbS) and community-driven initiatives, providing the technology and on-ground network needed to execute, monitor, and ensure transparency in projects like agroforestry, regenerative agriculture, improved cookstoves, solar devices, water filters and more. Our systems are designed to maintain integrity and verifiable impact in carbon methodologies.
Beyond climate, Anaxee is India’s Reach Engine- building the nation’s largest last-mile outreach network of 100,000 Digital Runners (shared, tech-enabled field force). We help corporates, agri-focused companies, and social organizations scale to rural and semi-urban India by executing projects in 26 states, 540+ districts, and 11,000+ pin codes, ensuring both scale and 100% transparency in last-mile operations. Connect with Anaxee at sales@anaxee.com
Why Empowering NGOs with Tech and Long-Term Roadmaps is Key to Transparent Carbon Projects
Introduction
In India’s climate action journey, one actor appears repeatedly in conversations about Corporate Social Responsibility (CSR) and sustainability: the NGO. These non-governmental organizations connect corporates with communities, drive awareness, and mobilize action at the grassroots level. They are indispensable. But here’s the uncomfortable truth: NGOs alone cannot deliver the transparency and integrity that climate and carbon projects demand.
Corporates today are increasingly channeling CSR funds into climate projects—tree plantations, renewable initiatives, sustainable agriculture, and more. The goal isn’t just goodwill; it’s long-term climate impact, often linked with measurable outcomes like carbon credits. And that’s where the challenge lies: while NGOs can plant trees and train communities, they are not equipped to handle 20-year project cycles, digital MRV systems, or international carbon standards.
The way forward isn’t to sideline NGOs but to empower them—with technology, with training, and with roadmaps that extend decades into the future. This empowerment is the only way to ensure that CSR-driven climate projects are not just symbolic but transparent, credible, and measurable.
The Current Reality of NGO-Led CSR Climate Projects
For decades, NGOs have been the backbone of CSR initiatives in rural India. They organize tree plantation drives, run awareness campaigns, support water conservation, and provide basic environmental education. Their strength lies in their deep community ties and ability to mobilize people at short notice.
However, CSR-linked climate projects require far more than goodwill and community trust. They demand:
-Long-term project continuity (15–20 years).
-Monitoring, reporting, and verification (MRV) aligned with international standards like Verra or Gold Standard.
-Transparency mechanisms that corporates can showcase to investors and regulators.
Most NGOs lack the resources, skills, and frameworks to deliver on these requirements. They are structured for short-term projects—a 3-year grant cycle, a 5-year funding program—not for projects spanning two decades.
The result? Many CSR climate projects end up as one-off activities: trees planted but not maintained, awareness drives conducted without follow-up, carbon benefits claimed but never measured. Corporates spend, NGOs implement, but long-term transparency is lost.
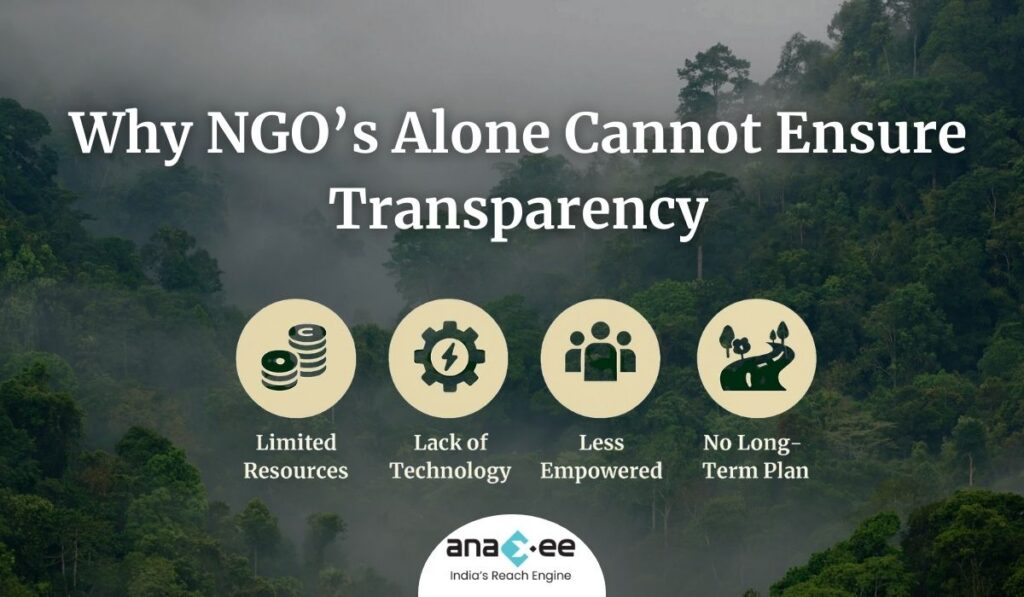
Why NGOs Alone Cannot Ensure Transparency
There is a tendency to romanticize NGOs as the guardians of community trust. While they indeed bring authenticity at the grassroots, relying on NGOs without empowerment risks undermining CSR climate projects.
Key Limitations:
Limited Technical Knowledge
NGOs understand people, not carbon accounting. They cannot design projects compliant with methodologies like VM0047 or REDD+ standards.
Weak Data Systems
Monitoring is often reduced to photographs and anecdotal reports. This does not pass the scrutiny of auditors or carbon markets.
Short-Term Orientation
NGOs operate on grant cycles. A carbon project needs a 20-year roadmap—something most NGOs simply don’t plan for.
Resource Constraints
Lack of funding, digital tools, and trained personnel means NGOs are stretched thin.
Fragmented Operations
With thousands of small NGOs working in silos, consistency and standardization become impossible.
In summary: NGOs are necessary but insufficient. They bring the human element but cannot guarantee transparency or long-term accountability by themselves.
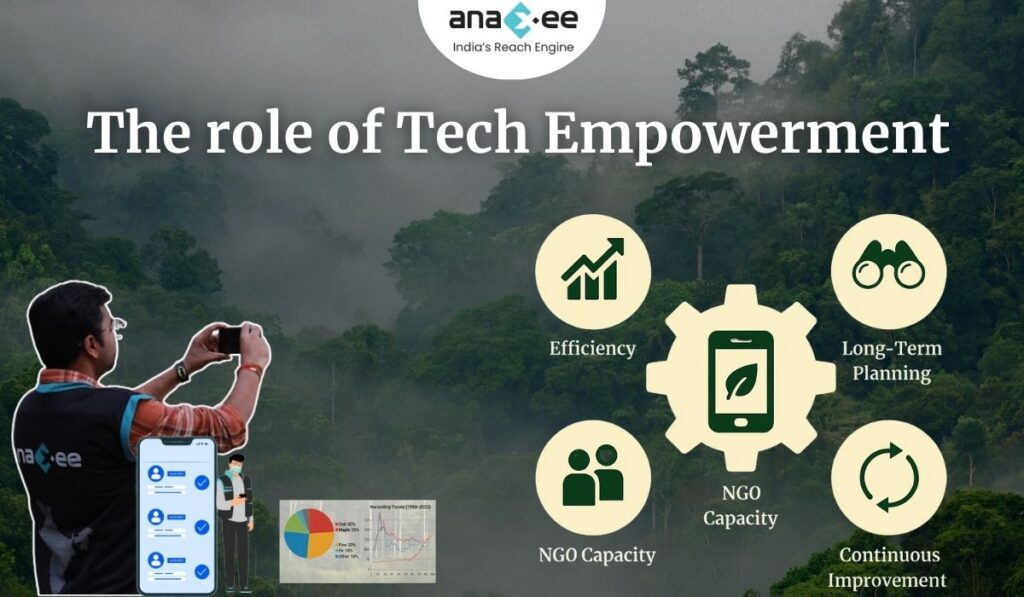
The Case for Tech-Enabled Empowerment
If NGOs cannot deliver transparency alone, how do we bridge the gap? The answer lies in technology-driven empowerment.
Digital MRV (Monitoring, Reporting, Verification)
Carbon projects require robust MRV systems to track growth, sequestration, and community benefits. Tech tools like mobile apps, satellite monitoring, and IoT devices allow data collection in real time. When NGOs are trained to use these tools, they transform from facilitators into credible data partners.
Dashboards and Transparency Layers
Corporates need evidence of impact—number of trees planted, carbon captured, livelihoods improved. Digital dashboards offer exactly that, creating a transparent pipeline of data from ground to boardroom.
Training & Standardization
Empowering NGOs with standard operating procedures (SOPs), carbon methodology training, and consistent reporting frameworks ensures their work can integrate into global carbon markets.
Verification Integration
With digital tools, NGOs can become part of third-party verification processes, ensuring that their contributions are measurable and independently verifiable.
In short: tech makes NGOs not just community connectors but pillars of transparency.
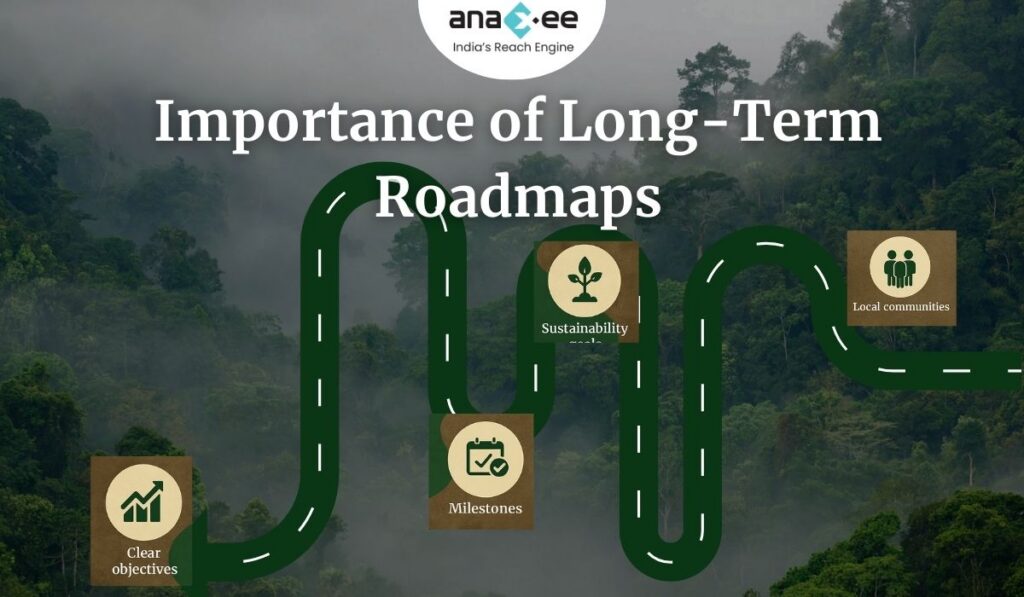
The Importance of Long-Term Roadmaps
A CSR-funded carbon project is not an event. It is a commitment. For trees planted today to sequester meaningful carbon, they need to survive and thrive for decades. For farmers adopting agroforestry, the benefits unfold over years, not months.
Why Long-Term Roadmaps Matter:
-Carbon Credit Validation: Markets require 15–20 year projections, not 2-year activity reports.
-Community Trust: Villagers will only stay engaged if they see consistent support over time.
-Corporate Accountability: Investors and regulators will demand evidence of ongoing impact.
-Financial Viability: Without long-term planning, projects cannot generate or sustain carbon credits.
Most NGOs don’t think beyond their current funding cycle. Empowerment means equipping them with roadmaps aligned with CSR strategies and carbon market expectations.
How Empowerment Improves Community Impact
Empowering NGOs isn’t just about satisfying corporate auditors. It creates real change at the community level.
-Better Training: Fieldworkers equipped with tech tools can teach farmers smarter agroforestry practices, not just distribute seedlings.
-Livelihood Security: When projects are linked to long-term carbon credits, communities gain stable income streams.
-Awareness Continuity: Education isn’t a one-off workshop; it becomes an ongoing dialogue.
-Trust Building: Transparency tools reduce skepticism among villagers, as they see their efforts measured and valued.
In essence, empowerment multiplies the impact of every CSR rupee spent.
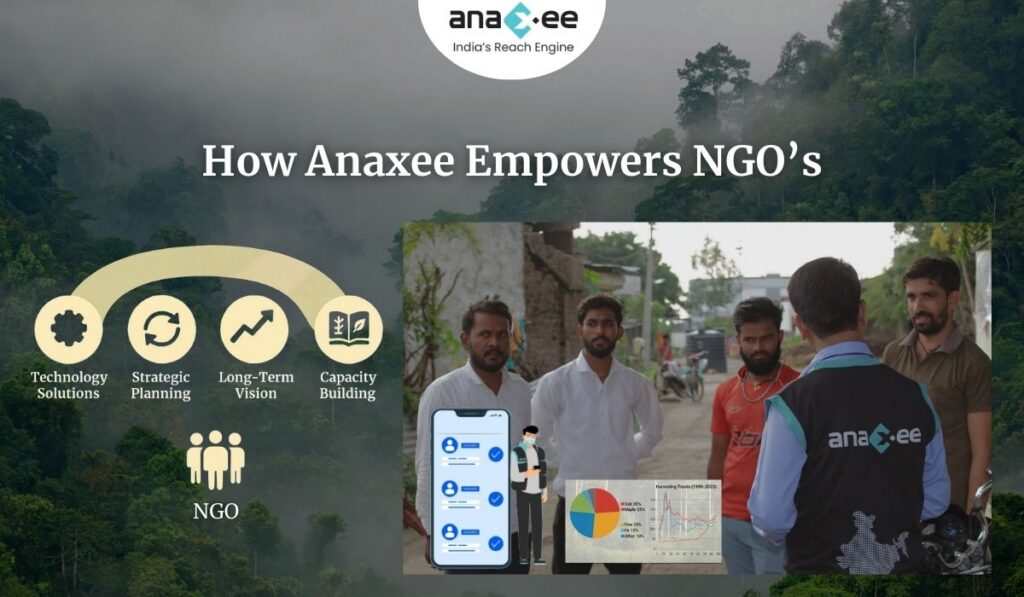
Anaxee’s Approach to Empowering NGOs
At Anaxee, we’ve recognized both the strengths and weaknesses of NGOs in climate projects. Our model is designed to empower, not replace.
How We Do It:
Digital Runners Network
With 40,000+ Digital Runners across India, we provide NGOs with last-mile data collection capabilities.
dMRV Tools
Our digital monitoring systems feed real-time project data into transparent dashboards corporates can access anytime.
Training Modules
We train NGO staff in carbon methodologies, ensuring their activities align with global standards.
Roadmap Design
Projects are structured for 15–20 years, integrating NGOs into sustainable, long-term frameworks.
Integrity Backbone
Corporates can rest assured their CSR funds are producing measurable, verifiable climate outcomes.
Through this approach, Anaxee turns NGOs into empowered partners, ensuring that CSR projects scale with integrity.
The Future: CSR, NGOs, and Transparent Carbon Credits
Looking ahead, CSR in climate will only grow. Indian corporates are under increasing pressure from investors, regulators, and global markets to prove their climate credentials. Spending CSR funds is not enough. Showing results with transparency will be the new benchmark.
In this future:
-NGOs will remain critical connectors to communities.
-Empowered NGOs will deliver measurable climate outcomes.
-Corporates will demand data-backed evidence of impact.
-Partners like Anaxee will provide the frameworks to make it all possible.
Without empowerment, NGOs risk being sidelined as corporates look elsewhere. With empowerment, they will remain central to India’s climate transformation.
Key Takeaways for Corporates & Investors
-Don’t hand over CSR climate projects to NGOs without a support system.
-Empower NGOs with tech tools, training, and long-term roadmaps.
-Demand transparency—not just activity reports, but verifiable data.
-Partner with organizations like Anaxee that act as the integrity backbone.
Because in the end, climate action is not about planting trees for photos. It’s about building trust, transparency, and measurable impact that lasts for decades.
About Anaxee:
Anaxee drives large-scale, country-wide Climate and Carbon Credit projects across India. We specialize in Nature-Based Solutions (NbS) and community-driven initiatives, providing the technology and on-ground network needed to execute, monitor, and ensure transparency in projects like agroforestry, regenerative agriculture, improved cookstoves, solar devices, water filters and more. Our systems are designed to maintain integrity and verifiable impact in carbon methodologies.Beyond climate, Anaxee is India’s Reach Engine- building the nation’s largest last-mile outreach network of 100,000 Digital Runners (shared, tech-enabled field force). We help corporates, agri-focused companies, and social organizations scale to rural and semi-urban India by executing projects in 26 states, 540+ districts, and 11,000+ pin codes, ensuring both scale and 100% transparency in last-mile operations. Connect with Anaxee at sales@anaxee.com
How Indian Corporates are Using CSR to Drive Climate Action—and What’s Missing
Corporate Social Responsibility (CSR) in India is no longer about one-off charity drives or building local infrastructure. Increasingly, corporates are realizing that their CSR budgets can become powerful tools for climate action. From reforestation and renewable energy to waste management and carbon projects, the shift is happening. But while the intent is clear, the missing link is transparency and accountability—something that current CSR approaches often overlook.
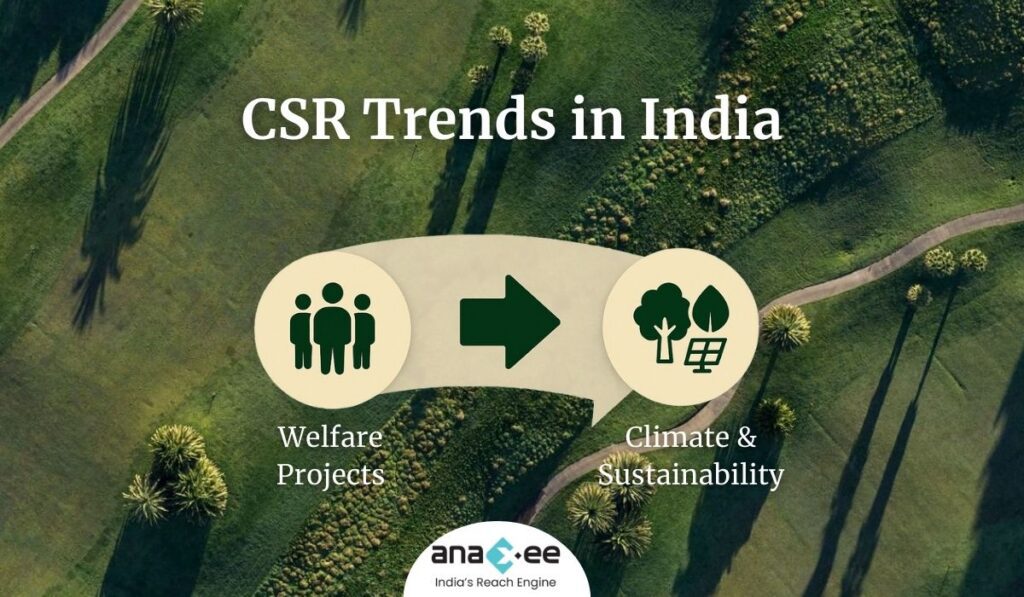
The CSR Landscape in India
When CSR spending became mandatory in 2014 under the Companies Act, Indian corporates scrambled to comply. Initial projects were largely focused on education, health, or welfare—important, but short-term. Over the past decade, however, there’s been a clear pivot toward sustainability and climate-focused CSR. Some key trends: -Tree planting drives have expanded into large-scale agroforestry and reforestation initiatives. -Renewable energy CSR supports solar electrification of rural schools and communities. -Waste management and circular economy initiatives are now core CSR programs. -Carbon offset-linked projects are slowly entering the mainstream. Big players like Tata, Mahindra, Reliance, and Infosys have all integrated sustainability into CSR spending. Yet, despite these advances, CSR is often still treated as a PR exercise rather than a structured, long-term climate strategy.
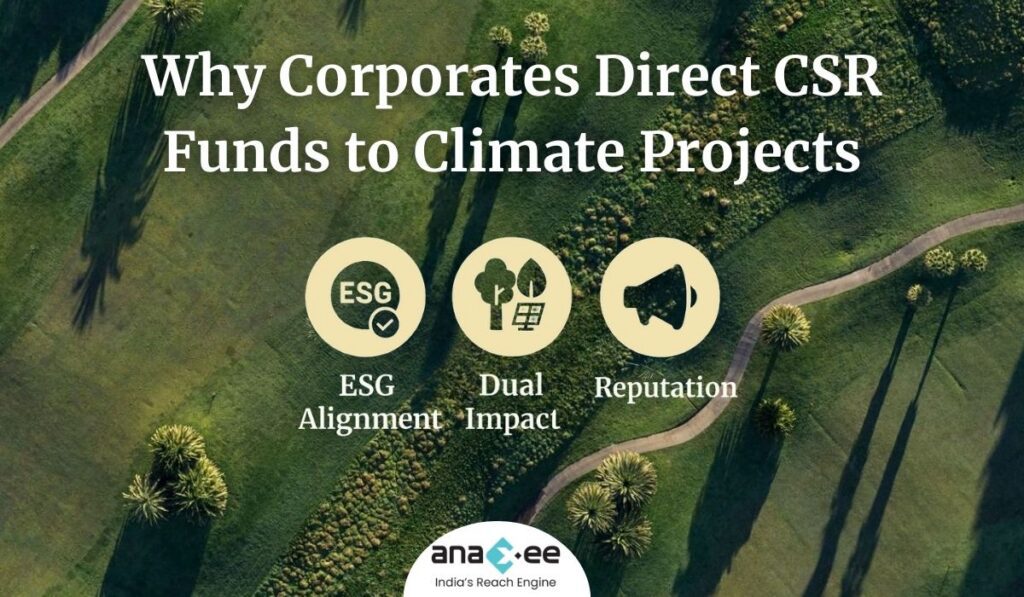
Why Climate Projects Attract CSR Funding
Climate projects are attractive to corporates for three reasons:
Alignment with ESG Goals: CSR funds directed into climate align with broader Environmental, Social, and Governance (ESG) frameworks that investors and regulators demand.
Dual Impact: A climate project delivers both environmental benefits (carbon sequestration, biodiversity, resilience) and community benefits (livelihoods, health, awareness).
Reputation Management: Climate-linked CSR makes headlines, builds brand equity, and signals responsibility to shareholders and the public.
In other words, climate projects allow corporates to demonstrate purpose while staying competitive.
Case Examples of CSR in Climate
Tata Group: Runs extensive reforestation and watershed management projects under CSR, often tied to local communities and livelihood programs.
Mahindra & Mahindra: Launched the “Hariyali” tree plantation initiative, aiming to plant millions of trees with community involvement.
ITC: Integrated CSR with sustainability goals by combining social forestry, water stewardship, and carbon projects.
Infosys: Invested in renewable energy CSR projects, particularly solar electrification for rural schools.
These examples showcase ambition. But the real question is: Are these projects transparent and measurable at the level of carbon markets? Often, the answer is no.
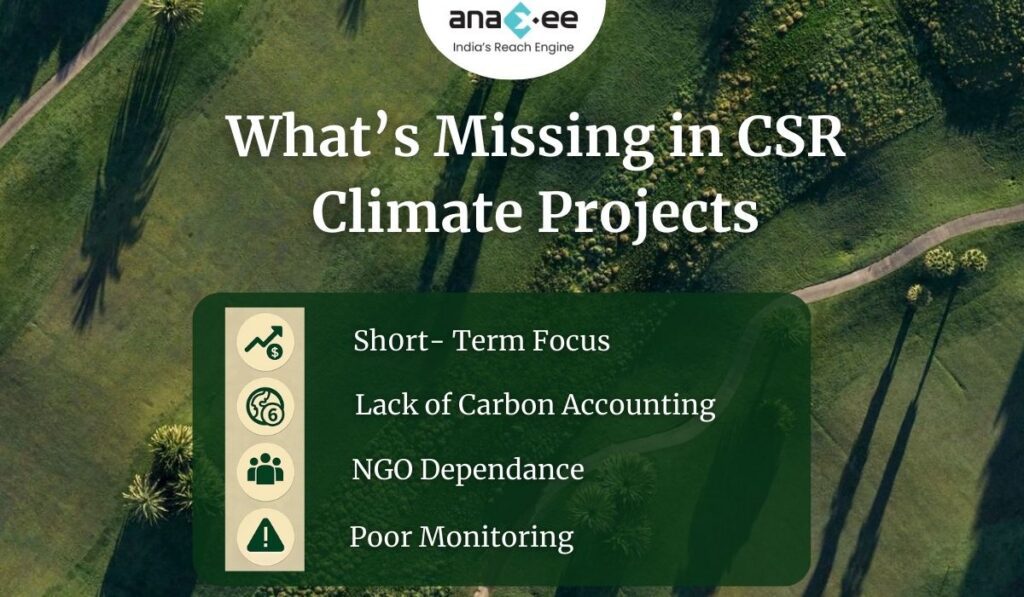
What’s Missing in CSR Climate Action
Despite progress, CSR-driven climate projects in India often share common problems: -Short-Term Orientation: Many projects are structured for 2–3 years, while climate impact requires 15–20 year commitments. -Data Gaps: Monitoring and verification are either absent or limited to photographs and reports, with little scientific rigor. -Overreliance on NGOs: While NGOs play a vital role, corporates often hand over entire CSR projects to NGOs without empowering them with tech, roadmaps, or market linkages. -Lack of Carbon Accounting: Most CSR projects don’t track carbon sequestration or emission reductions in line with international standards. This creates a paradox: CSR funds are spent, communities are engaged, trees are planted—but long-term transparency and accountability remain missing.
The Role of Empowering NGOs
Corporates cannot sidestep NGOs—they are critical intermediaries between companies and communities. But NGOs are not equipped to ensure climate integrity alone. They need: -Technology Platforms: For real-time monitoring and reporting. -Training in Carbon Methodologies: To align community projects with Verra, Gold Standard, or national frameworks. -Long-Term Roadmaps: That outlast short project cycles. -Implementation Partners: To bridge the gap between corporate funding and grassroots execution. Without empowerment, NGOs become weak links in CSR climate projects. With empowerment, they become engines of trust and efficiency.
How Anaxee Brings Transparency to CSR Climate Action
At Anaxee, we specialize in addressing these gaps: -Last-Mile Data Collection: Through our 40,000+ Digital Runners, we ensure on-ground verification across rural India. -dMRV Tools: Our digital monitoring, reporting, and verification systems provide corporates with transparent dashboards. -NGO Empowerment: We integrate NGOs into our tech-driven framework so they can scale beyond traditional limits. -Carbon Project Alignment: Projects are structured for 15–20 years, ensuring they are creditable, verifiable, and impactful. This combination ensures CSR money isn’t just spent—it creates measurable climate outcomes.
Looking Ahead: CSR’s Future in Climate Action
The trajectory is clear: Indian corporates will continue channeling more CSR funds into climate projects. But without transparency, integrity, and long-term structures, much of that money risks being underutilized. The future of CSR climate action in India will depend on three things:
Corporate Commitment to long-term climate strategies.
Empowered NGOs embedded into transparent systems.
Implementation Partners like Anaxee ensuring measurable results.
Key Takeaways for Corporates
-Climate-focused CSR is not just compliance—it’s strategic. -Short-term impact is not enough. CSR projects must be designed for decades, not years. -NGOs are necessary but not sufficient—they must be empowered. -Transparent implementation partners like Anaxee are essential for credibility. Because in the end, CSR in climate is not about planting trees for the photo-op. It’s about building trust, ensuring transparency, and delivering measurable climate impact.
About Anaxee: Anaxee drives large-scale, country-wide Climate and Carbon Credit projects across India. We specialize in Nature-Based Solutions (NbS) and community-driven initiatives, providing the technology and on-ground network needed to execute, monitor, and ensure transparency in projects like agroforestry, regenerative agriculture, improved cookstoves, solar devices, water filters and more. Our systems are designed to maintain integrity and verifiable impact in carbon methodologies.
Beyond climate, Anaxee is India’s Reach Engine- building the nation’s largest last-mile outreach network of 100,000 Digital Runners (shared, tech-enabled field force). We help corporates, agri-focused companies, and social organizations scale to rural and semi-urban India by executing projects in 26 states, 540+ districts, and 11,000+ pin codes, ensuring both scale and 100% transparency in last-mile operations. Connect with Anaxee at sales@anaxee.com
Empowering NGOs for Climate Impact: Why CSR Funds Should Drive Transparent Carbon Projects
When we talk about climate change, carbon credits, and sustainability, the conversation often stays at the level of governments, corporations, and global frameworks. But there’s a crucial layer in this ecosystem that is too often overlooked: NGOs.
NGOs sit at the intersection of local communities and big institutions. They are the boots on the ground, the ones closest to the farmers, the women’s self-help groups, the tribal communities, and the local biodiversity hotspots. Yet, they face very real constraints that prevent them from turning small-scale action into long-term, transparent climate impact.
This is where CSR funding comes in—and where the partnership model between corporates, NGOs, and implementation partners like Anaxee can change the game.
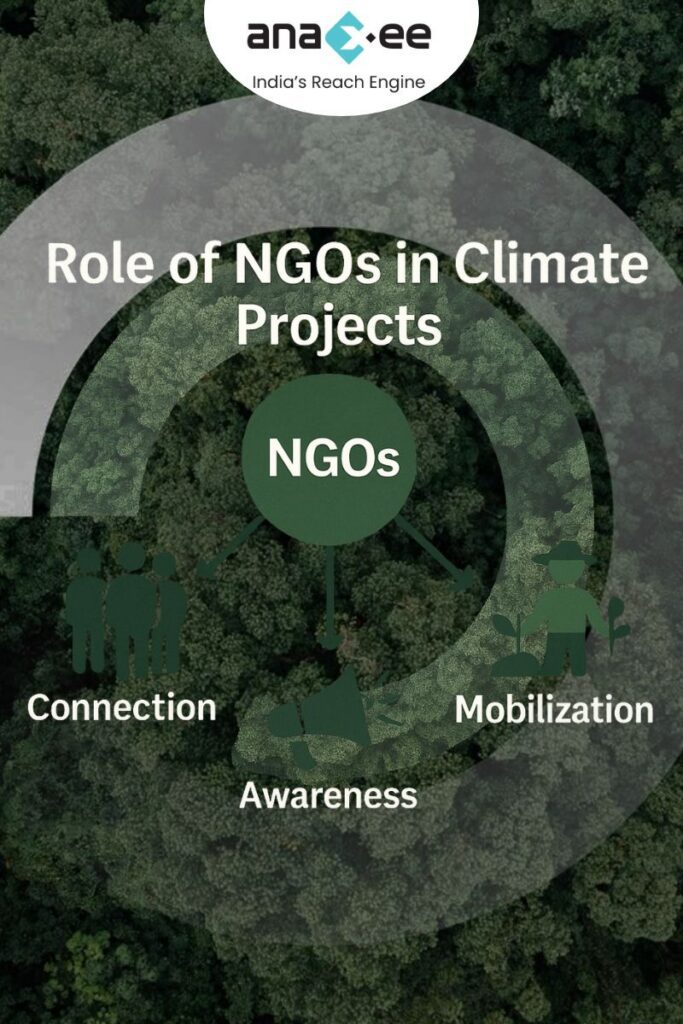
Why NGOs Matter in Climate and Carbon Projects
NGOs are not just about charity drives or awareness campaigns. In the context of climate projects, they play three essential roles:
Community Connect: NGOs already have trust-based relationships with local people. Whether it’s mobilizing farmers for agroforestry or convincing households to adopt renewable practices, NGOs provide a starting point that no corporate or government body can replicate.
Grassroots Awareness: For many communities, climate change is still an abstract concept. NGOs simplify it. They translate jargon into stories and actions that resonate at the village level.
Mobilization Capacity: NGOs can move people—literally. They have field volunteers, coordinators, and networks that can be activated quickly when projects begin.
But these strengths come with serious limitations.
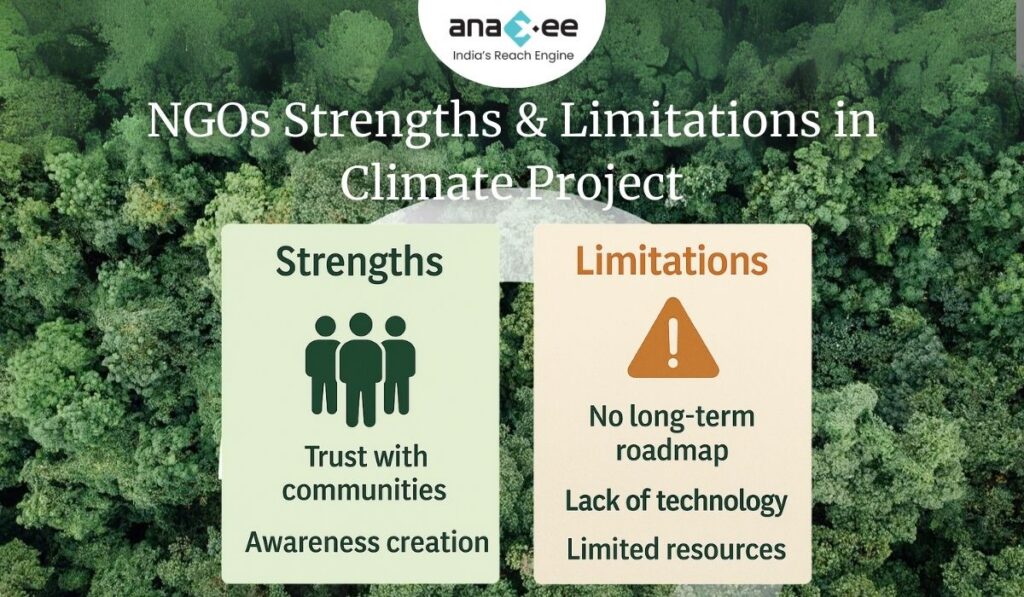
The Limitations NGOs Face in Climate Work
Let’s not romanticize NGOs. They cannot bring integrity and transparency to climate projects by themselves. Some of the challenges include:
-Limited Resources: Most NGOs operate on tight budgets, relying on grants or sporadic donations. Scaling a 20-year climate project with limited funds is unrealistic.
-No Roadmap: NGOs often lack long-term strategic plans, especially when it comes to 15–20 year carbon programs. They work on project-to-project cycles.
-Tech Gaps: Monitoring, reporting, and verification (MRV) requires data systems, apps, drones, and satellite integrations—things most NGOs don’t have access to.
-Fragmented Knowledge: While NGOs understand communities, they are not trained in carbon accounting, climate methodologies, or market dynamics.
In short: NGOs are necessary, but not sufficient.
Why CSR Funds Should Flow Into Climate and Carbon Projects
Corporate Social Responsibility (CSR) in India has come a long way since it became mandatory under the Companies Act, 2013. But here’s the reality: many CSR projects still go into short-term welfare activities. While important, these projects don’t address systemic risks like climate change.
Directing CSR funds into climate and carbon projects is not just a box-ticking exercise. It creates:
Long-Term Impact: Trees planted today under agroforestry or reforestation programs can generate climate and livelihood benefits for decades.
Community Co-Benefits: Climate projects linked with NGOs improve income, awareness, and resilience at the grassroots level.
Carbon Credits & Transparency: Unlike one-time charity drives, CSR climate projects can generate measurable credits and verifiable impact.
Companies like Tata, Mahindra, and ITC have already shifted large portions of CSR toward climate and sustainability. This is a growing trend corporates can’t ignore.
Why Empowering NGOs is the Missing Link
Here’s the blunt truth: if you want integrity, transparency, and scale in your CSR-funded climate project, you cannot just hand the money to an NGO and hope for the best.
You have to empower them.
Empowering NGOs means:
-Giving them access to tech platforms that capture real-time project data.
-Providing them with training and roadmaps so they understand carbon markets and long-term commitments.
-Integrating them with implementation partners like Anaxee who specialize in large-scale project execution, MRV systems, and transparency frameworks.
Without this empowerment, NGOs remain underutilized and corporates risk funding projects that look good on paper but fail to deliver measurable climate benefits.
How Anaxee Bridges the Gap
At Anaxee, we’ve seen both sides of the story: NGOs struggling with scale, and corporates searching for trusted partners who can deliver climate results.
We solve this by:
-Deploying Digital Runners across India to collect data, verify impact, and ensure accountability.
-Offering dMRV tools that NGOs can use to bring transparency to projects.
-Designing long-term project roadmaps that align with Verra or Gold Standard methodologies, something NGOs alone cannot draft.
-Acting as the integrity backbone, so corporates know their CSR money isn’t lost in fragmented or unverifiable activities.
Looking Ahead: CSR, NGOs, and the Future of Climate Action
The future of climate CSR isn’t about giving NGOs more responsibilities—it’s about giving them more power, tools, and partnerships.
Corporates will increasingly be held accountable not just for spending CSR money, but for showing real climate results. NGOs will remain critical at the community level, but their impact will only be multiplied when they’re embedded in transparent, tech-driven frameworks.
So, if you’re a corporate leader deciding where your CSR budget should go, here’s the takeaway:
-Don’t ignore NGOs, but don’t overestimate them either.
-Use your CSR funds in climate projects with long-term co-benefits.
-Partner with organizations like Anaxee that bring the missing layer of transparency and scale.
Because the climate fight isn’t just about planting trees or funding workshops—it’s about building systems of trust, integrity, and measurable impact.
About Anaxee: Anaxee drives large-scale, country-wide Climate and Carbon Credit projects across India. We specialize in Nature-Based Solutions (NbS) and community-driven initiatives, providing the technology and on-ground network needed to execute, monitor, and ensure transparency in projects like agroforestry, regenerative agriculture, improved cookstoves, solar devices, water filters and more. Our systems are designed to maintain integrity and verifiable impact in carbon methodologies.
Beyond climate, Anaxee is India’s Reach Engine- building the nation’s largest last-mile outreach network of 100,000 Digital Runners (shared, tech-enabled field force). We help corporates, agri-focused companies, and social organizations scale to rural and semi-urban India by executing projects in 26 states, 540+ districts, and 11,000+ pin codes, ensuring both scale and 100% transparency in last-mile operations. Connect with Anaxee at sales@anaxee.com
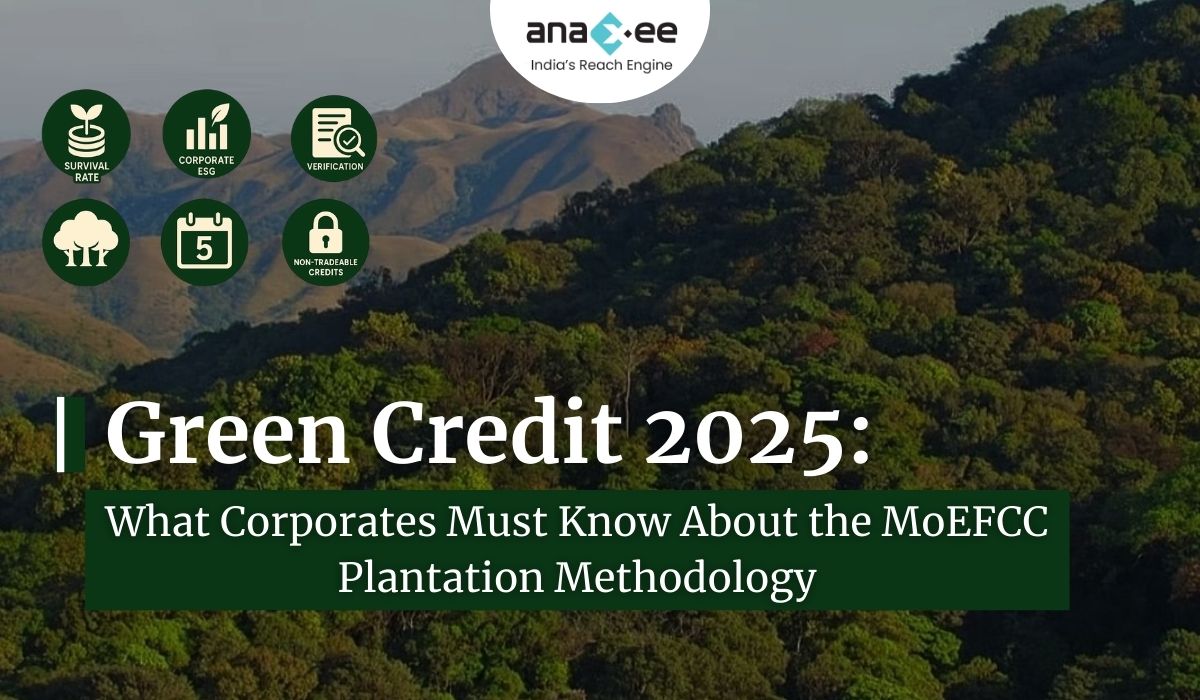
How India’s New Green Credit Rules (Aug 2025) Raise the Bar for Corporate Sustainability
In August 2025, the Ministry of Environment, Forest and Climate Change (MoEFCC) introduced a notification that significantly tightens and clarifies the rules under India’s Green Credit Programme (GCP) for tree-plantation based restoration. For companies, this isn’t just regulatory compliance — it’s a chance to align with global ESG expectations, push real environmental impact, and build brand credibility. However, the changes also bring new challenges — in planning, monitoring, and long-term investment.
In this guide, we walk you through what the new rules are, how they differ from earlier ones, what corporates need to do to not only comply but benefit, and what to watch out for. This is a deep dive, supported by practical advice.
What Is the Green Credit Programme (GCP)?
To set the stage:
-Launched in October 2023 under India’s Lifestyle for Environment (LiFE) initiative, GCP is a voluntary incentive mechanism. Corporations, communities, individuals can earn Green Credits for undertaking eco-restoration activities: plantation, water conservation, etc.
-The idea is to link environmental effort to measurable outcomes: tree survival, canopy density, and restoration of degraded land. It also helps corporations with their CSR obligations, ESG reporting, and compensatory afforestation obligations.
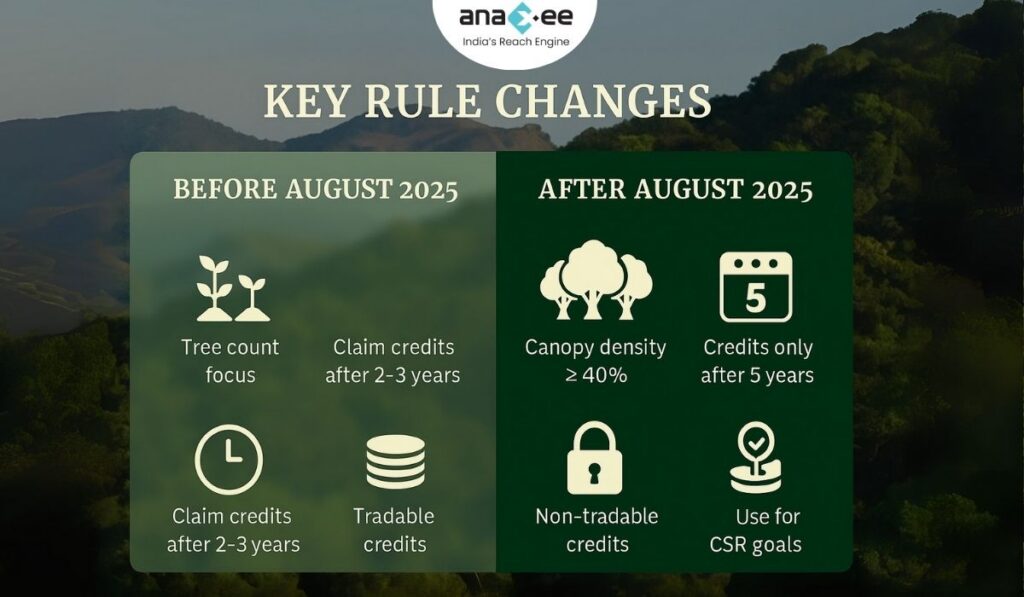
Key Changes in the August 2025 Notification
The August 29, 2025 notification introduces several important shifts. Here are the main ones, and how they compare to the older methodology.
Aspect
Old Rule (Feb 2024 / earlier)
New Rule (Aug 2025)
When credits can be claimed
After plantation and basic requirement (tree count) relatively early – e.g. 2 years in some cases.
Only after 5 years of restoration work.
Tree survival & quality metrics
Earlier focus was more on number of trees planted / count per hectare, e.g. minimum number of saplings planted.
Now survival of trees after 5 years and canopy density of at least 40% are required.
Number of trees per hectare requirement
Previously, certain density norms like ~1,100 trees/ha in some settings.
That specific fixed density benchmark removed; replaced by canopy density + surviving trees.
Tradability / transferability of credits
Earlier versions allowed broader trading of green credits in “market-platforms” under GCP.
Credits are non-tradable and non-transferable, except for transfers within holding company ↔ subsidiaries.
Use / Exchange of credits
Could be used for CSR, project obligations, compensatory afforestation etc. Some ambiguity about when and how.
The revised rules maintain that credits may be exchanged once for: compensatory afforestation, CSR obligations, or statutory plantation requirements. After being used, they are extinguished and cannot be reused.
Implications for Corporates
These changes have several consequences — both opportunities and challenges. If you are a company considering a plantation project (or already running one), these are what to think through carefully.
Challenges / Risks
Longer time horizon Waiting five years means delayed benefits. Corporates must sustain investment, monitoring, and maintenance for at least that period. Failure to ensure tree survival, protection, and canopy growth risks losing out.
Higher operational costs & monitoring You must monitor survival, protect from grazing, encroachment, fires, pests, etc. You’ll need third-party verification. Soil quality, species selection, water availability all become critical.
Biological / ecological risk Species that grow fast may have issues with survival in dry spells or pests. Natural disasters or climatic stress (e.g. drought) can reduce survival dramatically.
Regulatory / planning alignment To use credits (for CSR, compensatory afforestation, project approvals), the plantation must meet all new criteria. Corporate planning must align with these requirements even before planting.
Liquidity and financial modeling Non-tradability of credits limits monetization potential. Companies cannot expect to sell Green Credits in open markets (except internal transfer). This affects financial return models.
Opportunities / Advantages
Stronger ESG positioning Meeting these stricter rules sends a signal of credibility. It’s not just about planting trees but restoring ecosystems. That builds reputation with investors, stakeholders, consumers.
Better environmental outcomes Focus on survival, canopy density means greater ecological benefit — carbon sequestration, biodiversity, soil protection, watershed health.
Cost/benefit via CSR / legal compliance Since credits can be used once for CSR or compensatory obligations, corporates can integrate them into compliance obligations, reducing duplication or overlap.
Early-mover advantage Companies that plan well, choose species correctly, engage communities, invest in monitoring, will benefit; they can show case studies, get ahead on ESG reporting.
Data, transparency, accountability New methodology demands better data. Corporates that build capacity in GIS/remote sensing, vegetation monitoring, tree survival data will have an advantage and possibly cost efficiencies over time.
What Corporates Need to Do to Comply & Maximize Benefit
Here are practical steps corporates should take, ideally before undertaking plantation/restoration, to align with the new rules and reduce risk.
Site selection & baseline assessment
Identify degraded land parcels eligible under GCP. Check with state forest departments.
Assess current vegetation cover, soil health, water availability.
Understand local climatic stress, grazing patterns, fire risk, pests.
Species selection (with native species preference)
Choose species suited to the agro-climatic zone. Native species often have better survival, improve biodiversity.
Planning plantation structure to achieve canopy density
Think about spacing, growth rates, canopy shape. To reach 40% canopy cover after five years, initial planting density + growth rates must be modeled.
Consider a mix: fast-growing pioneer species + slower, more robust ones to fill canopy later.
Protection & maintenance
Fencing or protection from grazing & encroachment.
Fire prevention measures.
Regular watering / irrigation (especially in dry seasons).
Pest and disease control.
Monitoring & verification processes
Use remote sensing, GIS tools to monitor canopy density over time.
Maintain records of surviving trees, their growth, health.
Engage third-party verifiers where required.
Legal & documentation readiness
Be ready to submit claim reports in the prescribed format.
Plan for verification fees, documentation costs.
Align internal CSR / environment policies with GCP rules so that credit exchange is smooth.
Financial planning
Budget for costs over 5+ years, not just initial planting.
Consider partnerships (forest departments, NGOs, local communities) to share burden and risks.
Assess discounting of future benefit, risk of tree mortality, etc.
Case in Point: What Was Changed & Why It Matters
To deepen understanding, here are some specific changes and what they address.
-Removal of fixed tree per hectare benchmark: Fixed benchmarks were criticized as encouraging dense plantation even in grasslands or areas poorly suited, increasing mortality or ecological disruption.
-Shift toward survival & canopy density: These ensure that planted trees aren’t just counted early but grow, survive, and form a functioning canopy. That improves carbon sequestration, biodiversity, etc.
-Non-tradability: By restricting trade, the government appears to be trying to avoid speculative credit trading detached from actual environmental benefit. It ensures credits are used toward CSR or legal obligations rather than purely as financial instruments.
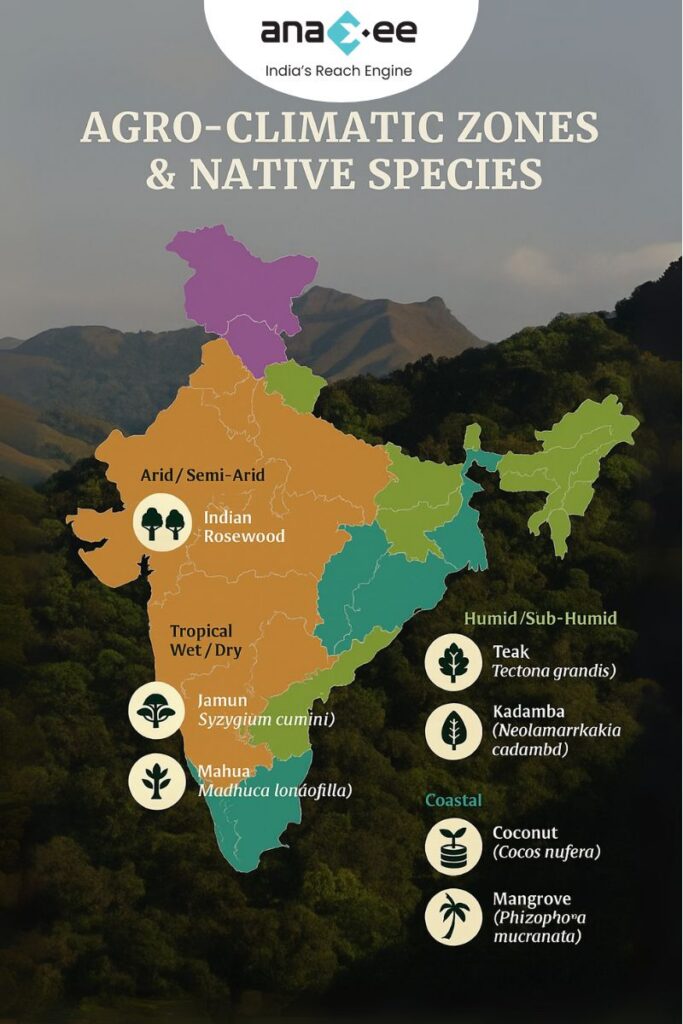
Practical Considerations: Species Selection, Agro-Climatic Zones & Carbon Sequestration
The image/document you shared has a helpful table showing example native species by agro-climatic zone, time to achieve ~40% canopy cover, issues & challenges, and carbon sequestration potential over 5 years.
Here’s how to integrate those insights:
-In arid / semi-arid zones, species like Neem (Azadirachta indica), Rosewood (Dalbergia sissoo) etc. could be used; expect moderate biomass; slower canopy build; plan for water scarcity and grazing.
-In tropical wet / dry zones, combining species like Jamun (Syzygium cumini), Mahua (Madhuca longifolia) etc. will help achieve canopy more rapidly; but plan for dry spells / cattle browsing.
-Humid / sub-humid zones allow stronger biomass, quicker canopy; but must guard against disease, pests, heavy rain damage.
-Coastal zones have additional challenges from salinity, storms — choosing salt-tolerant, cyclone-resistant species is key.
-For temperate / hill zones, growth is slower; but long-lasting trees, good stock of biodiversity; canopy build may take more time, but long-term sequestration/maturity is valuable.
Using the table to choose region-appropriate species will significantly improve survival and canopy density.
Strategic Approach: How Anaxee (or Similar Corporates) Can Build a Green Credit Roadmap
Here’s a suggested roadmap that a corporate (or Anaxee) might adopt to integrate these rules into its sustainability / CSR / environment strategy.
Gap audit
Check existing/tree plantation / CSR projects: how many of them meet or will meet the 5-year + 40% canopy criteria?
What species, maintenance, documentation, survival rates exist?
Pilot project(s)
Start with one or two sites to manage all variables: species selection, protection, monitoring. Use these as learning models.
Partnership building
Collaborate with local forest departments, NGOs, community groups — for tree care, security, protection, know-how.
Use technology partners for remote sensing / canopy monitoring (satellite imagery, drones).
Finance & resource allocation
Allocate budget over 5+ years (planting + care).
Factor in cost of verification / third-party monitoring.
Internal capacity & processes
Set up teams / systems for periodic monitoring, record-keeping.
Ensure legal / CSR / environment department coordination so that claims, usage of credits, documentation etc. are timely.
Stakeholder communications & reporting
Use these ESG metrics & green credit achievements in annual reports, CSR disclosures.
Be transparent on failures / survival challenges — such honesty improves credibility.
Continuous improvement
After 5 years, evaluate: Did you reach canopy density? What survival rates? What could be improved (species, protection, site selection)?
Use those lessons in next project or in scaling up.
What to Watch Out For: Risks & Red Flags
To avoid pitfalls, corporates must be aware of:
-Survival rate slippage: Simply planting without adequate maintenance leads to mortality in early years, making the final canopy requirement hard to meet.
-Ecological mismatch: Planting species not suited to soil, water availability, local pests or climate can reduce survival.
-Lack of long-term commitment: Year 1–2 are easy; years 3-5 often see drop in care. Corporates must plan for all years.
-Verification issues: If documentation is poor or monitoring tools weak, claim may be rejected.
-Legal / land rights issues: Some degraded lands may be encumbered (community rights, forest rights, etc.). Getting permissions, ensuring clarity of ownership/use is critical.
How These Rules Fit Into India’s Broader Climate / Sustainability Goals
Understanding the bigger picture helps frame corporate strategy:
-India has committed to restoration of degraded lands under international forums (e.g. Bonn Challenge). Actions under GCP contribute to these goals.
-Improved forest cover, canopy, and tree survival help with carbon sequestration, cooling, watershed protection, biodiversity — all key for climate resilience.
-ESG / Sustainability Reporting is increasingly demanded by investors, regulators. Companies that can show compliance with MoEFCC rules will be better positioned.
This also helps meet compliance under forest / environment laws, compensatory afforestation obligations, CSR mandates.
Examples / Hypothetical Scenarios
To make it concrete, here are a couple of hypothetical scenarios illustrating what difference the new rule makes.
Scenario A: A company planted 1,500 saplings per hectare in a semi-arid region (species suited). Under old rules, they might have claimed credits after 2 years based on numbers. Under new rules, after 5 years they must show survival, canopy density ≥ 40%. If only 60% of saplings survive, and canopy is patchy, they may fall short.
Scenario B: Another firm picks better species, mixes fast and slower growers, protects from grazing, uses supplementary irrigation in dry months. They document everything, monitor canopy with remote sensing. After 5 years, they achieve 45% canopy, survival rate 70%. They meet criteria, claim credits, use them partly for CSR & for compensatory afforestation obligations.
These examples show that it’s not impossible, but demands careful planning and resilience.
Conclusions & Recommendations
-The MoEFCC’s 29 August 2025 notification marks a shift from quantity-oriented plantation targets to quality, ecological impact, and long-term sustainability.
-For corporates, this raises the bar: more effort, more planning, but also more meaningful environmental and reputational returns.
-The critical success factors will be species selection suited to local agroclimatic zones, protection, monitoring, documentation, and sustaining investment over the full 5 year period (and ideally beyond).
-Corporates that treat this as a core part of their ESG/CSR strategy (not just a checkbox, but a mission) will gain competitive advantage, stronger brand trust, possibly regulatory goodwill.
The Green Credit Rules 2025 aren’t just another regulation — they represent a growing expectation (both globally and within India) that environmental restoration must deliver real, quantifiable impact. Corporates that adapt early, plan deeply, and invest sustainably will not just comply — they will shape leadership in the green economy.
In many ways, the notification challenges old habits: tree-planting campaigns for public photo-ops, minimal maintenance, superficial checks. This is different — results matter: survival, canopy, ecosystem health. It’s harder, but the payoff (environmental, reputational, regulatory) is proportionally higher.
About Anaxee: Anaxee drives large-scale, country-wide Climate and Carbon Credit projects across India. We specialize in Nature-Based Solutions (NbS) and community-driven initiatives, providing the technology and on-ground network needed to execute, monitor, and ensure transparency in projects like agroforestry, regenerative agriculture, improved cookstoves, solar devices, water filters and more. Our systems are designed to maintain integrity and verifiable impact in carbon methodologies.
Beyond climate, Anaxee is India’s Reach Engine- building the nation’s largest last-mile outreach network of 100,000 Digital Runners (shared, tech-enabled field force). We help corporates, agri-focused companies, and social organizations scale to rural and semi-urban India by executing projects in 26 states, 540+ districts, and 11,000+ pin codes, ensuring both scale and 100% transparency in last-mile operations. Connect with Anaxee at sales@anaxee.com
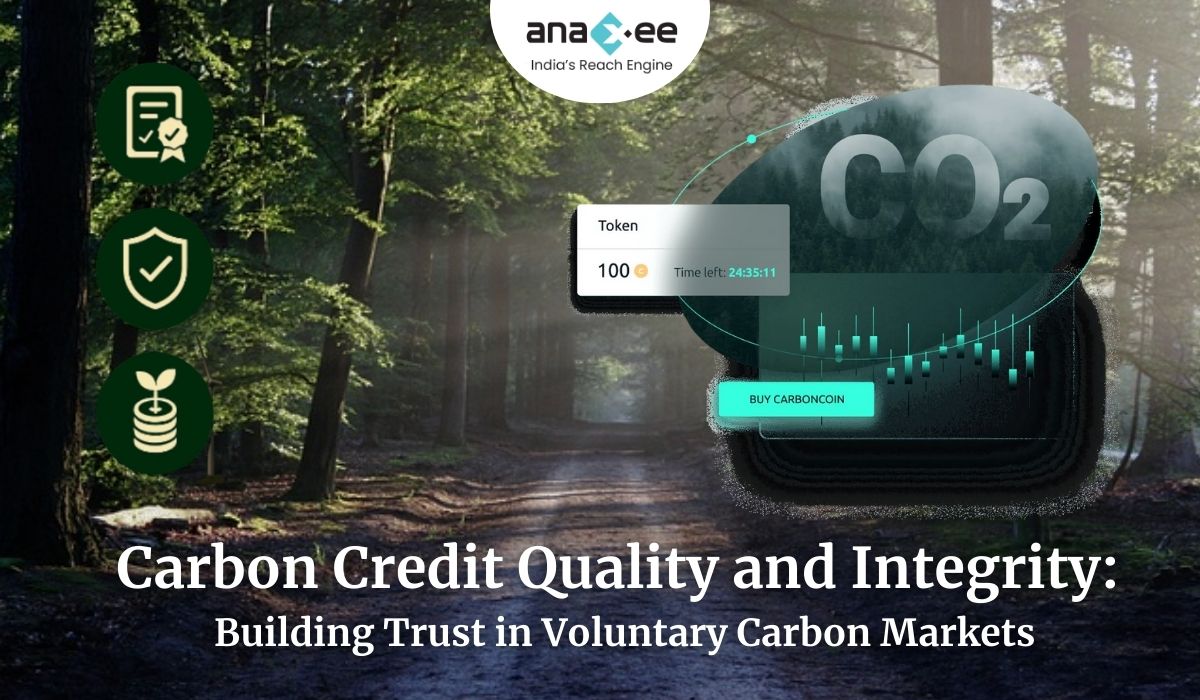
Carbon markets rely on trust. A carbon credit is only valuable if it represents a real, additional, and permanent reduction or removal of greenhouse gases. Yet, the voluntary carbon market (VCM) has faced intense criticism. Investigations into over-credited REDD+ projects, corporate greenwashing, and inconsistent methodologies have shaken confidence. The solution lies in quality and integrity. Buyers, investors, and communities all need assurance that credits meet clear standards. This blog explores what makes a carbon credit high quality, the common risks that undermine integrity, and how emerging global frameworks aim to restore credibility in carbon markets.
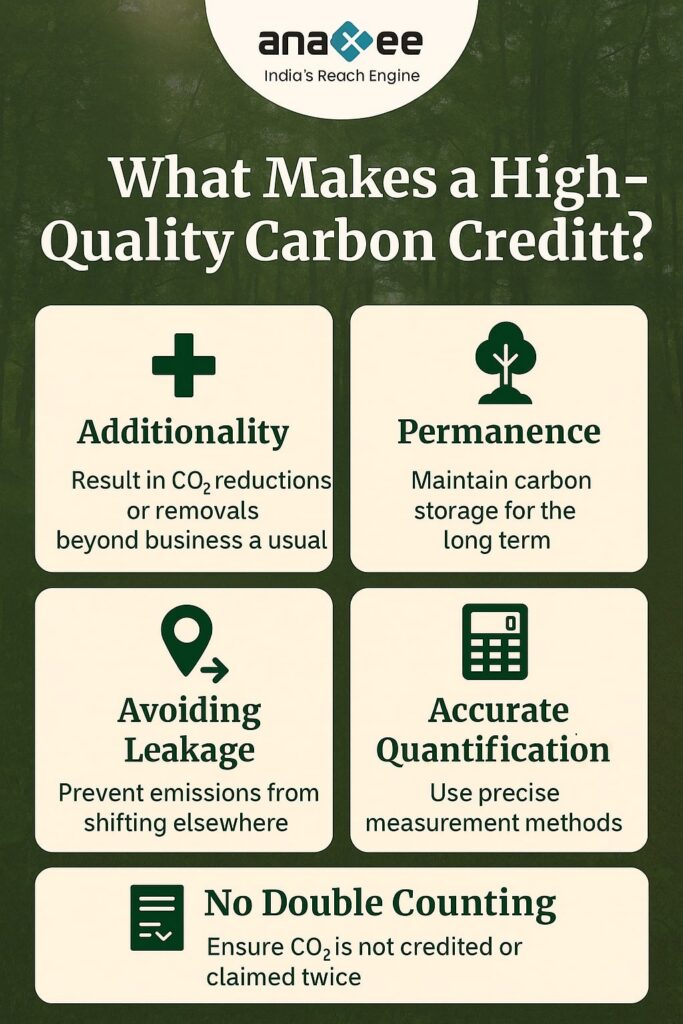
What Defines Carbon Credit Quality?
A high-quality carbon credit should meet five key principles:
Additionality The project would not have happened without carbon finance. Example: A reforestation effort in degraded land that had no alternative funding.
Permanence Emission reductions or removals should last over the long term. Forest projects risk reversal from fires or logging, so buffer pools and insurance mechanisms are used.
Avoiding Leakage Reductions in one area should not cause emissions elsewhere. Example: Preventing deforestation in one region should not push logging to another.
Accurate Quantification Credits should reflect real, measurable impacts, based on transparent methodologies.
No Double Counting A credit should only be claimed once — by either a company, a country, or both under strict Article 6 accounting rules.
The Integrity Problem in VCMs
Despite progress, the VCM has suffered from integrity concerns: -Over-Crediting: Projects generating more credits than the actual emissions avoided or removed. -Greenwashing: Corporates buying cheap credits without reducing their own emissions. -Low-Quality Projects: Some cookstove or renewable energy credits criticized for lack of additionality. -Opacity: Buyers often lack visibility into project details. These issues depress demand and reduce willingness to pay higher prices for credits.
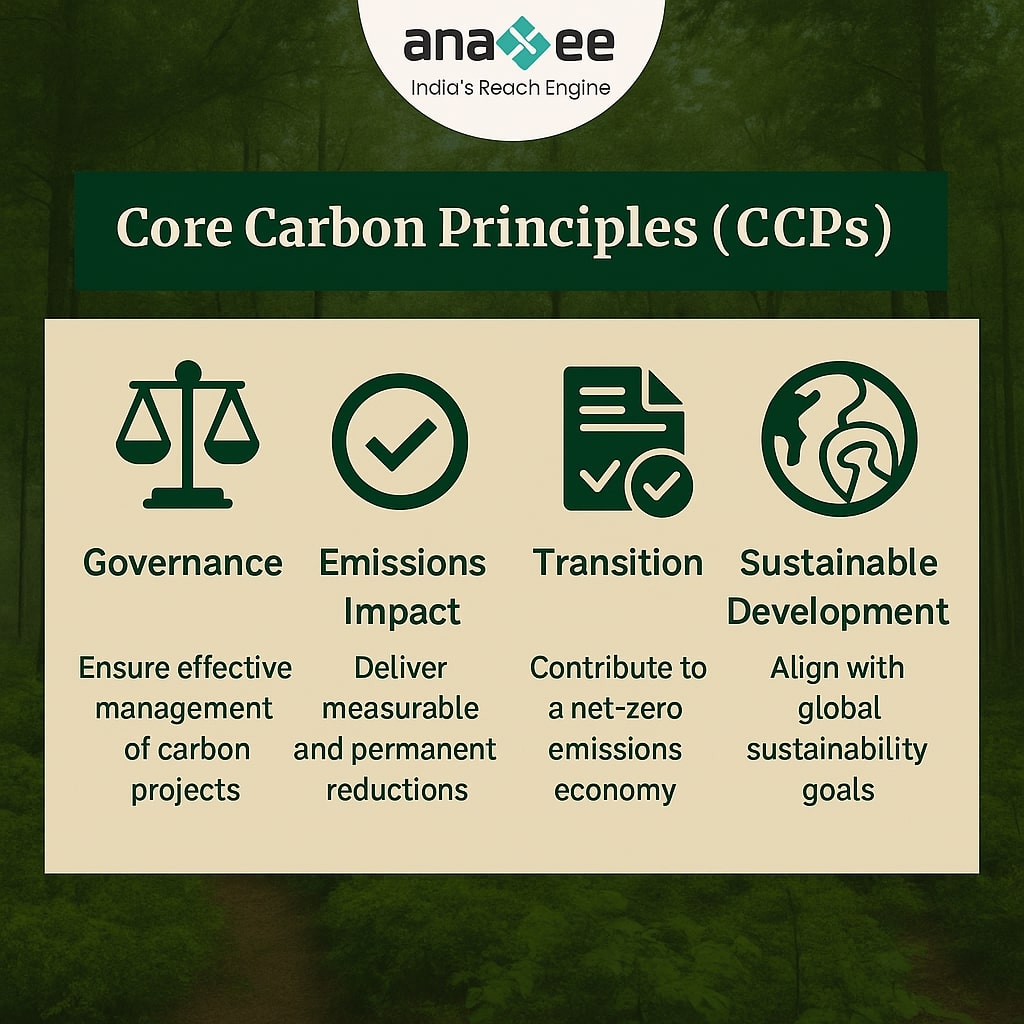
Core Carbon Principles (CCPs)
The Integrity Council for the Voluntary Carbon Market (ICVCM) introduced the Core Carbon Principles (CCPs) to define high-quality credits. CCPs require: -Additionality and strong baseline setting. -Permanence risk management. -Transparent quantification methodologies. -No double counting or double claiming. -Strong governance and independent oversight. Credits that meet CCP standards can earn the “CCP label,” helping buyers identify trustworthy offsets.
Article 6 and Integrity
Article 6 of the Paris Agreement allows countries to trade Internationally Transferred Mitigation Outcomes (ITMOs). It aims to: -Ensure robust accounting rules to prevent double counting. -Align voluntary credits with national climate goals (NDCs). -Increase demand for high-quality credits with compliance value. Article 6 could raise integrity but also introduces complexity, as countries may restrict exports to protect domestic mitigation.
Risks that Undermine Integrity
Non-Permanence: Reversal risk in forestry projects.
Weak Baselines: Inflated estimates leading to over-crediting.
Poor Governance: Lack of local community involvement.
Market Incentives: Pressure to maximize credit issuance.
Transparency Gaps: Limited public access to monitoring data.
Tools for Ensuring Quality
-MRV and dMRV: Continuous monitoring reduces errors and fraud. -Third-Party Verification: Independent auditors review methodologies. -Buffer Pools and Insurance: Protect against non-permanence risks. -Registries: Track credit ownership to prevent double counting. -Community Engagement: Ensures projects respect social safeguards.
Case Studies
REDD+ Controversies
Investigations showed that some projects overstated avoided deforestation, leading to inflated credits. This highlighted the need for stricter baselines.
Gold Standard Cookstoves
Projects with rigorous household surveys and transparent methodologies have retained credibility.
Biochar and DAC Projects
As removal technologies, these credits often fetch premium prices due to permanence and quantifiable impacts.
The Role of Buyers and Corporates
Buyers also shape integrity by: -Prioritizing CCP-labeled credits. -Disclosing carbon offset use in sustainability reports. -Combining offsets with internal emissions reductions. Corporates that simply buy cheap credits without decarbonizing face reputational risks.
Future of Carbon Credit Integrity
-Market Consolidation: Weak registries and low-quality methodologies may fade out. -Digital Innovation: dMRV and blockchain will enhance transparency. -Higher Prices: Buyers will pay premiums for high-quality credits. -Policy Alignment: Article 6 integration will increase accountability. The VCM is evolving from a “buyer beware” market to one where quality is clearly labeled and rewarded.
Conclusion
The value of a carbon credit depends entirely on its quality and integrity. Weak credits undermine trust, but strong standards, robust MRV, and global frameworks like CCPs and Article 6 are driving change. The transition will not be smooth, but as transparency and accountability improve, high-quality credits will command higher demand and play a vital role in financing climate solutions. Carbon markets don’t just need more credits — they need better credits. That’s how the VCM will scale with integrity.
About Anaxee: Anaxee drives large-scale, country-wide Climate and Carbon Credit projects across India. We specialize in Nature-Based Solutions (NbS) and community-driven initiatives, providing the technology and on-ground network needed to execute, monitor, and ensure transparency in projects like agroforestry, regenerative agriculture, improved cookstoves, solar devices, water filters and more. Our systems are designed to maintain integrity and verifiable impact in carbon methodologies.
Beyond climate, Anaxee is India’s Reach Engine- building the nation’s largest last-mile outreach network of 100,000 Digital Runners (shared, tech-enabled field force). We help corporates, agri-focused companies, and social organizations scale to rural and semi-urban India by executing projects in 26 states, 540+ districts, and 11,000+ pin codes, ensuring both scale and 100% transparency in last-mile operations. Connect with Anaxee at sales@anaxee.com
Anaxee Digital Runners Private Limited 303, Right-wing, (use Lift#1) New IT Park Building 3rd floor, Pardesi Pura Main Rd, Electronic Complex, Sukhlia, Indore,
Madhya Pradesh 452003