How to Calculate Your Carbon Footprint: Step-by-Step Guide

How Do I Calculate My Carbon Footprint? A Complete Step-by-Step Guide


Introduction: Why Your Carbon Footprint Matters

When we talk about climate change, we often hear the term “carbon footprint.” But what does it really mean, and why should you care about calculating yours?

Your carbon footprint is essentially the total amount of greenhouse gases (GHGs)—mainly carbon dioxide (CO₂), methane (CH₄), and nitrous oxide (N₂O)—that are emitted into the atmosphere as a result of your actions. This could be from driving a car, heating your home, eating certain foods, manufacturing products, or even using digital services.

Understanding your footprint isn’t just a “green lifestyle” gimmick—it’s a critical step in knowing how much you’re contributing to global emissions and where you can make the biggest impact in reducing them.

If you don’t measure it, you can’t manage it. That’s true for your household, your business, and even at a national level. This guide will help you not only calculate your carbon footprint step-by-step, but also understand the common tools, pitfalls, and ways to take action.
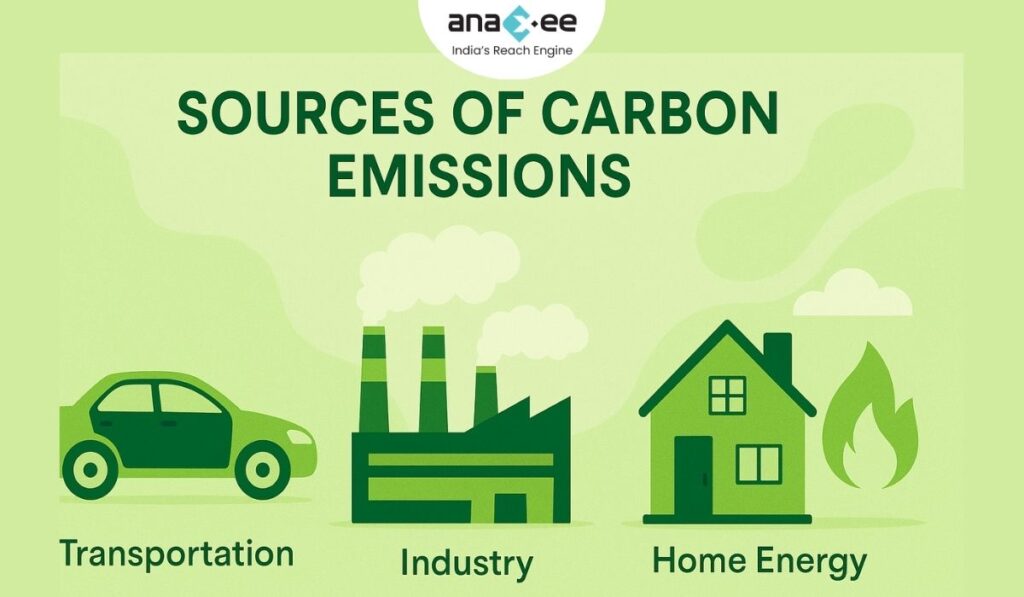
Graphics of Sources of Carbon Emissions


What is a Carbon Footprint?

In simple terms: Your carbon footprint is the sum total of all greenhouse gas emissions you generate, directly and indirectly, over a certain period of time.

-Direct emissions (Scope 1): The emissions you directly cause, such as burning petrol in your car or gas for heating.

-Indirect emissions from energy (Scope 2): Emissions caused by producing the electricity or heat you consume.

-Other indirect emissions (Scope 3): Emissions from the wider supply chain, such as the production of the clothes you buy or the waste you generate.

For example:

-Driving a petrol car emits CO₂ from fuel combustion (Scope 1).
-Using electricity from coal-fired power plants creates emissions indirectly (Scope 2).
-Ordering a fast fashion item shipped from another country adds emissions from manufacturing and transportation (Scope 3).


Why Should You Calculate It?

  1. Identify problem areas: Know which activities contribute most to your footprint.

  2. Set realistic reduction targets: Data beats guesswork.

  3. Track progress: See year-on-year improvement.

  4. Meet regulations and certifications: Many businesses require it for ESG reporting or carbon credit eligibility.

  5. Support global climate goals: Every ton of CO₂ avoided matters.


Step-by-Step: How to Calculate Your Carbon Footprint

The calculation process is more straightforward than most people think—if you follow a structured approach.


Step 1: Decide the Scope

Are you calculating for:

-An individual? (Personal travel, diet, home energy use)
-A household? (All residents’ combined usage)
-A business or organization? (All operations, supply chain, and product life cycles)

This will determine the level of detail and the type of data you’ll need.


Step 2: Gather Your Data

You’ll need accurate numbers for a given time period (usually a year):

For individuals/households:

-Electricity consumption (kWh from bills)
-Gas, LPG, or heating oil usage
-Water usage
-Car mileage and fuel consumption
-Public transport use (bus, train, metro)
-Flights (number, distance, class)
-Waste generation and recycling rates
-Diet type (meat-heavy, vegetarian, vegan)

For businesses:

-Fuel usage for company vehicles or machinery
-Electricity and heat consumption
-Freight and logistics records
-Employee commuting patterns
-Procurement data for goods and services
-Waste management data
-Production volumes


Step 3: Choose a Calculation Method

There are three main approaches:

1. Activity-based method

-Most accurate.
-Multiply your activity data by official emission factors.
Example: Litres of petrol × CO₂ factor per litre.

2. Spend-based method

-Simpler, uses money spent as a proxy.
Example: ₹10,000 spent on clothing × average emission factor per rupee.

Less precise because prices don’t always reflect carbon intensity.

3. Hybrid method

-Combines both approaches for a more balanced and realistic result.
-Recommended for businesses with partial data.


Step 4: Use a Reliable Calculator or Tool

Some trusted online calculators:

-CarbonFootprint.com – Suitable for individuals and small businesses.

-EPA Carbon Footprint Calculator – U.S.-focused but good for global estimates.

-Nature Conservancy’s Calculator – User-friendly, for individuals.

-Gold Standard Tools – Often used for project verification in carbon credit markets.

-Custom dMRV tools – For businesses, use tech platforms (like Anaxee’s Climate Command Centre) for ongoing tracking.


Step 5: Apply the Formula

The general equation is:

Carbon footprint = Activity data × Emission factor

Example for car travel:

-You drive 15,000 km/year.
-Your car consumes 6 litres per 100 km → 900 litres/year.
-Emission factor for petrol ≈ 2.31 kg CO₂/litre.
Result: 900 × 2.31 = 2,079 kg CO₂/year (≈ 2.08 tons CO₂).


Step 6: Sum It Up

Add all categories: energy use, transport, waste, products, and services. This gives you your total annual carbon footprint.


Real-World Examples

-Average Indian footprint: ~2 tons CO₂ per person/year.
-Global average: ~4.7 tons CO₂/year.
-U.S. average: ~16 tons CO₂/year.

A single return flight from Delhi to London in economy can add over 1 ton of CO₂ to your personal total.


Common Pitfalls in Calculation

-Incomplete data – Estimating too much leads to inaccuracy.
-Ignoring Scope 3 emissions – This often forms the majority for businesses.
-Using outdated emission factors – Always use the latest from recognized sources.
-Over-relying on spend-based methods – They mask real differences in carbon intensity.


Beyond Measurement: How to Reduce Your Footprint

  1. Switch to renewable energy – Solar, wind, or certified green electricity.

  2. Travel smart – Use public transport, carpool, or go electric.

  3. Change your diet – Reduce meat, especially beef and lamb.

  4. Buy less, buy better – Opt for quality, long-lasting goods.

  5. Waste less – Repair, reuse, recycle.

  6. Offset what’s left – Invest in verified carbon offset projects.


Business Benefits of Carbon Accounting

For organizations, calculating and reporting your carbon footprint can:

-Improve brand image and customer trust.
-Reduce operational costs through efficiency.
-Meet regulatory requirements.
-Access green finance or carbon markets.
-Strengthen ESG reporting.


Tools & Standards Worth Knowing

-GHG Protocol – The global standard for GHG accounting.
-ISO 14064 – International standard for emissions reporting.
-Life Cycle Assessment (LCA) – For product-level carbon footprints.


Call to Action

At Anaxee, we help individuals, corporates, and project developers measure, monitor, and reduce carbon footprints using our on-ground data collection and digital monitoring tools. Whether you want to understand your own footprint or track it across a large-scale project, we can make it accurate, transparent, and actionable.


Ready to measure yours?
Start with a trusted calculator today—and take your first step toward a smaller footprint.


About Anaxee:

Anaxee drives large-scale, country-wide Climate and Carbon Credit projects across India. We specialize in Nature-Based Solutions (NbS) and community-driven initiatives, providing the technology and on-ground network needed to execute, monitor, and ensure transparency in projects like agroforestry, regenerative agriculture, improved cookstoves, solar devices, water filters and more. Our systems are designed to maintain integrity and verifiable impact in carbon methodologies.

Beyond climate, Anaxee is India’s Reach Engine- building the nation’s largest last-mile outreach network of 100,000 Digital Runners (shared, tech-enabled field force). We help corporates, agri-focused companies, and social organizations scale to rural and semi-urban India by executing projects in 26 states, 540+ districts, and 11,000+ pin codes, ensuring both scale and 100% transparency in last-mile operations.


What are the Sustainable Development Goals? A Practical Guide for Businesses & CSR in India

What are the Sustainable Development Goals?

(A practical guide for companies, investors, and CSR/ESG teams in India)

The Sustainable Development Goals (SDGs) are 17 globally agreed targets adopted by all UN Member States in 2015 to be achieved by 2030. They cover poverty, health, education, gender equality, water, energy, jobs, industry, cities, climate, biodiversity, and governance. Progress is real but off-track overall; the 2025 UN status report shows persistent gaps and a multi-trillion-dollar annual financing shortfall. India measures SDGs state-by-state using the SDG India Index; the 2023–24 edition reports a national score of 71 with notable gains on poverty reduction, jobs, climate action, and life on land. For companies, SDG-aligned projects translate into risk reduction, access to finance, compliance readiness, and measurable impact—provided there’s credible dMRV and last-mile execution.

1) The basics—what the SDGs are (and what they’re not)

Definition. The Sustainable Development Goals (SDGs) are 17 global goals and 169 targets adopted under the 2030 Agenda for Sustainable Development in 2015. Every UN Member State signed on, making the SDGs the most widely accepted development framework in history.

Purpose. The SDGs are a blueprint to end extreme poverty, reduce inequality, and protect the planet while sustaining economic growth and good governance. This is not a charity wishlist; it is a policy-and-metrics framework that helps governments and markets pull in the same direction.

Measurement. The SDGs are tracked through a global indicator framework that’s periodically updated. As of 10 April 2025, the UN system classifies 161 indicators as Tier I (methodology and data widely available) and 60 as Tier II (methodology clear, data not universal), among others—meaning the technical underpinnings are mature for most key metrics.

What SDGs are not. They’re not a single certification logo, not a replacement for local laws, and not a one-size KPI set for every organization. They’re a public good: a global scoreboard governments, companies, financiers, and civil society can align to.


2) The 17 Goals—one-line summaries for decision makers

  1. No Poverty (SDG 1): End poverty everywhere.

  2. Zero Hunger (SDG 2): Food security, better nutrition, and resilient agriculture.

  3. Good Health & Well-being (SDG 3): Universal health coverage, maternal/child health.

  4. Quality Education (SDG 4): Inclusive, equitable learning for all.

  5. Gender Equality (SDG 5): End discrimination/violence; ensure participation and rights.

  6. Clean Water & Sanitation (SDG 6): Safe water, sanitation, hygiene, and watershed management.

  7. Affordable & Clean Energy (SDG 7): Universal access to modern, renewable energy.

  8. Decent Work & Economic Growth (SDG 8): Jobs, SME growth, productivity, safety.

  9. Industry, Innovation & Infrastructure (SDG 9): Sustainable industrialization, R&D, resilient infrastructure.

  10. Reduced Inequalities (SDG 10): Inclusion across income, age, gender, migration.

  11. Sustainable Cities & Communities (SDG 11): Housing, mobility, pollution, resilience.

  12. Responsible Consumption & Production (SDG 12): Resource efficiency, waste prevention.

  13. Climate Action (SDG 13): Mitigation, adaptation, finance, capacity-building.

  14. Life Below Water (SDG 14): Oceans, fisheries, pollution control.

  15. Life on Land (SDG 15): Forests, land degradation, biodiversity.

  16. Peace, Justice & Strong Institutions (SDG 16): Rule of law, transparency, anti-corruption.

  17. Partnerships for the Goals (SDG 17): Finance, technology, trade, data, and collaboration.

Board takeaway: Think of the 17 goals as a risk map + opportunity pipeline. Each goal touches a material ESG category with clear policy momentum and—importantly—tracking indicators you can report against.


3) Where the world stands in 2025—progress, but not enough

Status check. The UN SDG Report 2025 flags two truths: (1) millions of lives have improved since 2015 (e.g., access to electricity, mobile broadband, some health outcomes), (2) but the world remains off-track on most targets—especially on climate, biodiversity, food security, and financing. Macroeconomic headwinds and debt overhangs in developing countries are slowing progress.

The money gap. The annual SDG financing gap for developing countries is now estimated at ~$4 trillion—a jump from pre-pandemic levels. This is why blended finance, MDB reform, tax cooperation, and private capital mobilization dominate the policy conversation.

Political reality. International negotiations in 2025 continue to wrestle with development finance and governance. Outcomes matter because they influence concessional funding, debt terms, and the policy environment for corporate projects.

So what? Expect rising disclosure demands (on impact, nature, and value chain), more results-based finance, and a premium on credible data. Organizations that can prove delivery at the last mile will get funded faster.


4) India’s SDG picture—signals that matter for business

India tracks progress through the SDG India Index, published by NITI Aayog. The 2023–24 edition reports a national composite score of 71, up from 66 (2020–21) and 57 (2018 baseline). Gains are strongest on SDG 1 (No Poverty), SDG 8 (Decent Work), SDG 13 (Climate Action), and SDG 15 (Life on Land). State/UT scores range 57–79. Translation: policy and program alignment is rising, and procurement/CSR windows are opening around climate and livelihoods.

Implication for corporates/CSR: There’s a policy-backed, measurable pathway to fund and implement nature-based, livelihood, and health/education interventions—if you can deliver verifiable outputs and outcomes.


5) How the SDGs are measured—targets, indicators, tiers (and why this matters to your CFO)

Each SDG has targets and indicators. Indicators are grouped by Tier:

Tier I: Methodology and data widely available (low reporting friction).

Tier II: Methodology clear; data not regularly produced by many countries (medium friction).

Multiple Tiers / Pending review: Complex metrics or components under evaluation.

As of April 10, 2025, the UN lists 161 Tier I and 60 Tier II indicators (plus a small set with mixed tiers/pending review). For companies, this means more mature KPIs to align with—reducing the risk of “impact-washing” and making CFO-grade reporting feasible.


6) Why companies should care—hard benefits, not soft PR

Capital access: Development banks, impact funds, and sustainability-linked instruments increasingly tie terms to SDG-relevant outcomes—energy access, climate resilience, biodiversity, livelihoods. Strong projects can lower cost of capital.

Compliance readiness: SDG-aligned reporting dovetails with evolving disclosure regimes and supply-chain expectations (scope emissions, nature, human rights).

Market expansion: SDG-aligned products tap new demand (clean energy devices, water filters, climate-smart ag inputs) and unlock public co-funding.

Talent & brand: Evidence-backed impact attracts talent and partners—increasingly a procurement prerequisite, not a nice-to-have.

Caveat: None of this works without proof—geo-tagged data, independent QA, permanent traceability, and on-ground feedback loops.


7) From SDGs to execution—what credible projects look like

A credible SDG-aligned project should demonstrate:

  1. Clear problem → measurable outcome (e.g., “X households receive clean cooking devices; Y% reduction in PM2.5 exposure; Z tCO₂e avoided”).

  2. Target–indicator mapping to at least one SDG (primary) and secondary co-benefits.

  3. dMRV (digital Measurement, Reporting, Verification) with geo-evidence, time stamps, and beneficiary consent.

  4. Last-mile operations with trained local teams; not just one-time deployments.

  5. Independent QA and audit trails.

  6. Data governance and grievance mechanisms (relevant to SDG 16).

  7. Transition plan—maintenance, repairs, engagement beyond Day 0.

These aren’t buzzwords; they’re how you survive scrutiny from auditors, financiers, and the public.


8) Mapping common project types to SDGs (examples Anaxee can execute)

-Agroforestry on smallholder landsSDG 13 & 15 (climate and biodiversity), SDG 1 & 8 (farmer incomes, jobs). Requires baseline/census, survivability audits, and seasonally tuned field ops.

-Clean energy devices (solar lanterns, SHS)SDG 7, co-benefits for SDG 3 (health), SDG 4 (study hours), SDG 13. Needs device registry and after-sales service logs.

-Clean cookingSDG 3 & 7, SDG 5 (gender/time savings), SDG 13. Track usage data, fuel displacement, health proxies.

-Water filters / water ATMsSDG 6, SDG 3. Requires water-quality logs, uptime monitoring, replacement cycles.

-Beneficiary identification & targeting → Cross-cutting; essential for SDG 1, 2, 3, 4, 5 and 16 (inclusion, accountability).

-Digitization of climate data (dMRV) → Enabler for SDG 13, 15 and reporting across the board.

(All SDG goal definitions and linkages per UN goal descriptions.)


9) The financing conversation you can’t avoid

Reality check: The $4T+/year SDG financing gap won’t close with philanthropy alone; private capital is now central. Expect performance-based contracts, blended structures, and stronger due diligence around data quality and permanence of outcomes. Projects that prove additionality, durability, and social safeguards will move first.

What to prepare:

-3–5 year impact pro-forma with conservative baselines.

-Indicator mapping (UN indicator codes where relevant) to shorten diligence.

-Ops manual: SOPs for enrollment, training, maintenance, and exit.

-Risk register (seasonality, supply chain, beneficiary attrition) with mitigation plans.

-Independent QA plan and data sharing terms.


10) India strategy—align with the SDG India Index

Since the SDG India Index scores states/UTs, align proposals with state priorities that are already trending up (e.g., climate action, poverty reduction, life on land). This improves buy-in, co-funding odds, and speed. Use the index to justify geographic focus and set realistic targets without overpromising.


11) How Anaxee de-risks SDG-aligned projects (execution, not jargon)

Why this matters: Many projects fail not on ideas, but on weak ground execution—missing baselines, poor training, data holes, and zero follow-up.

What we do differently:

-Last-mile workforce at scale: trained local digital runners with live feedback loops from a central 125+ member team coordinating checks, corrections, and escalation.

-Census-based enrollment (not estimates), polygon mapping, and tree/device registries with unique IDs, geo-tags, and time stamps.

-dMRV stack: mobile apps, QC dashboards, audit logs, and photo/video protocols tied to SDG indicator logic where relevant.

-QA & re-verification: randomized back-checks, survivability audits, and grievance channels.

-Partner-ready data: datasets structured for financiers and auditors.

Bottom line: If you need SDG-aligned results you can defend, you need verifiable data and trained teams that don’t disappear after deployment.


12) Frequently asked questions (straight answers)

Q1. Is “doing SDGs” just CSR?
No. The SDGs are a global policy and measurement framework. CSR is one vehicle to fund SDG-aligned work. Many SDG projects are commercial or blended finance.

Q2. Which SDGs should my company prioritize?
Start with materiality: your supply chain risks and core strengths. Then choose a primary SDG and 1–2 co-benefits where you can actually measure outcomes.

Q3. How do we report?
Map activities to UN indicators where possible, set baselines, and use verifiable dMRV. Avoid vanity metrics.

Q4. What’s new in 2024–2025?
Updated indicator tiers, a clear financing gap number that’s driving MDB reform debate, and ongoing policy focus on results-based funding. Translation: strong data beats glossy decks.


13) A simple, SDG-aligned corporate action plan (90 days)

Weeks 1–2: Prioritize & baseline

-Pick 1–2 SDGs aligned to your business.
-Define indicators and data you can feasibly collect.
-Commission a rapid baseline (geo-tagged).

Weeks 3–6: Pilot design

-Choose 2–3 districts and a single intervention (e.g., agroforestry bundles or water filters).
-Lock SOPs for training, deployment, and QA.
-Pre-wire reporting templates to match UN indicator logic (where applicable).

Weeks 7–12: Launch & verify

-Train local teams; push live checklists.
-Capture data in dMRV; run back-checks.
-Publish a concise results note with photos, geo-evidence, and beneficiary feedback.

Day 90: Decide to scale or refine; line up co-funding or performance-based contracts.


14) Common mistakes to avoid

-Counting activities instead of outcomes. Handing out devices isn’t impact; sustained usage is.
-Ignoring seasonality. Agroforestry done off-season = survivability risk.
-No maintenance budget. Water filters and clean cookstoves fail without service cycles.
-Data holes. If it’s not geo-tagged/time-stamped with QA, expect pushback.
-Over-claiming co-benefits. Tie claims to specific indicators or keep them conservative.


15) The road to 2030—pragmatic optimism

We’re past the halfway mark. The world is off-track at the macro level, but credible, verifiable projects can still move the needle—especially in climate-nature-livelihood intersections where India has scaled programs and state-level prioritization. The organizations that combine operational depth with clean data will shape outcomes—and capture the upside.

If you want SDG results you can publish without hedging, partner with teams that can execute and verify on the ground.

About Anaxee:

Anaxee drives large-scale, country-wide Climate and Carbon Credit projects across India. We specialize in Nature-Based Solutions (NbS) and community-driven initiatives, providing the technology and on-ground network needed to execute, monitor, and ensure transparency in projects like agroforestry, regenerative agriculture, improved cookstoves, solar devices, water filters and more. Our systems are designed to maintain integrity and verifiable impact in carbon methodologies.

Beyond climate, Anaxee is India’s Reach Engine- building the nation’s largest last-mile outreach network of 100,000 Digital Runners (shared, tech-enabled field force). We help corporates, agri-focused companies, and social organizations scale to rural and semi-urban India by executing projects in 26 states, 540+ districts, and 11,000+ pin codes, ensuring both scale and 100% transparency in last-mile operations.

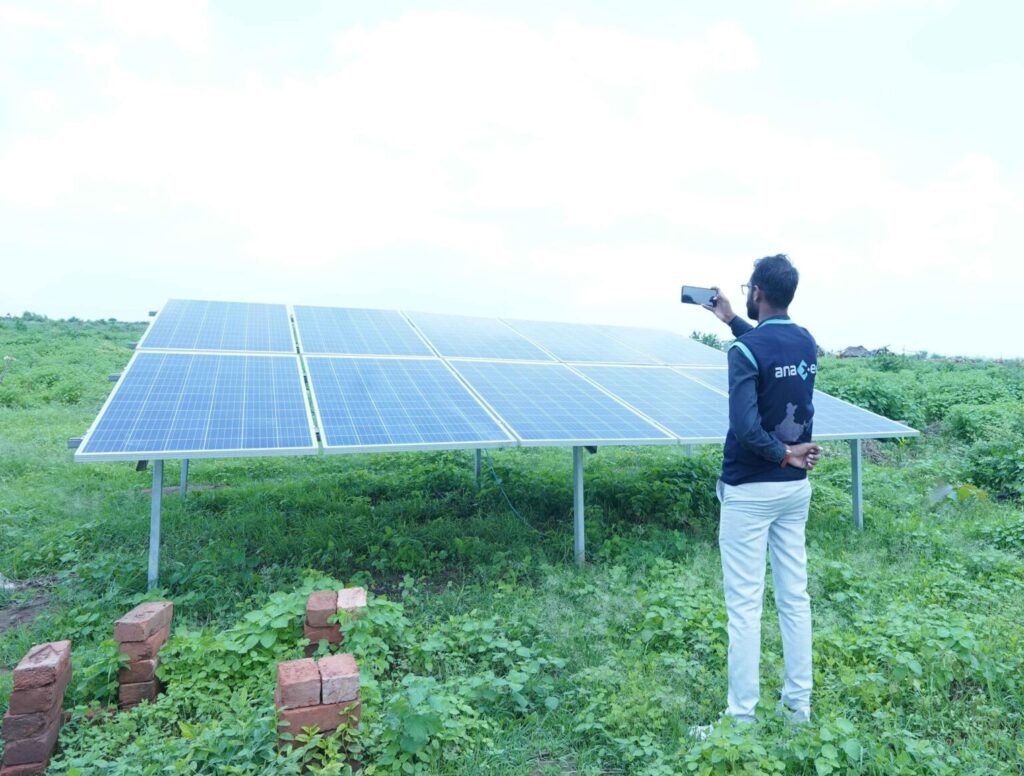
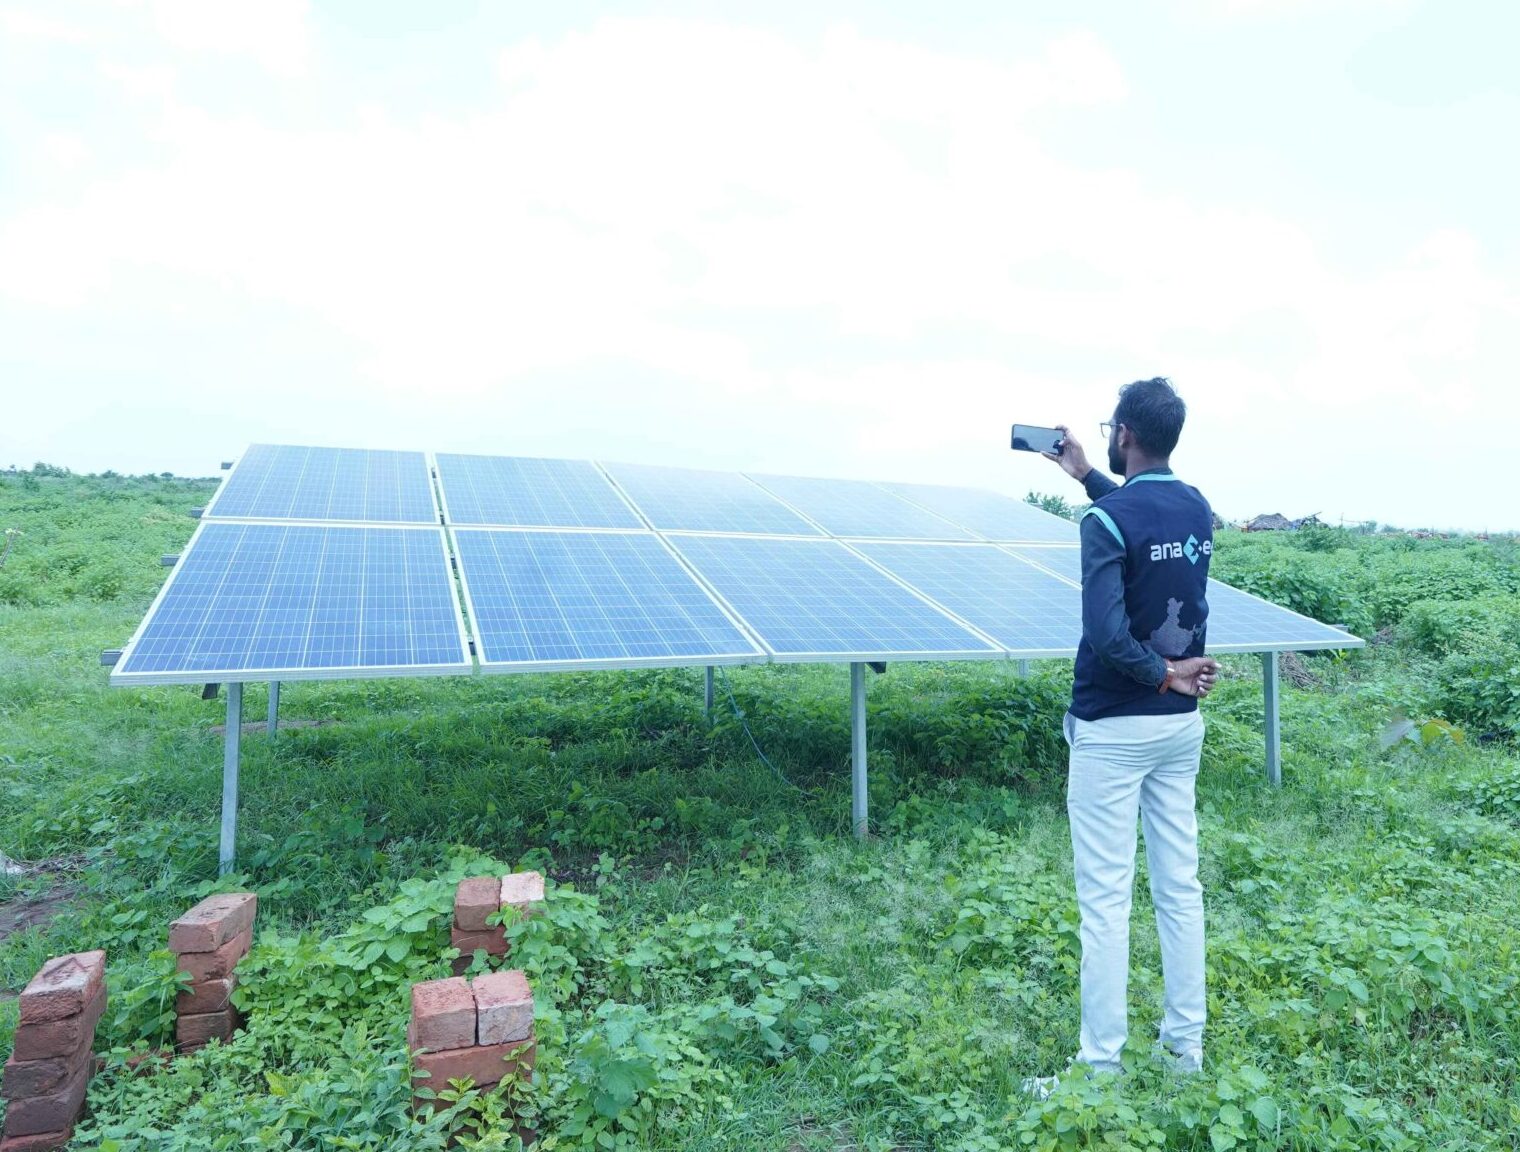
An Anaxee field worker photographs a ground-mounted solar panel array in a lush farm, documenting a solar-agriculture pilot in rural India.

Why Distributor Empowerment Matters for Non-FMCG Brands | Anaxee’s Go to Market Strategy
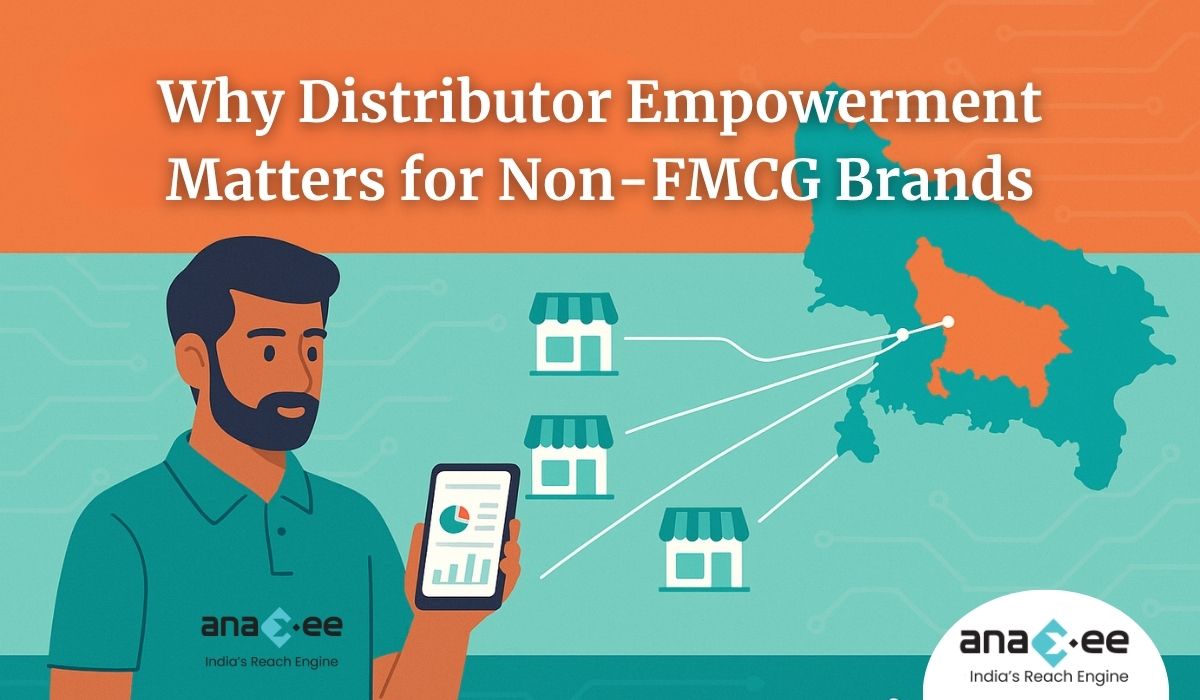
Why Distributor Empowerment Matters for Non-FMCG Brands

“The reason behind the success of top FMCG companies in India is their focus on supporting distributors and helping them in generating sales.”

Electronics, automotive spares, cookware, footwear- India’s vast “non-FMCG” universe moves through the same dusty godowns, two-ton Eicher trucks, and corner stores that sell toothpaste. Yet most non-FMCG brands treat distribution as a cost centre, not a growth lever. The result? Patchy presence, lopsided shelf share, month-end fire-sales, and a constant scramble for new channel partners.

This blog digs into:

  1. The structural limits distributors face in non-FMCG sectors

  2. Why “empowerment” beats “management”

  3. How Anaxee Digital Runners converted Prestige’s reach in East Uttar Pradesh from thin lines on a map to a living sales engine

  4. A practical playbook you can lift-and-shift for your own brand

Language is deliberately plain and factual—no corporate fluff, no robotic AI prose.


1. Distributors: The Limits No One Talks About

Most brands hire a C&F agent, appoint one or two district distributors, and move on. Here are the hidden constraints inside that model:

All of this is echoed in the GTM deck: distributors miss uniform monthly sales, full district potential, and expansion to nearby towns/talukas , while juggling competing brands and limited visibility . In short, even the most motivated partner is shackled by structure.


2. Empowerment vs. Management

Traditional “distributor management” = meeting at a dhaba, scolding about targets, dumping more stock. Empowerment flips the lens:

Anaxee condenses empowerment into a three-step GTM engineMarket Mapping, Retailer Profiling, Order Taking. The tech core removes guesswork; the human core (Digital Runners) removes inertia.


3. Case Study- Prestige in Eastern Uttar Pradesh

Before we show dashboards, remember the terrain: 9 districts, mixed Hindi dialects, dense retail clusters around tehsils, and roads that turn to slush in monsoon. Prestige, famous for pressure cookers and small appliances, wanted width and depth—meaning more outlets per district and higher category billing per outlet.

3.1 Market Mapping

-Top five districts alone (Deoria, Gorakhpur, Sultanpur, Jaunpur, Prayagraj) held 2,791 stores—over 35 % of the region’s potential

-2000 shops mapped across East UP in one blitz month

We tagged every outlet’s GPS, class (A/B/C), and appliance categories. The Prestige team saw, often for the first time, a heat-map of “white spaces” in their Excel territory plan.

3.2 Retailer Profiling

Inside each store our runner captured:

-Existing brands (Bajaj, Orient, Greenchef, Prestige)

-Purchase source (wholesale or direct distributor)

Willingness to stock new SKUs

Owner’s mobile + WhatsApp (for order confirmation)

A sample profile from Maharajganj illustrates the depth.

3.3 Order Taking

Using the Anaxee app, runners began structured visits:

-Average 4 visits to convert fence-sitters

-First-order ticket often ₹ 5,000–₹ 25,000 for small appliances

-SKU focus: convert induction-stove sellers to add mixers & grinders, widening catalogue penetration

By month three, previously “silent” districts like Gonda and Chandauli started reporting predictable lift.

3.4 What Changed for Distributors
  1. Uniform Demand Curves – Weekly app-orders created stock visibility, smoothing peaks and troughs.

  2. New Retail Footprint – Distributors delivered to outlets that had never asked for Prestige.

  3. Less Cashflow Stress – Data on retailer credit cycles let them stagger invoicing.

  4. Competitive Moat – Shelf presence rose; rivals faced higher switch cost to dislodge Prestige.


4. The Anaxee Toolbox for Distributor Empowerment

In plainer words: we give distributors data dashboards, trained field runners, and ready-to-ship orders– a cocktail that even the best FMCG majors took decades to perfect.


5. Building Your Own Empowerment Programme- A Step-by-Step Template

  1. Audit Current Reach
    Take a pen and list every taluka where your sales are <50 % of state average. Those are your phase-one zones.

  2. Adopt Market Mapping
    Shoot for 100 % shop census, not sample studies. A half map is an uncharted jungle.

  3. Profile Retailers Meticulously
    Capture owner phone, categories, shelf metre length, and willingness score (0–5).

  4. Create a Runner Cadre
    Whether you partner with Anaxee or DIY, you need local language field reps armed with a phone, not a brochure.

  5. Design Order-taking Cadence
    Four visits convert most non-brand retailers; log each visit reason and next action.

  6. Share Data in Real-time
    Transparency is the carrot for distributors; let them see pending orders and ageing stock daily.

  7. Layer Promotions After Baseline Sales
    Once width is fixed, run depth offers—mixers with induction stoves, helmets with bikes, etc.


6. Frequently Asked Questions

Q. “My distributors fear losing control if I bring an external team.”
In UP, 90 % of distributors warmed up once they saw pre-paid retailer orders queued in the app.

Q. “Isn’t this expensive?”
It Depends on the Shops, but repeat order recovers that.

Q. “Will retailers talk to a runner they don’t know?”
Anaxee runners are local—often a friend of the retailer’s nephew. Adoption is faster than out-of-town SOs.


7. Key Takeaways

-Distributors are growth partners, not just intermediaries.

-Empowerment needs data + local human touch + repeatable process.

-Prestige’s story proves that even crowded categories can carve new share with a field-first, tech-backed model.

-The earlier you map, profile, and enable, the cheaper your category conquest becomes.


Conclusion & Call-to-Action

The highways of non-FMCG commerce are still dominated by independiente distributors who juggle multiple brands and razor-thin margins. When you give them visibility, velocity, and validation, they return the favour with loyalty and volume.

Ready to turn your distributor chain into a growth engine? Talk to Anaxee at sales@anaxee-wp-aug25-wordpress.dock.anaxee.com

About Anaxee:

Anaxee is India’s Reach Engine- building the country’s largest last-mile outreach network of 100,000 Digital Runners (shared, tech-enabled feet-on-street). We enable brands, corporates, and agri-focused companies to break distribution barriers and scale their presence into rural and semi-urban India, covering 26 states, 540+ districts, and 11,000+ pin codes. Our technology-driven GTM solutions deliver on-ground activations, customer acquisition, lead generation, and project execution at unmatched speed and scale- while ensuring complete visibility and control over last-mile operations.

Alongside commercial execution, Anaxee also leads large-scale Climate and Carbon Credit projects nationwide. We provide the tech and field infrastructure to implement and monitor Nature-Based Solutions (NbS) and community projects like agroforestry, regenerative agriculture, and clean energy interventions, bringing transparency and verifiable impact to global carbon markets.

Want to scale your business or explore GTM partnerships?
Contact us: sales@anaxee-wp-aug25-wordpress.dock.anaxee.com

Anaxee's Field team in Indian Market

Inside Anaxee’s Climate Command Centre: How We Execute Carbon Projects at Scale with Precision

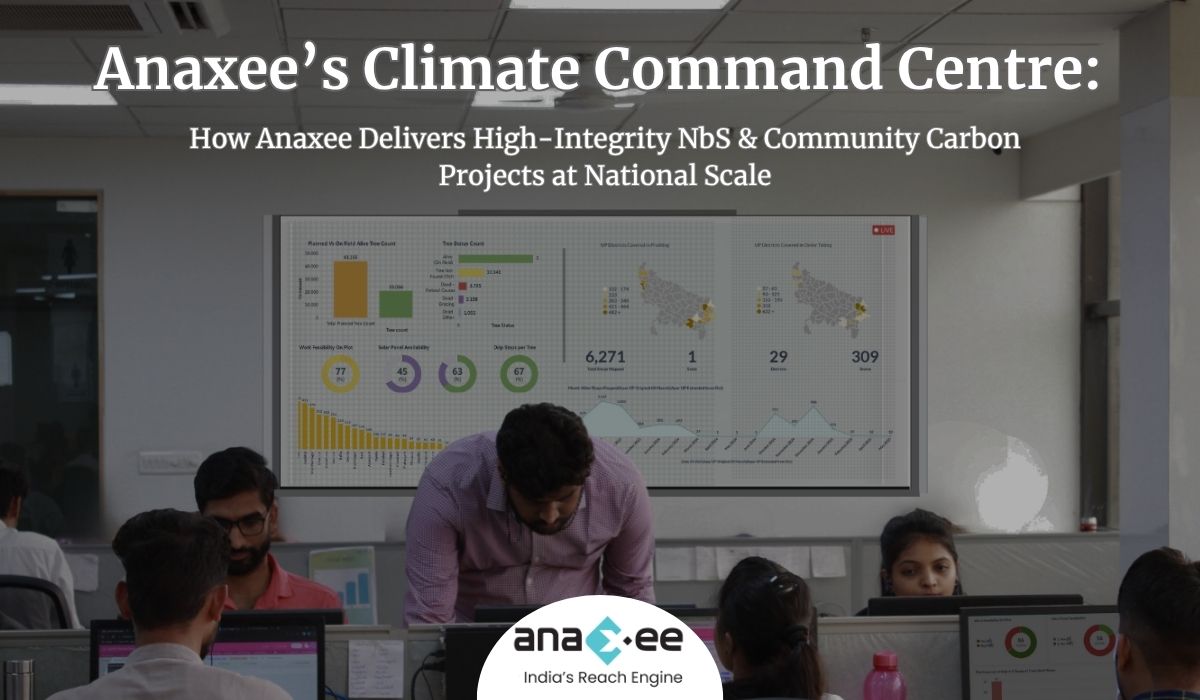
Anaxee’s Climate Command Centre: Carbon Projects with Precision and Scale

When most people think about carbon credit projects, they imagine forests being planted or cookstoves being distributed. But what they often overlook is the backend engine- the systems, people, and technology that make sure these projects are done correctly, at scale, and with trust. That engine, at Anaxee, is called the Climate Command Centre.

Let’s take you inside.

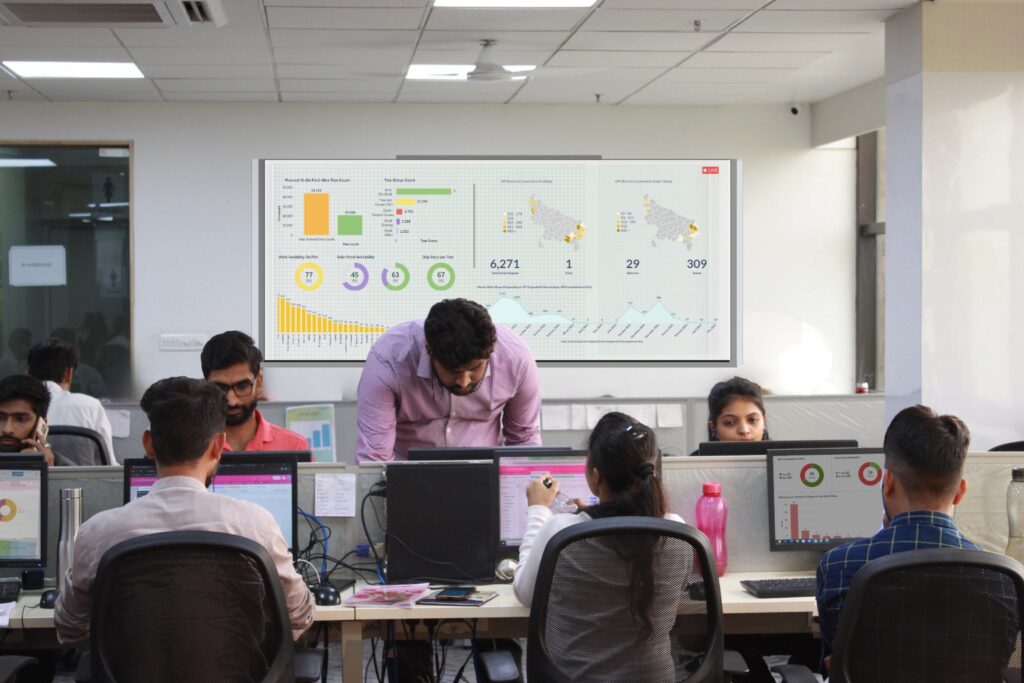
Dashborad on Wall, Anaxee's Climate Command Centre

What is the Climate Command Centre?

Anaxee’s Climate Command Centre is a centralised project management hub built to monitor and execute climate projects across thousands of locations in India. From tribal villages in Odisha to farming belts in Maharashtra, our Climate Command Centre operates like a control tower. It coordinates a workforce of 100,000+ Digital Runners, backed by a dedicated team of 125+ employees stationed at our headquarters.

While our Digital Runners collect ground-level data and engage with communities, our internal team reviews, guides, and manages the end-to-end lifecycle of each project.

We handle:

-Project planning & deployment

-Real-time monitoring of ground activity

-Continuous training

-Quality checks

-Data validations

-Beneficiary onboarding

-Dashboards and Reporting

Let’s break down how it all works.


Our Secret Weapon: 125+ Team Members Coordinating Every Step

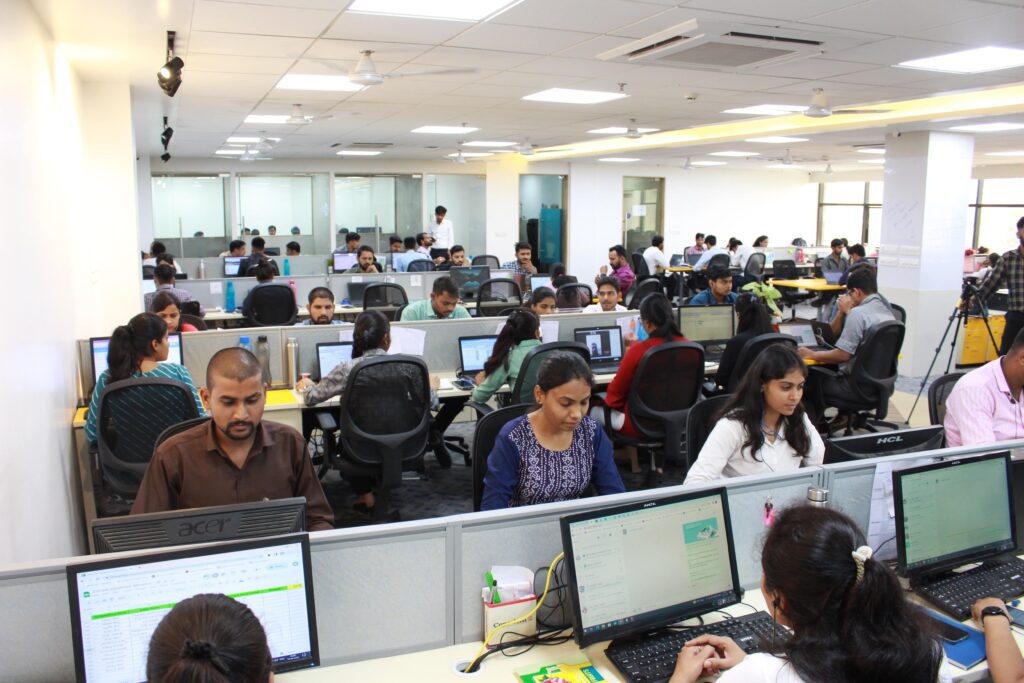
Office Staff Sitting/working in office for Carbon Climate Project

Executing a carbon project isn’t just about planting trees or delivering clean cookstoves. It’s about ensuring that every tree is planted at the right depth, every stove reaches a genuine beneficiary, and every piece of data is auditable. That level of precision is possible because of our dedicated 125+ team members, each assigned to specific processes.

Their work includes:

-Tracking Digital Runner activity in real-time

-Monitoring data uploads and location tagging

-Assigning and reassigning tasks based on data gaps

-Resolving field-level issues instantly

-Flagging quality issues for correction

Example: Agroforestry Monitoring

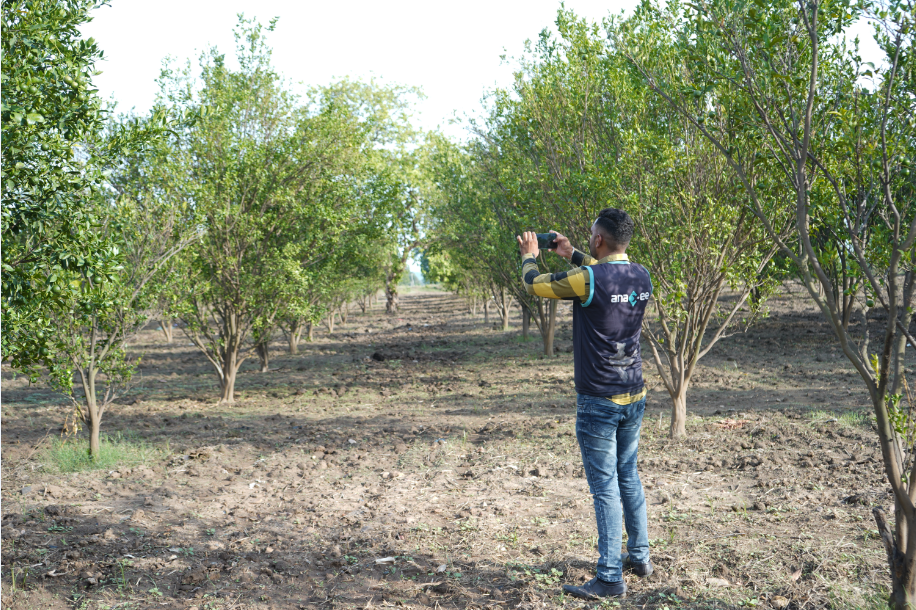
In agroforestry, Digital Runners geo-tag tree pits, click pre- and post-plantation photos, and record species-level data. Our internal team validates if the pits meet depth requirements (e.g., 1x1x1 ft), reviews timestamped photos, and ensures sapling count matches the project design. If any issue arises, immediate feedback is sent to the Runner with corrective instructions.

This is project management at the micro level, scaled up across 5000+ villages.


Localized Power: Why Digital Runners Are Key

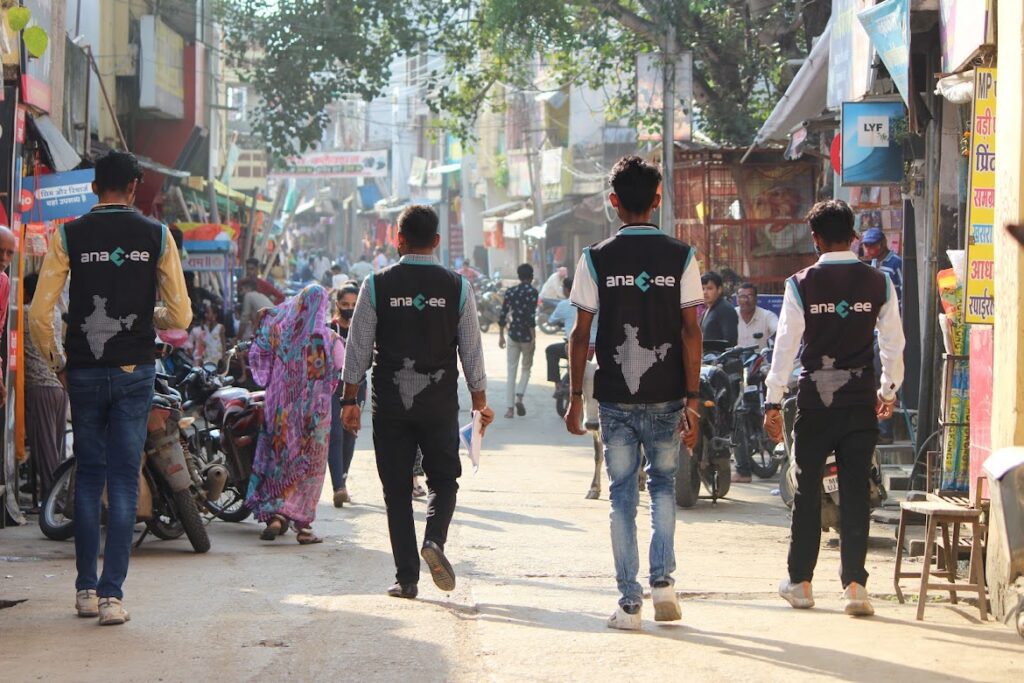
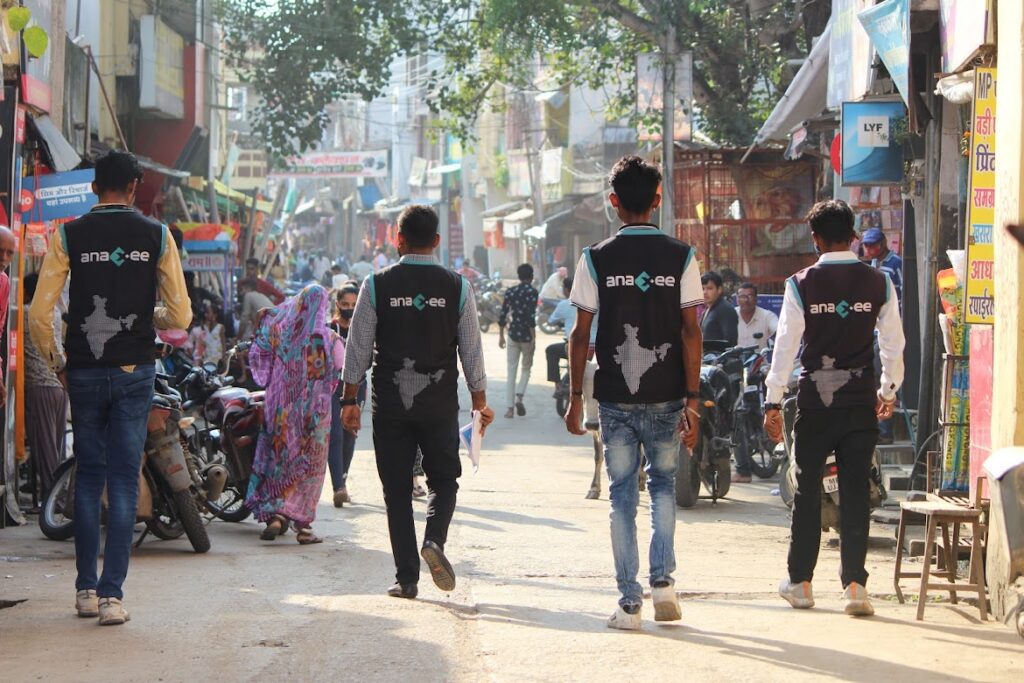
Four Anaxee Digital Runners in branded vests walk down busy market street to map retailers

Instead of parachuting people into rural areas, we hire Digital Runners from their own localities. This gives us several advantages:

-Trust: Locals are more welcomed by the community.

-Familiarity: They know local dialects, routes, and dynamics.

-Accountability: They stay in the same region and can be traced.

Digital Runners aren’t just data collectors. They are:

-Trained field agents

-Project ambassadors

-Beneficiary verifiers

We combine this local trust with robust backend support.


Training That Actually Works: From Zoom to Field

Before any Runner is activated, they go through a structured training program that includes:

-Video modules in regional languages

-Live Zoom sessions for Q&A

-On-ground field demos with supervisors

-Interactive quizzes to verify learning

Why Training Matters

Dashboard view of Different Climate Project Training for Digital Runners |Anaxee Digital Runners Training Portal

In an Agroforestry project, if a sapling is planted incorrectly (e.g., shallow pits, incorrect spacing), it could die within months—invalidating future carbon credits. Training ensures:

-Accurate spacing and layout of plantations

-Correct species mapping

-Understanding of the project’s climate goal

We don’t assume knowledge. We train for it, test for it, and track it.


Our Digital Stack: Real-Time, Transparent, Traceable

Technology is the backbone of our project management. We’ve built a full-stack system that includes:

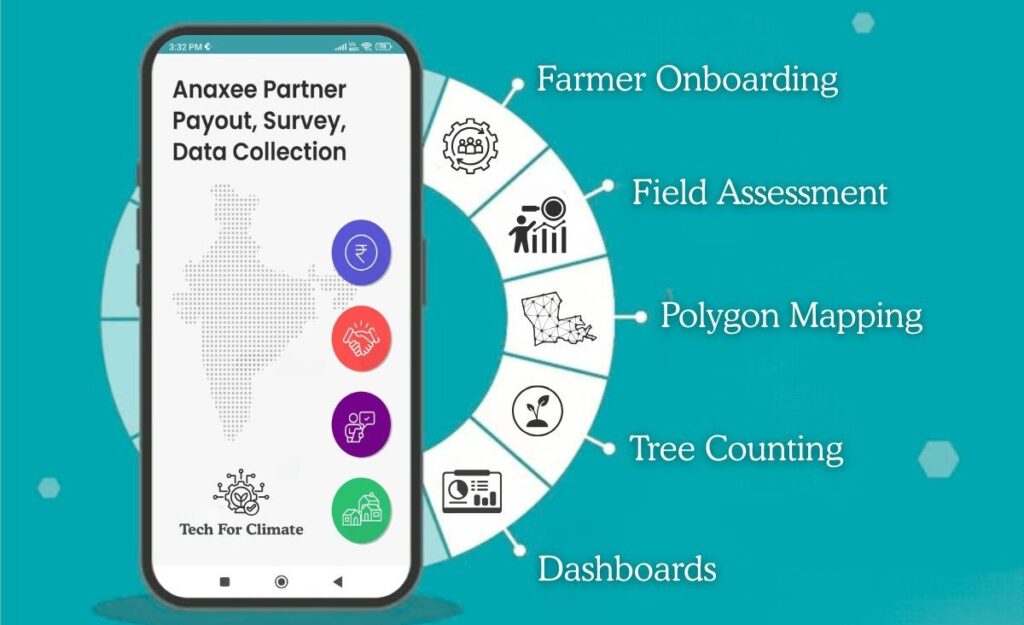
1. Anaxee Partner App
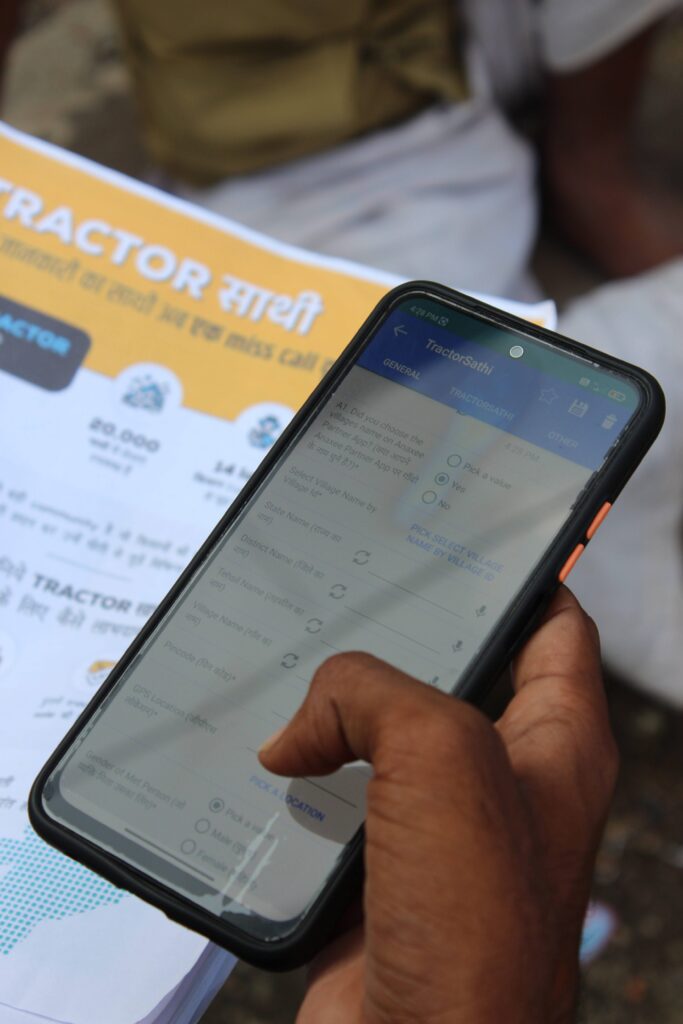
Anaxee's Digital Runner holding mobile phone on his hand, taking data of retailer for a Non FMCG project.

Used by Digital Runners to:

-Get assigned tasks

-Upload GPS-tagged images

-Fill in project forms

-Record feedback from the ground

2. Training Portal

-Video content

-PDF manuals

-Language-specific quizzes

-Score tracking for certification

3. dMRV Platform


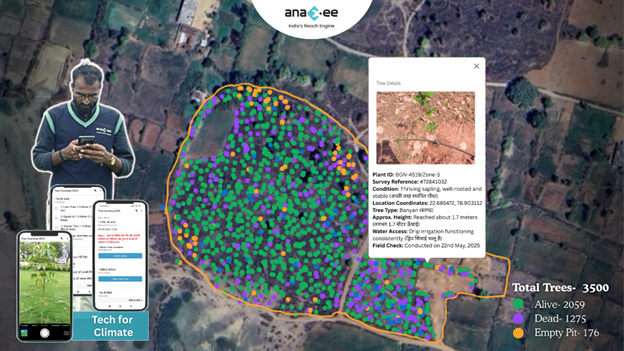
Tech For Climate, dMRV tool

-Real-time tracking of Runner activities

-Quality control triggers

-Data analytics for trends

-Integration-ready with Verra, Gold Standard protocols

This is Digital MRV (Measurement, Reporting, and Verification) in action.


How We Do Quality Check of Data

Every image, every GPS point, and every form is checked and validated.

Here’s how:

-Images are auto-checked for time, location, clarity

-GPS points are verified using backend maps

-Forms are run through logic rules (e.g., sapling count vs. land size)

-Duplicate entries flagged

If a data point fails any check, a feedback loop is triggered, and the Runner is notified instantly.

Example: Clean Cooking Project

For clean cookstove distribution:

-Digital Runners collect beneficiary info, stove images, and usage confirmation

-Our backend team filters for low-income families using demographic indicators

-Only eligible households are onboarded

-Follow-up calls validate usage


Beneficiary Selection: No Guesswork

We have set processes to identify and validate beneficiaries. For example:

In Improved Cookstove Projects:

-Runners first survey the household

-Mobile app captures cooking method, wood usage, and household size

-Data runs through filters (e.g., LPG vs. firewood users)

-Only wood-using households below income threshold are approved

This ensures high additionality and methodological integrity.


Dashboards That Tell the Truth

Every stakeholder, from project developers to auditors, wants visibility. We provide it through:

-Real-time dashboards for plantation progress

-Maps showing exact geo-coordinates of beneficiaries

-Status trackers for sapling survival, device usage

-Weekly reports downloadable in CSV or PDF

It’s transparency by design, not just as a reporting requirement.


Human + Digital: Our Hybrid Model

What sets Anaxee apart is this hybrid model:

-Humans on ground: For empathy, trust, adaptability

-Tech on cloud: For scalability, accuracy, auditability

This balance allows us to:

-Scale fast without losing quality

-Pivot quickly when field realities shift

-Maintain end-to-end control


We Don’t Just Run Projects. We Command Them.

Calling it a “Climate Command Centre” isn’t just branding. It’s an operational reality.

Whether we’re planting 10 lakh trees, distributing 1 lakh stoves, or mapping 50,000 acres of land, every step is managed, measured, and improved in real time.

And behind it all is a team that cares, tools that work, and a vision that scales.


Why This Matters

Carbon markets are shifting toward high-integrity, high-auditability projects. Gone are the days when a generic CSR report would suffice. Today, every credit must be backed by:

-Verified data

-Transparent processes

-Community co-benefits

Anaxee is ready. And the Climate Command Centre is where it all comes together.


Interested in Partnering with Us?

If you’re a project developer, carbon registry, CSR leader, or climate investor—reach out. See how Anaxee’s Climate Command Centre can become your execution backbone in India. Connect with us at sales@anaxee-wp-aug25-wordpress.dock.anaxee.com

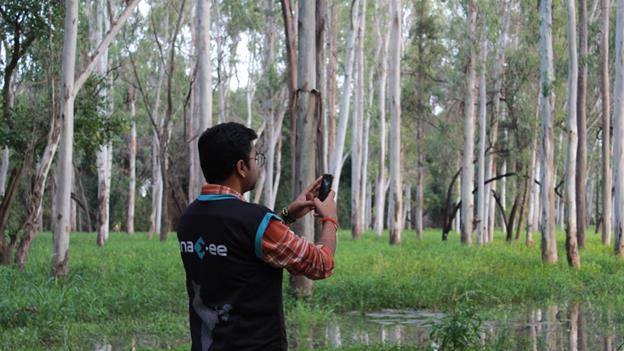
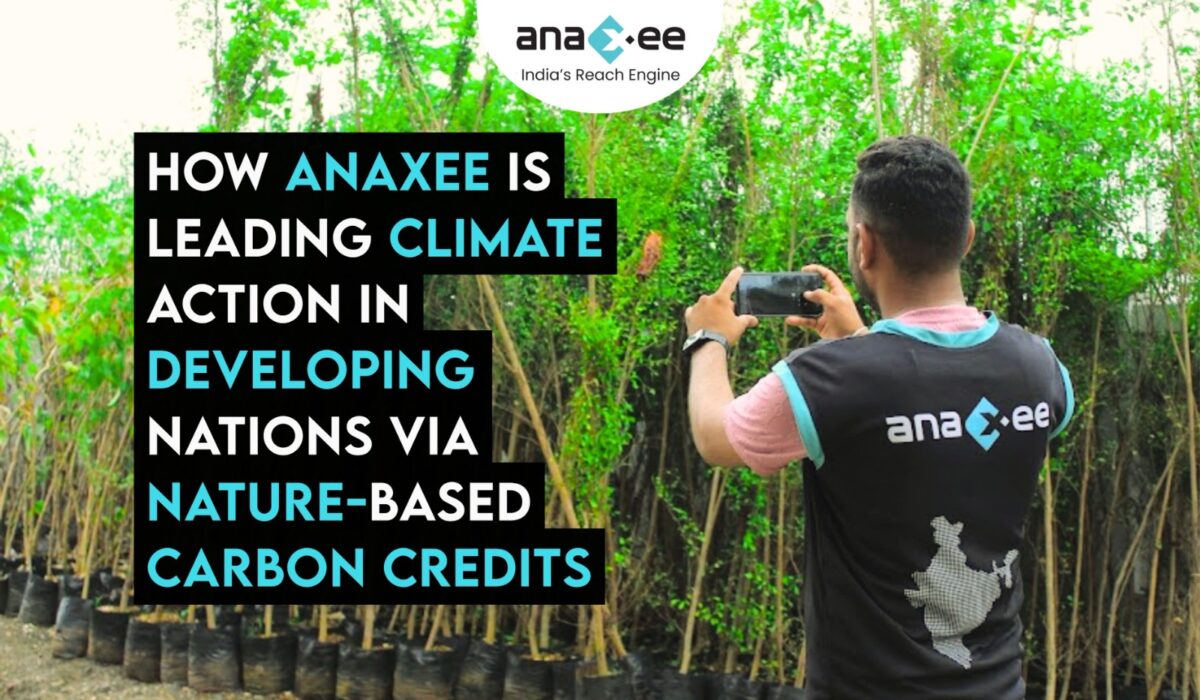
Anaxee representative capturing mobile data in a dense eucalyptus plantation, reflecting biodiversity and ecosystem restoration efforts aligned with nature-based carbon solutions.


Carbon Pricing in India: Decoding the Carbon Credit Trading Scheme (CCTS) and What It Means for Business in 2025‑30

Carbon Pricing in India: Decoding the Carbon Credit Trading Scheme (CCTS) and What It Means for Business

1. Why Carbon Pricing and Why Now?

India’s climate targets have teeth only if the cost of emitting carbon shows up on a CFO’s balance sheet. That is the simple logic behind carbon pricing—a policy tool that forces emitters to internalise the social cost of greenhouse‑gas (GHG) pollution. New Delhi is no stranger to market‑based regulation (think PAT, RECs), but 2025 is different. We now have a formal rate‑based Emissions Trading System (ETS) embedded in the Carbon Credit Trading Scheme, 2023–24 (CCTS), backed by amendments to the Energy Conservation Act.

In other words, India is putting a price on carbon intensity rather than absolute tonnes. The shift is subtle but game‑changing for a fast‑growing economy that still needs to expand energy supply.

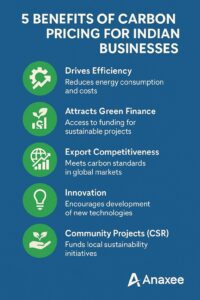
Infographic titled “5 Benefits of Carbon Pricing for Indian Businesses” summarising advantages—drives efficiency, attracts green finance, boosts export competitiveness, sparks innovation, and funds community projects—using simple green icons against a blue background with Anaxee logo.

2. India in the Global Carbon‑Pricing League

According to the World Bank’s “State and Trends of Carbon Pricing 2025”, India now sits in the same emerging‑economy cohort as Brazil, China, and Türkiye when it comes to regulated carbon markets.

– Coverage: Nine energy‑intensive sectors at launch—power, iron & steel, cement, aluminium, fertiliser, pulp & paper, petro‑refining, chemicals and textiles.

– Instrument: Rate‑based ETS + domestic voluntary offset window.

– Benchmark: Emission‑intensity targets, not a hard cap.

– Timing: Compliance cycle expected FY 2025‑26; voluntary methodologies approved March 2025.

Is this ambitious enough? Maybe not. But it’s a pragmatic design for an economy where absolute caps could stifle growth.


3. A Quick History of India’s Carbon‑Pricing Instruments

What sticks out?

  1. Tax vs Trade: India leaned on an implicit coal tax while the EU went cap‑and‑trade.
  2. Intensity, not Caps: Every scheme is benchmarked to intensity—consistent with a developing economy narrative.
  3. Administrative Lean: BEE is the common operator, so institutional memory transfers over.

4. The Legal Backbone: Energy Conservation (Amendment) Act, 2022

This amendment gave the central government explicit power to issue, trade, and retire carbon‑credit certificates. It also created statutory room for voluntary credits—a carve‑out many exporters wanted as CBAM pressure rose.

Key Provisions:

-Section 14A: Authorises central registry for carbon certificates.

-Section 58: Empowers BEE as market administrator.

-Penalty Clause: Non‑compliance fines up to two times market price of CCCs—enough to make CFOs sweat.


5. Anatomy of the Carbon Credit Trading Scheme (CCTS)

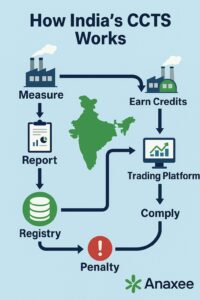
Infographic illustrating how India’s Carbon Credit Trading Scheme (CCTS) works, showing sequential steps—measure emissions, report data, record in registry, earn or buy carbon credits via trading platform, comply, and penalty for non‑compliance—using factory, chart, database, and warning icons with a map of India and Anaxee logo.

5.1 Compliance Mechanism

-Obligated entities must meet annual emission‑intensity targets.

-Over‑achievers receive Carbon Credit Certificates (CCCs); under‑performers must buy them or pay a penalty.

-MRV protocol follows ISO 14064 and IPCC 2006 guidelines.

5.2 Offset Mechanism (Domestic Voluntary Market)
Eight approved methodologies (renewables, green hydrogen, energy efficiency, mangrove AR, etc.) allow non‑ETS players to generate credits. Credits can be sold into the compliance market or to corporates chasing net‑zero pledges.

5.3 Registry & Trading Platform
An electronic trading platform is being built on power‑exchange infrastructure (IEX/PXIL) to avoid reinventing the wheel. Settlement cycle mirrors India’s short‑term power market (T + 1).


6. Rate‑Based ETS vs Cap‑Based ETS: A Critical Look

The trade‑off is clear: India opts for economic flexibility over guaranteed tonnage reductions. That choice invites scrutiny from trading partners—hence the CBAM threat.


7. CBAM: The External Price Tag India Can’t Ignore

The EU’s Carbon Border Adjustment Mechanism enters its financial phase in January 2026. Analysts estimate Indian steel exporters could face ₹19,000 cr in CBAM charges by 2030 unless they decarbonise.

Negotiators are scrambling to protect exports, but the simplest antidote is a robust domestic carbon‑pricing system that proves “equivalent effort.” India’s shift from coal cess to CCTS is partly a CBAM‑defence strategy.


8. Sector‑by‑Sector Readiness


9. Numbers That Matter

-Coal Cess Pool: ~₹54,000 cr collected (FY 2010‑25). Little of it has flowed to climate projects—an efficiency gap CCTS aims to fix.

-Potential Market Size: BEE projects CCC demand at 180 MtCO₂e by 2030—roughly a ₹45,000‑crore annual market assuming ₹250/t average price.

-Voluntary Credits Pipeline: 8 approved methodologies could unlock 50 MtCO₂e offsets annually by end‑decade.


10. The Data & MRV Challenge—And Why Tech Players Like Anaxee Matter

Carbon pricing lives or dies on Measurement, Reporting & Verification (MRV). India’s grid is patchy with emission‑factor data, and many mid‑tier plants lack automated monitoring.

Where Anaxee fits:

  1. Last‑Mile Data Collection: With runners in 26,000+ villages, field‑level energy audits and biomass assessments feed verifiable project data into the registry.
  2. Digital MRV (dMRV): Mobile‑first data capture plus blockchain‑anchored audit trails reduce double‑counting risk—critical for credit quality.
  3. Community Projects: CCTS offset window covers mangroves, clean cooking, agro‑forestry. Anaxee’s rural network accelerates baseline surveys and credit issuance.

Bottom line: Carbon pricing is as strong as its data plumbing; that plumbing is a tech and outreach problem more than a policy one.


11. Pain Points No One Should Ignore

  1. Price Volatility: Without a price collar, CCCs could swing like RECs did in 2016.
  2. Registry Interoperability: Alignment with international standards (ICVCM, VCMI) is still work‑in‑progress.
  3. Delayed Penalties: Collection of non‑compliance fines historically lags in India’s power market—watch this space.
  4. Equity Concerns: SMEs outside top nine sectors risk being left behind unless voluntary credit pathways become affordable.

12. What Indian Corporates Should Do in the Next 12 Months


13. Policy Recommendations (Straight Talk)

  1. Transition Coal Cess into a True Carbon Tax
    Hypothecate proceeds to a Price‑Stability Fund for CCCs rather than general revenue.
  2. Introduce a Price Collar
    Floor ₹150, ceiling ₹600/t to avoid the REC‑type boom‑bust.
  3. Fast‑Track Scope‑3 Methodologies
    Especially for agriculture and logistics—critical to decarbonise rural supply chains.
  4. Integrate with GST IT Backbone
    Automate certificate retirement and penalty collection through existing e‑invoice rails.
  5. Build a CBAM‑Readiness Portal
    Public carbon‑intensity disclosure for exporters; makes customs paperwork smoother.

14. The Road Ahead: Intensity Today, Absolute Caps Tomorrow?

India’s rate‑based ETS is a start, not an end. The net‑zero 2070 goal will eventually require tonnage caps and negative‑emission pathways (biochar, DAC). Expect:

-CCTS Phase 2 (2028‑30): Expand to shipping and aviation bunkers.

-Cap‑Hybrid by 2032: Combine intensity with sectoral caps once GDP growth stabilises below 6 %.

-International Linkages: Potential pilot linkage with Singapore’s carbon market for tokenised credit swaps.


15. Conclusion

Carbon pricing in India is no longer an academic debate. With the CCTS clock ticking and CBAM looming, the cost of carbon will soon appear on every corporate ledger—either as a tradable certificate, an import tax, or a reputational hit. Companies that invest early in credible data, verifiable reductions, and community‑positive offsets will not just dodge penalties; they’ll gain an export edge and access to cheaper green capital.

For players like Anaxee, the opportunity is to convert last‑mile execution expertise into the plumbing that India’s carbon market desperately needs. Data is the new oil, but in carbon pricing, data is the new oxygen—without it, nothing survives.


Call to Action
Ready to future‑proof your carbon strategy? Connect with us at sales@anaxee-wp-aug25-wordpress.dock.anaxee.com


About Anaxee: 

Anaxee drives large-scale, country-wide Climate and Carbon Credit projects across India. We specialize in Nature-Based Solutions (NbS) and community-driven initiatives, providing the technology and on-ground network needed to execute, monitor, and ensure transparency in projects like agroforestry, regenerative agriculture, improved cookstoves, solar devices, water filters and more. Our systems are designed to maintain integrity and verifiable impact in carbon methodologies.

Beyond climate, Anaxee is India’s Reach Engine- building the nation’s largest last-mile outreach network of 100,000 Digital Runners (shared, tech-enabled field force). We help corporates, agri-focused companies, and social organizations scale to rural and semi-urban India by executing projects in 26 states, 540+ districts, and 11,000+ pin codes, ensuring both scale and 100% transparency in last-mile operations.

Ready to collaborate on your next Climate or Carbon project?
Email us at: sales@anaxee-wp-aug25-wordpress.dock.anaxee.com

Drone Tree Counting for Agroforestry Project in India


Winning Beyond Compliance: How Carbon Markets Can Sharpen Your Competitive Edge

Winning Beyond Compliance: How Carbon Markets Can Sharpen Your Competitive Edge

“If you see carbon pricing only as a cost, you’re leaving money on the table.”

1 . Why “Just Comply” Is Yesterday’s Game

The global rule‑book on emissions is tightening fast. Europe launches the Carbon Border Adjustment Mechanism (CBAM) in 2026; the U.S. is floating similar tariffs. A July 2025 study shows that two‑thirds of India’s ₹ 82 lakh‑crore export basket now faces net‑zero regulation risk. 
Merely hitting domestic caps will not protect market share- firms must out‑perform peers on carbon intensity and prove it.

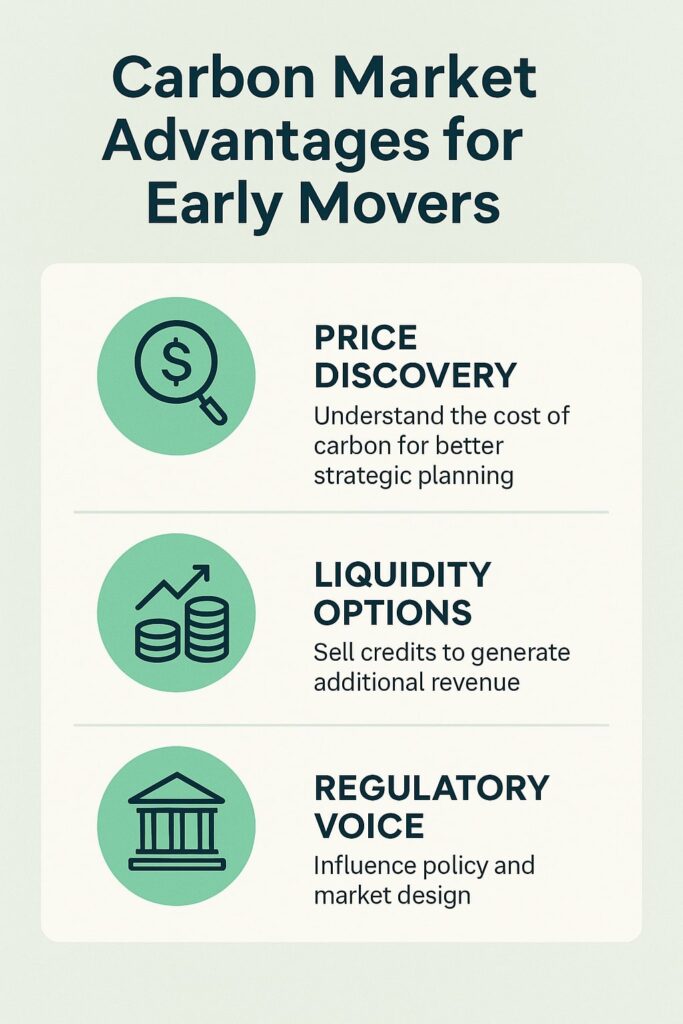
“Vertical infographic on a light mint background titled ‘Carbon Market Advantages for Early Movers,’ featuring three rows with teal circular icons and text blocks: a magnifying-glass-and-dollar icon for ‘Price Discovery,’ stacked-coins-with-arrow icon for ‘Liquidity Options,’ and a courthouse icon for ‘Regulatory Voice.’”

2 . Inside India’s Emerging Carbon Market

The Carbon Credit Trading Scheme (CCTS) aims to merge the older PAT programme into a fungible, market‑wide mechanism by 2026. Draft regulations adopted in July 2024 lay out a compliance market for nine hard‑to‑abate sectors and a voluntary window for the rest.
Early movers gain three advantages:

  1. Price Discovery – Knowing the real rupee cost of each tonne avoided.

  2. Liquidity Options – Buy, bank, or sell credits depending on strategy.

  3. Regulatory Voice – Shape rules through pilot participation.


3 . Compliance vs. Competitive Edge

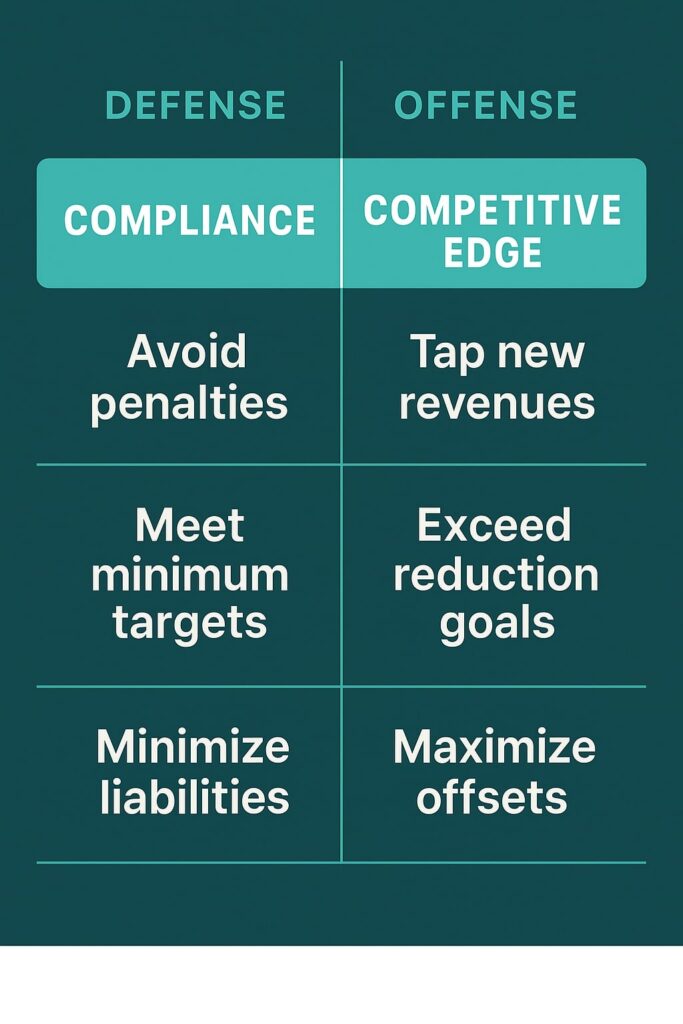
“Two-column infographic on a dark-teal background. Left column (DEFENSE) is labelled ‘Compliance’ and lists ‘Avoid penalties,’ ‘Meet minimum targets,’ ‘Minimize liabilities.’ Right column (OFFENSE) is labelled ‘Competitive Edge’ and lists ‘Tap new revenues,’ ‘Exceed reduction goals,’ ‘Maximize offsets.’ A thin vertical divider separates the columns.”

Think of compliance as defence—avoid penalties. Competitive edge is offence:


4 . Set an Internal Carbon Price—Not a Token Fee

Global best practice clusters around these steps:

  1. Benchmark external signals – EU ETS forward price, voluntary market averages.

  2. Pick a tiered price – e.g., ₹1,500 / t in 2025 → ₹3,000 / t in 2030.

  3. Hard‑wire into capex approvals. No shadow price, no green light.
    According to EY India, firms monetising surplus reductions can recycle cash into further R&D, locking in a virtuous cycle of lower costs and higher brand value.


5 . Guard Against Carbon Border Taxes

For exporters of steel, aluminium, fertiliser or cement, avoiding CBAM fees could mean the difference between a 6 % margin and a loss‑maker. Map three zones:

-Red: High‑carbon, tariff‑hit goods—urgent decarbonisation.

-Amber: Medium‑risk products—offsets + supplier engagement.

-Green: Low‑carbon portfolio—opportunity for premium pricing.

Use CCTS allowances plus certified offsets to pull Amber into Green before 2026.


6 . Build a Balanced Credit Portfolio

Nature‑based Solutions (NbS) offer lower first‑cost but higher permanence risk; tech‑based removals are pricey yet durable. A 70‑20‑10 split (energy efficiency | NbS | engineered removals) hedges both integrity and cost. Remember: under India’s draft rules, only a limited share of compliance can be met by offsets—keep them for the hard‑to‑abate tail.

7 . Digital MRV: Transparency as Brand Ammunition

Slide imagery from the album highlights QR‑coded tree tags and satellite‑verified biomass. That is exactly the Tech‑for‑Climate stack Anaxee runs in its Bund Plantation projects (VM0047). Real‑time dashboards slash verification delays from 18 months to 6 weeks and cut third‑party audit costs by ~35 %. Clients can embed live project links on product pages—turning data into marketing collateral.


8. Financing the Journey

Combine three pools:

  1. Green Debt – Cheaper cost of capital tied to emission metrics.

  2. Carbon Credit Revenue – Sell surplus or forward‑contract to offtakers.

  3. CSR Budgets – Align social projects with climate co‑benefits (rural livelihoods, agroforestry).

PolicyCircle pegs India’s domestic carbon market opportunity at $200 billion by 2030—enough headroom to finance deep decarbonisation.


9. Sector Snapshots

Steel – Start blending scrap‑based EAF routes; hedge residual emissions with high‑integrity credits.
IT Services – Scope 2 is the bully; sign 24×7 green‑power PPAs and monetise unclaimed RECs.
Cement – Pilot calcined‑clay blends; bank early CCTS allowances, sell excess when price spikes.


10. Anaxee’s Last‑Mile Advantage

Where typical consultants stop at strategy slides, Anaxee Digital Runners executes on the ground:

-Data Collection Network: 40,000 rural runners feed field data directly into dMRV apps.

-Geo‑Tagged Evidence: Every tonne comes with photo & GPS proof.

-End‑to‑End Service: From farmer onboarding to registry issuance—zero middle‑layers.

That reduces project cycle time by about 30 % vs legacy models, freeing cash sooner for reinvestment.


11. Action Plan—90 Days to Carbon Edge

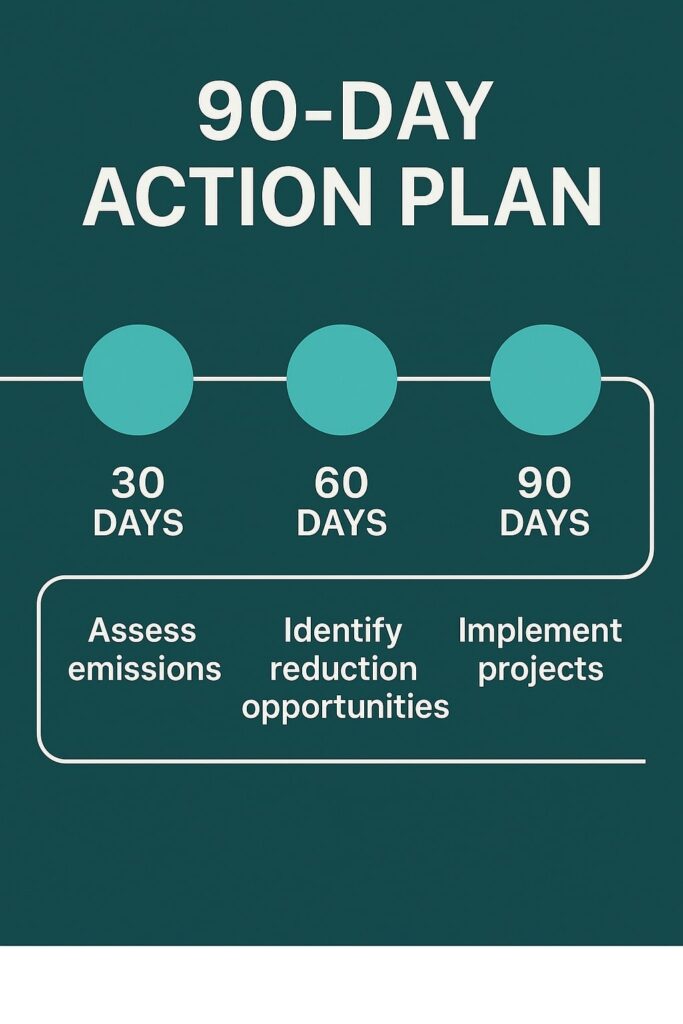
Timeline graphic on a teal background with three evenly spaced teal circles connected by a white line. Each circle is labelled 30, 60, and 90 days respectively. Below, a rectangular callout links the circles to actions: ‘Assess emissions,’ ‘Identify reduction opportunities,’ and ‘Implement projects.’ Title at top reads ‘90-DAY ACTION PLAN.

12. FAQs

Q: Will CCTS prices start low and stay low?
A: Early prices may sit near ₹800‑₹1,000/t, but international linkage or CBAM pressure could triple quotes within five years. Hedge early.

Q: Offsets have a bad rep—isn’t that risky?
A: Integrity scandals stem from poor MRV and additionality gaps. Demand projects with transparent baselines, conservative buffers, and digitised monitoring—exactly where Anaxee specialises.


13. Key Takeaways

-Compliance is the floor, not the ceiling.

-Carbon markets can fund innovation, protect exports, and even open new revenue streams.

-Digital transparency is your moat.


14. Internal Linking Suggestions

-Link “Bund Plantation projects” to your VM0047 SOP blog.

-Point “Digital MRV pilot” to your dMRV explainer post.

-Cross‑link “Green Debt” to your carbon‑finance‑grants article.


15. Suggested Visual Assets (call on slides)

Graphic Where to insert Alt Text
Bar chart of forecast CCTS prices 2025‑2030 After Section 8 “Projected CCTS allowance price curve 2025‑30”
Infographic: 90‑Day Action Plan Section 11 header “Roadmap to carbon‑competitive advantage”
Photo collage from album: QR‑tagged saplings & satellite overlay Section 7 “Digital MRV in action—field data to registry dashboard”

16 . Call to Action

Ready to turn carbon costs into competitive muscle? Talk to Anaxee’s Climate Team- we’ll map your risks, source high‑integrity credits, and digitize proof so you can brag about it. Connect with us at sales@anaxee-wp-aug25-wordpress.dock.anaxee.com

End‑to‑End Go‑To‑Market Strategy in India: How Anaxee Delivers 100 % Market Coverage with Digital Runners

The Definitive GTM Playbook for India

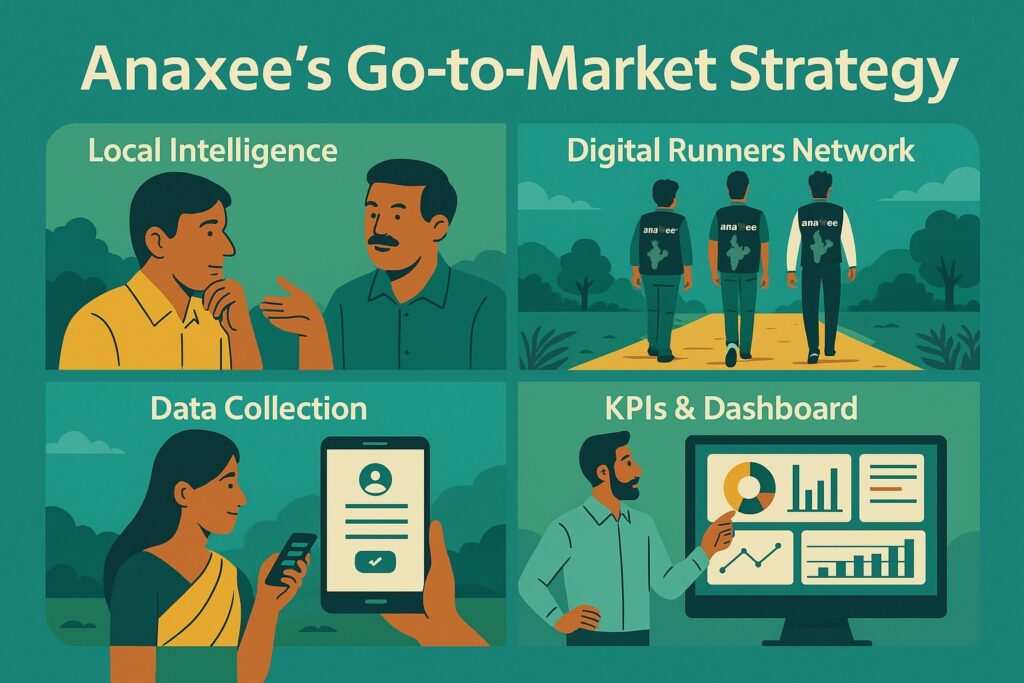
Four-panel visual of Local Intelligence, Digital Runners, Data Collection and KPI Dashboard

1. Why India Needs a Different Kind of GTM

Ask any sales head what keeps them up at night and you’ll hear the same pain points: fragmented retail, unpredictable distributor commitment and glaring coverage gaps between urban, tier‑3 and rural outlets. India has 15 million retail shops but fewer than a million are fully serviced by organized distribution. Traditional “appoint‑a‑dealer‐and‑pray” tactics no longer cut it.

Core problem: brands run blind. They don’t know how many relevant outlets actually exist or why a supposedly active territory is selling only half its potential. Without data, there is no precision.

Anaxee’s answer is a ground‑truth‑first model built on three sequential levers—Market Mapping → Retailer Profiling (KYR) → Order Taking—executed by a pan‑India on‑demand workforce called Digital Runners.

Three-tier funnel showing Market Mapping, Retailer Profiling and Order Taking in teal-orange palette

2. The Three‑Lever Framework Explained

Only when all three layers stack do brands unlock predictable growth.


3. Lever 1 – Market Mapping: Turning the Lights On

Imagine entering a dark warehouse with a torch. Mapping is that torch:

  1. Define universe – agree SKU families and retail formats (kiranas, chemists, agri‑input, hardware…).

  2. Deploy Digital Runners – each Runner carries an app that geo‑tags the shop front, captures frontage photo and auto‑transcribes address.

  3. Classify – AI inside the app labels store type and potential A/B/C class so territory managers can sequence focus.

Case Snapshot: In Eastern Uttar Pradesh, a durables brand believed it had “covered” Gorakhpur. Mapping showed only 140 of 404 relevant outlets carried even one SKU. Within six weeks of visibility the gap halved.

Why CFOs care: mapping costs < ₹15 per outlet, yet prevents crores in wasted trade schemes sprayed at the wrong retailers.


4. Lever 2 – Retailer Profiling: Knowing Every Shop’s DNA

With universe locked, Runners revisit each outlet to run a KYR form that asks:

-Current brands and SKUs

-Buying source & credit days

-Monthly offtake volume

-Service pain‑points

-Owner’s brand affinity score (a simple 1–5 star slider)

Data flows real‑time to a dashboard that slices opportunity by SKU gap, distributor influence and credit risk.

Patterns jump out:

-22 % of hardware stores stocked the client’s competitor only because of 15‑day faster service.

-40 % of C‑class rural outlets could up‑trade if small packs were introduced.

These are fact‑based triggers for marketing, finance and product teams.


5. Lever 3 – Order Taking: From Insight to Cash

Anaxee GO to Market Workflow, Digital runner Mapping, Profiling, Taking Orders, digital proofing, and repeating the cycle

Profiling converts to revenue only when every rep visit ends with a digital order.

How it works

  1. Runner opens the shop’s profile; app auto‑suggests missing SKUs.

  2. Owner confirms quantities; digital signature locks order.

  3. System pushes PO to assigned distributor; both brand and Runner track fulfilment.

  4. Runner collects feedback on next visit → closed‑loop learning.

One Gorakhpur outlet said “maybe later” three times. The fourth visit—armed with KYR intel on credit pain‑points—landed a ₹5 000 trial order, doubled to ₹10 000 within 30 days.

On‑demand model: Runners are paid per productive visit, so brands avoid heavy fixed FOS payroll yet get the rigour of daily call‑cycles.


6. Technology Spine

-GPS + time stamps – eliminates fake visits.

-Photo proof – verifies merchandising execution.

-AI audit – flags blurry photos, wrong SKU display.

-API hooks – integrate with SAP, Dynamics or any ERP so existing dashboards light up automatically.

-Distributor portal – mini‑CRM for smaller partners who lack sophisticated systems.


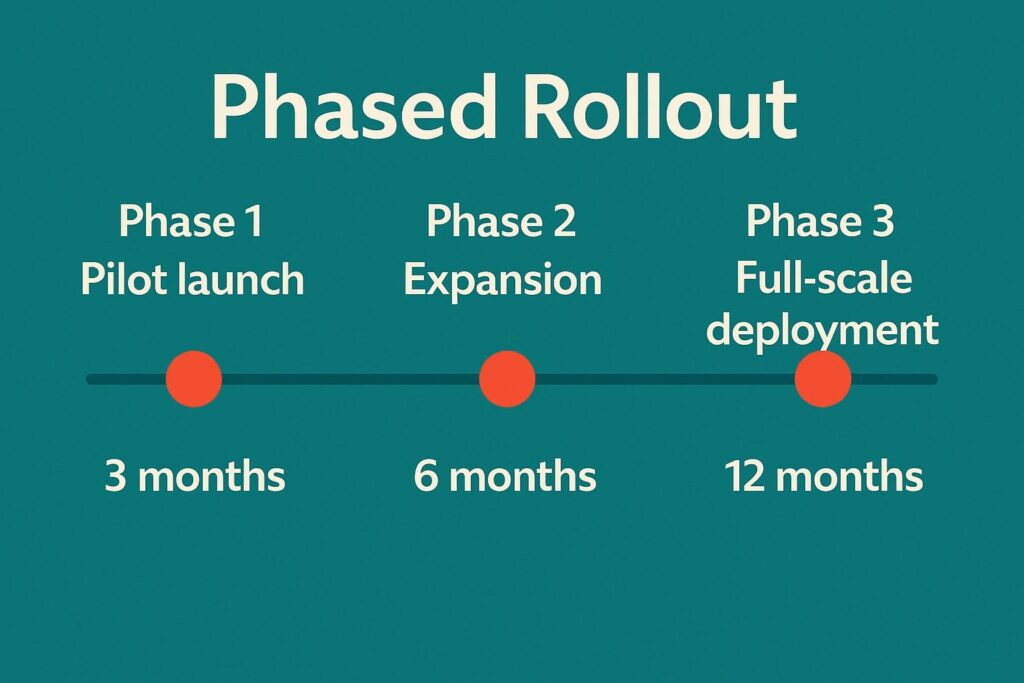
7. Phased Roll‑Out for Rapid ROI

Teal timeline with Phase 1 Pilot, Phase 2 Expansion and Phase 3 Full-Scale Deployment markers

A phased map avoids budget dilution and creates motivational success stories for the field force.


8. KPIs That Actually Matter

  1. Coverage Ratio – outlets buying ≥1 SKU ÷ total mapped outlets (target 70 % in 12 months).

  2. SKU Depth – average SKUs per outlet (target 4+ in durables; 6+ in FMCG).

  3. Average Order Value (AOV) – ₹/order via app; measure MoM lift.

  4. Distributor Fulfilment Lead Time – ≤72 h for 95 % of orders.

  5. Cost per Activated Outlet – total spend ÷ first‑order outlets; benchmark against trade‑scheme burn.

Dashboards refresh every 24 hours, preventing end‑quarter shocks.


9. Building a Distributor‑First Culture

Brands often fear tech will alienate channel partners. Anaxee flips that:

-Lead Generation – all mapped outlets funnel to nearest distributor.

-Demand Predictability – app orders level out the month so trucks run full week two, not just month‑end.

-Credit Control – KYR data warns of risky outlets, helping distributors reduce bad debt.

When distributors realise the system drives incremental sales (not bypass), adoption soars.


10. Common Pitfalls & Pro Tips


11. Beyond Sales: How Brands Re‑Use the Data

-Marketing ROI – map helps geo‑target billboards within 1 km of high‑potential clusters.

-New Product Launch – KYR flags unmet needs—e.g., battery brand launched solar‑inverter combo after 38 % retailers requested it.

-Supply Chain – aggregated orders guide warehouse location planning.

-Finance – outlet‑level cash‑cycle insight sharpens credit policies.

Data gathered once continues to pay dividends quarter after quarter.


12. Real‑World Outcomes


13. Implementation Roadmap (First 90 Days)


14. Why the Digital Runner Model Wins

-Elastic Field Force – scale up or down by district without hiring freezes or layoffs.

-Uniform Execution Quality – one training module, one app; data audits police compliance.

-Cost Advantage – pay‑per‑productive‑visit model keeps CAC predictable.

-National Footprint – 11 000+ pincodes already covered, so expansion is weeks not months.

In essence, Runners bring the granularity of a company salesman with the flexibility of gig economics.


15. Frequently Asked Questions

Q1. Is this only for non‑FMCG?
No. FMCG giants use mapping too, but Anaxee’s model shines where traditional pull is weak—durables, agri‑inputs, fintech, pharma OTC and even EV charging networks.

Q2. What if my distributor refuses tech?
Distributors get free dashboards, lead allocation and faster sell‑out. Adoption rates exceed 90 % once they see incremental orders.

Q3. How many visits do Runners make before an outlet activates?
Average is 2.7 touches. High‑ticket durables take 3‑4; FMCG impulse SKUs convert in 1‑2.

Q4. Can I integrate my SAP?
Yes—REST APIs push orders and retailer IDs straight into any ERP or DMS.

Q5. Do I lose control of my brand?
No. You set price, credit and promo rules; Runners follow SOP scripted in the app.


16. Call to Action

Ready to plug predictable growth into your distribution? Book a 30‑minute demo to see live dashboards for your top target districts and calculate your potential Cost per Activated Outlet before you spend a rupee.
Connect with Anaxee at sales@anaxee-wp-aug25-wordpress.dock.anaxee.com

Four Anaxee Digital Runners in branded vests walk down busy market street to map retailers


Discover India’s 100-plus largest steel makers ranked from Arcelor-Mittal Nippon to JSW, straight from the 2025 CCTS notification.


100 Biggest Steel Manufacturing Companies in India (CCTS 2023 list, updated 2025)

“Steel is the backbone of infrastructure, and decarbonizing steel is the backbone of India’s net-zero plan.”
— random coffee-table chat at Bhilai, February 2025

1. Why a fresh look at India’s steel giants?

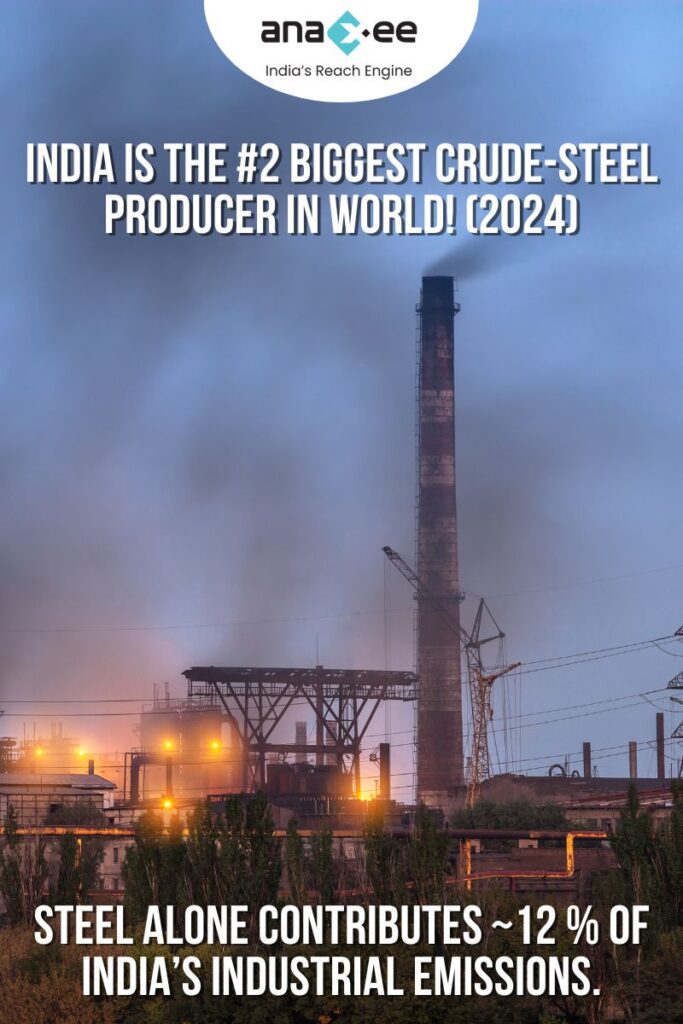
India just closed 2024 as the world’s #2 crude-steel producer at ~150 million tonnes, up 6 % YoY according to Worldsteel’s December release. The ramp-up is great for GDP—and a nightmare for carbon budgets: steel alone contributes ~12 % of India’s industrial emissions.
Vertical banner showing a smoky steel plant at dusk with text: ‘India is the #2 biggest crude-steel producer (2024). Steel emits ~12 % of India’s industrial CO₂.

That’s why the Carbon Credit Trading Scheme (CCTS) 2023 matters. It forces every energy-intensive plant to hit Greenhouse-gas Emission-Intensity (GEI) targets or buy credits. In June 2025 the Gazette published a 260-plant steel roster with baseline output, GEI, and targets.


2. Fast-forward trends:

Trend What it means for you
Capacity binge continues – Five projects totalling 25 Mt are slated by JSW, Tata, and AM/NS by 2028. Procurement teams will feel the squeeze on scrap and DR-grade pellets; prices could climb 10 % YoY by 2027.
Hydrogen DRI pilots – JSW (Dolvi) and Tata (Kalinganagar) have announced H₂-DRI trials for 2026–27. EPCs & electrolyser vendors: massive tender opportunity. Also watch for green-hydrogen offtake contracts.
CCTS credit prices – Early mock-trades hint at ₹850–₹1 050/tCO₂ for 2026 compliance. Plants above target GEI can monetise over-performance; laggards face double-penalty via CPCB fines.
Blast-furnace relines – Capex expected to exceed ₹60 000 cr through 2030 as ageing BF at Bhilai, Bokaro, and Rourkela hit end of life. OEMs and refractory suppliers should prepare bids early- CPTS data expose who must act first.
Anaxee value-add – Our 50 000 Digital Runners can survey, monitor, and MRV ESG projects at hundreds of dispersed sites Integrity, Transparency, Accountability into your Projects

3. The long-list in plain English

Below we talk you through the who’s-who of Indian steel, peppered with fun snippets so it doesn’t read like a Wikipedia dump. Scroll straight to the table if that’s all you need.

3.1 Big-five behemoths

  1. JSW Steel, Vijayanagar – Largest single-location capacity; now flirting with green hydrogen.

  2. Tata Steel, Jamshedpur – India’s oldest integrated mill (1907!) and still a tech trend-setter.

  3. ArcelorMittal Nippon Steel India (AM/NS), Hazira – The JV everyone’s watching after the aborted Nippon-U.S. Steel deal. 

  4. SAIL – Split across Bhilai, Bokaro, Rourkela, IISCO, Durgapur. Each site has separate GEI targets.

  5. Jindal Steel & Power, Raigarh – First Indian mill to try coal-gasification DRI at scale.

3.2 Mid-tier climbers

– Bhushan Power & Steel, Sambalpur – Rising fast post-Insolvency.

– JSW Ispat Special Products – Mandir Hasaud unit now under JSW, expecting 20 % GEI drop by 2027.

– A-One Steels & Alloys, Ballari – Classic sponge-iron-to-BF upgrade route.

3.3 Niche & regional players

– Ferro-alloy specialists like Balasore Alloys and Indian Metals & Ferro Alloys – small-volume but carbon-intensive (GEI 4-8 tCO₂/t).

– North-East mini-mills such as Shyam Century Ferrous (Meghalaya) – high transport footprint; ripe for rail electrification.

…and so on until the list hits 120 names.


4. List of Steel Giants – CCTS Notification list (Rank Wise): 

Rank Company Baseline_output_tonnes Current_GEI_tCO2_per_t Target_GEI_2025_26_tCO2_per_t
1 JSW STEEL LTD, Vijayanagar Works, Toranagallu, Bellary 11739649 2.6293 2.5754
2 Tata Steel Ltd, Jamshedpur 10703390 2.3804 2.3362
3 JSW Steel LTD, Geetapuram 8904781 2.6662 2.6107
4 Arcelor Mittal Nippon Steel India 7683382 2.2701 2.2299
5 Bhilai Steel Plant, Bhilai, Durg 5675148 3.1487 3.0713
6 Tata Steel limited, Meramandali 5158574 2.9745 2.9055
7 Rashtriya Ispat Nigam Limited, Visakhapatnam Steel Plant 4411374 2.9781 2.9089
8 Jindal Steel & Power Ltd Chhendipada Road, SH – 63 4390777 3.1376 3.0607
9 Jindal Stainless Ltd, Kalinga Nagar Industrial Complex (KNIC) Jajpur 4357478 0.8792 0.856
10 Sail, Bokaro Steel Plant, Bokaro 4309143 3.2056 3.1254
11 Rourkela Steel Plant, Rourkela- 4161241 2.9509 2.883
12 Tata Steel Limited, Kalinga Nagar 3464728 2.4479 2.4011
13 JSW Ste elCoated Products Ltd, B-6, Tarapur MIDC Industrial Area, Boisar, Palghar 3262392 0.1209 0.1182
14 Uttam Value Steels Ltd., Bhugaon Road 3261616 0.1488 0.1447
15 Jindal Steel and Power Limited 3252666 3.2231 3.142
16 Bhushan Power & Steel Limited Village. Thelkoloi and 3179861 3.6421 3.5386
17 SAIL- IISCO Steel Plant 2528925 3.2 3.1201
18 JSW St eel Coated Product Ltd., Thane 2509130 0.1526 0.1483
19 Durgapur Steel Plant, Durgapur 2304920 3.1452 3.0681
20 Jindal Stainless (Hisar) Limited, Hisar 2304098 0.492 0.4848
21 JSW Ste elCoated Products Limited, A- 10/1, MIDC Industrial Area,Kalmeshwar, Nagpur 1754590 0.1398 0.1362
22 Shyam Sel And Power Limited (Jamuria) Jamuria Industrial Estate, Bahadurpur 1414290 2.638 2.5818
23 Shyam Metalics & Energy Limited Village: 1383190 2.7124 2.653
24 Uttam Galva Steels Limited, Khopoli Pn Road, Village -Donvat, Khalapur, Raigad 1203926 0.1739 0.1683
25 TATA Steel BSL Limited, Nifan & Savaroli 1164472 0.1415 0.1378
26 JSW Steel ltd., Salem works 1111813 2.7456 2.6868
27 Prakash Industries Limited Hathneora 998386 3.0956 3.0182
28 ESL Steel Limited, Siyaljori 997305 3.4165 3.3254
29 Smridhi Sponge Limited, Mohitpur, Sini 833210 2.0356 1.9401
30 Sidhi Vinayak Metcom Ltd, Rugadi, Chandil, Sarikela – Kharsawan, Jharkhand – 832404 3.0416 2.9563
31 Shri Venkatesh Iron & Alloys(India) Limited Lapanga, Bhadaninagar, Ramgarh 829105 2.115 2.012
32 MAA Ch hinnmastika Cement & Ispat private Limited, Hehal, Barkakana, Ramgarh 829103 2.0149 1.9801
33 Narsimha Iron and Steel Pvt. Ltd., At- Marhand, Katkamsandi, Hazaribagh 825336 2.3311 2.2059
34 Anindita Steels Limited, Senegarha, Rabodh 825330 2.7866 2.715
35 TATA Steel BSL Limited, 23,Site-IV, Sahibabad Industrial Area, Sahibabad 824687 0.1825 0.1764
36 Santpuria Alloys Private Limited, Manjhaladih, Gadi Sermpur Tundi Road 815302 2.7154 2.5456
37 Shivam Iron & Steel Company Ltd Jambad 815301 4.7826 4.6912
38 Atibir Industries Co. Ltd. 812005 2.4681 2.412
39 Vedanta Limited (Value Added Business – Iron Ore Business ), Amona, Marcel 803267 2.9119 2.8541
40 Tata Steel Long Products Limited, Adityapur, Gamharia, Saraikela Kharsawan 797058 3.8517 3.7506
41 Shyam Century Ferrous ( ADivision of Star Ferro and Cement Ltd.), EPIP, Rajabagan 793101 6.2482 6.0921
42 Govindam Projects Pvt. Ltd., 37/1630, Kaloshiria, Kuarmunda, Sundergarh, Odisha 770039 3.0274 2.8162
42 Khederia Ispat Limited, Naikenbahal 770039 2.6423 2.4814
42 Thakur Prasad Sao and Sons Pvt. Ltd., Unit – INaikinbahal, Kuarmunda, Sundergarh 770039 2.371 2.2415
42 Pawanjay Sponge Iron Limited, Bijabahal 770039 2.3272 2.2024
43 Jai Bala ji Jyoti Steels Limited, Tainser 770037 3.5042 3.399
44 Agrasen Sponge Private Limited Mandiakudar, Chungimati, Kansbahal 770034 3.4672 3.1903
45 Pooja Sponge Pvt. Ltd., Plot No. 214, IDCO Industrial Estate, Kalunga, Sundargarh 770031 2.1168 2.0136
45 Jay Iron & Steels Limited, Balanda 770031 2.5051 2.3605
46 Kaushal Ferro Metals Private Limited, Badbahal/Podbahal, Kundukela, Sundargarh 770019 2.5436 2.484
47 Scan Steel limited Unit-1 Ramabahal 770017 3.6712 3.5624
47 Prabhu Sponge Pvt. Ltd., Near-D.I.S. R, Vill – Jhagarpur, Kesramal, Sunderghar, Odisha – 770017 3.0573 2.8419
48 Shree Hari Sponge Pvt. Ltd., Ground Floor, Ambika Niwas Birsa Dahar Road 769012 1.9977 1.9057
49 Jai Hanuman Udyog Limited, Raghunathpali, Kolabira, Jharsuguda 768213 2.0955 1.9943
50 Thakur Prasad Sao & Sons Pvt. Ltd. Unit – IV Lahandabud, Kantapali, Jharsuguda 768202 2.153 2.0595
50 L.N. Metallics Limited, Village-Sripura 768202 1.8709 1.7902
51 Nava Bharat Bentures Limited, Kharagprasad, Meramandali, Dhenkanal 759121 4.4709 4.391
52 Narbhera mPower & Steel (P) Limited Plot No 11 & 13, Gundichapada Industrial Estate 759025 2.2475 2.2042
53 Crackers India Alloys Ltd., Gobardhanpur 758038 2.4478 2.3925
54 Panchawati Steels LLP, Flat No. 201, Near Central Bank of India, Panchawati Tower 758035 2.8937 2.7008
55 Kashvi International Pvt. Ltd., Ramchandrapur, Basantpur, Kendujhargarh 758014 2.1566 2.0495
56 Balasore Alloys Limited, Balgopalpur 756020 4.3092 4.235
57 KJ Ispat Limited, Jakhapura, Jajpur, Odisha – 755026 2.024 1.9297
58 Godawar iPower & Ispat Ltd, Plot No 428/2, Phase-1, Industrial Area, Siltara, Raipur 742623 2.7067 2.6475
59 Ispat Da modaar Pvt. Ltd. Village-Nabagram, P.O.- Bijha, P.S.- Neturia, District- 723121 2.7394 2.5879
59 Mark Ste els Limited Jagannathdihi, Murulia 723121 2.7565 2.5938
60 MB Ispat Corporation Limited, Plot No- 1861, Durgapur Bankura Main Road 722202 2.9845 2.7793
60 Rishabh Sponge Limited, Durgapur-Bankura Main Road 722202 2.6018 2.5394
61 Super Smelters Limited Jamuria Industrial Estate, Ikra, Burdwan, West 714395 2.3643 2.3192
62 Monnet Ispat & Energy Limited 713486 4.5574 4.4158
63 MB Sponge & Power Limited, Near Ikrah Railway Station, Hinjalgora, Jamuria 713362 2.7171 2.547
63 Satyam Smelters Private Limited Jamuria Industrial Area, Ikrah, Pashchim Bardhman 713362 2.6323 2.4839
64 Rajshri Iron Industries Private Limited, Jamuria Industrial Area, Sekhpur, Nandi 713344 2.9072 2.7125
65 Jayaswal Neco Industries Limited, Siltara 705587 3.041 2.978
66 BMM Ispat Limited, Village: Danapur 699993 2.4319 2.3813
67 JSW Steel Limited, Salav 663757 0.9234 0.9117
68 Neelacha lIspat Nigam Limited, Duburi 662837 2.9307 2.8721
69 Sree Ren garaj Ispat Industries (P) Ltd., Plot No-1,2&5, Perundurai, Erode, Tamilnadu 638052 2.1392 2.1
70 MSP ST EEL & POWER LTD, Jamdaon 635474 2.5012 2.4507
71 Hospet Steels Limited Hospet Road 610999 2.7648 2.7127
72 Salem Steel Plant, Salem, Tamilnadu 601150 0.345 0.3414
73 Agarwal Sponge & Energy Pvt. Ltd., Survey No. 899A, 899B, 900, Veeniveerapura Cross 585115 2.5851 2.5235
74 Kamini Iron & Steel Ltd, Sy No 02, Bagnal 583231 2.3476 2.2968
75 Thanush Ispat Pvt. Ltd., Sy No 37, 38, 39/1, 39/2, 40, 41, 43 & 44/1, Kasanakandi Road 583228 2.2513 2.2046
75 Hare Krishna Metallics Ltd. 583228 2.2618 2.2147
76 Hindustan Calcined Metals Pvt. Ltd., B.Belgal – Tumti Road, Janekunte – village 583115 2.1179 2.0766
76 Mahamanav Ispat Pvt. Ltd., Survey No. 81A & 82A, Belgal Village, Bellary, Karnataka – 583115 2.2189 2.1735
76 M/SSuvan Steels, Bellagal Steels Pvt. Ltd., Sy No. 42, Belgallu Village, Ballary 583115 2.5543 2.4942
77 Hothur Ispat Private Limited, Veni Veerapur 583114 1.6755 1.6515
78 Scan Steels Limited. Sy.No.283/B, 284/A, 284/C 583104 2.0353 1.9972
79 Shree Venkateshwara Sponge & Power Private Limited Halkundi, Bellary 583103 2.1556 2.1128
79 Rayen Steels Pvt Ltd., Veeniveerapur 583103 2.2525 2.2057
80 Supra Steels & Power Pvt Ltd, Sy No 276, 280, Siddapur Mines Road, Hallakundi 583102 2.3763 2.3243
80 Popuri Steels Pvt Ltd., Halkundi, Bellary 583102 2.4083 2.3549
81 Shyam Steel Manufacturing Ltd. (Formerly Sova Ispat Ltd.) Mejia 582385 2.1511 2.1137
82 Goa Minerals Pvt. Ltd., (Unit-VMS Ispat) 580011 2.6701 2.6044
83 Shri Baj rang Power & Ispat Limited (Tilda Division) Kh. No. 521/44, Village: Tandwa 570997 1.7098 1.6862
84 SLV Steels & Alloys Pvt Ltd., Nemakal Villege, Bommanahal Mandalam 515871 3.148 3.0566
85 BIOP Steels and Power Ltd., Sy. No. 124, A, B, C, 133 to 141, 143, & 144, Obulapuram 515865 2.6145 2.5515
86 Jeevaka Industries Private Limited, Nastipur Village 502296 2.0753 2.0356
87 Electroth erm (India) Limited, Survey No.325, Nr. Toll Naka, Village: 501090 2.9867 2.9259
88 Tata Met aliks Limited, Gokulpur, Samraipur 499199 2.6522 2.5323
89 Singhal Enterprices Pvt Ltd, Taraimal 496456 3.4233 3.3287
90 Scania Steels and Power Limited, 22th K.M. Stone, Gharghoda road, Punjipatra, Raigarh 496001 1.3696 1.3264
90 Nav Dur gaFuel Private Limited, Saraipalli, Gharghora Road, Raigarh, Chhatisgarh 496001 4.0693 3.9356
90 MAA Shakambari Steel Limited, Village: Sambalpuri, Hamirpur Road, Raigarh 496001 1.8511 1.8217
90 N. R. Ispat and Power Private Limited, Gourmudi, Gerwani, Raigarh, Chhattishgarh 496001 3.1455 3.0608
90 MSP Sp onge Iron Ltd Village Manuapalli 496001 7.0265 6.8291
91 Mahalax miTMT Pvt. Ltd. C-2 , MIDC , Deoli Growth Center , Deoli, Wardha 495675 0.5825 0.5724
92 Chhattis garh Steel & Power Plant Amjhar, Mahuda, Janjgir-Champa, Chhattisgarh 495671 7.8415 7.5957
93 Hira Po wer & Steel Ltd., Urla Industrial 493221 3.3723 3.3268
93 Alok Fe rro Alloys Ltd. 458/1, 459 Urla industrial Area, Raipur, Chattishgarh 493221 7.5558 7.3275
93 Hira Fer roAlloys Ltd., 490/1, 491/2, Urla industrial Area, Raipur, Chhattisgarh 493221 4.8283 4.7351
94 Mahendr aSponge & Power Ltd., Plot No. 76 & 77, Siltara Industrial Phase-2, Mandhar 493111 2.4102 2.3633
94 Sunil Sp onge (P) Limited, Phase- 2, Siltara 493111 2.7027 2.6401
94 P.D. Ind ustries Pvt. Ltd. Vill-Siltara, Phase- 493111 2.0974 2.0032
94 Rama Udyog Private Limited Phase-II, Indutrial Growth Centre, Siltara, Raipur 493111 3.1558 3.0754
94 Nutan Is pat and Power Pvt. Ltd., Kharoda Road, At – Jarouda, Tarra, Raipur 493111 3.0016 2.8197
94 G. R. Sp onge and Power Limited, Plot No. 102, Phase-II, Siltara Industrial Area 493111 3.1228 3.0441
95 Rashmi Sponge Iron and Power Industries Pvt. Limited, 90, Phase – 2, Siltara Industrial 492001 2.0297 1.9944
95 S.K. Sar awagi & Co. Pvt ltd., Plot NO. 38 to 41 & 48 to 52, Vill-Sankra, Siltara industrial 492001 2.6382 2.582
95 Agrawal Sponge Private Limited, 91-92, Siltara Growth Center, Phase-2, CSIDC 492001 2.5012 2.4436
96 Jai Balaj iIndustries Limited, Borai Industrial Growth Centre, Rasmada, Durg 491009 3.1742 3.0879
97 Sarda Energy & Minerals Ltd. Industrial Growth Centre, Phase- 490039 2.9884 2.9163
98 Steel Authority of India Limited – Chandrapur, Ferro Alloy Plant, Mul Road 442401 3.3699 3.3245
99 Electrost eel Casting Ltd Sri Kalahasti Mandal, Rachagunneri, Tirupati, Andhra 442045 2.8494 2.711
100 Sunflag Iron and Steel Co. Ltd.,Bhandara 432914 3.8362 3.7358
101 VISA Steel Limiled, Kalinga Nagar Industrial Complex, Jakhapura, Jajpur Road 422708 2.5903 2.5361
102 Shraddha Ispat Pvt Ltd., Santona 403706 2.2724 2.2248
103 B. S. Sp onge Pvt. Ltd. Village: Taraimal, Post: Gerwani, Raigarh, Chhattisgarh 398308 2.4157 2.3686
104 Tata Steel Long Products 389247 2.0904 2.0502
105 Gallantt Metal Limited, Survey No. 175/1, Near Toll Gate, Samakhiali, Kutch, Gujarat – 378963 2.6706 2.6095
106 Nilkanth Concast Private Limted Survey No 221, Village- Vadala, Tal- Mundra, Kutch 370410 2.4604 2.3308
107 Gagan Ferrotech Limited Jamuria Industrial Estate, Ikra, Burdwan, West 349720 2.287 2.2448
108 Saarloha Advanced Materials Pvt Ltd 72-76 Mundhwa (Near Bharat Forge Ltd), Pune 338210 0.382 0.3711
109 SKS Is pat and Power Limited, 18th Milestone, Bilaspur Road,Vill-Siltara 334879 2.9012 2.8332
110 Nalwa Steel and Power Ltd, Gharghoda road, Taraimal, Gerwani, Raigarh, Chhattisgarh 307906 2.8217 2.7574
111 Electrost eel Casting Limited, Khardah Works Khardah, Sukchar, North 24 305353 1.8997 1.8382
112 Mahindr aSanyo Special Steel Private Limited Jagdish Nagar, Khopoli, Raigad 302518 0.2957 0.2931
113 Aarti Ste els Ltd, Ghantikhal, Mahakalabasta 302196 2.9748 2.9034
114 Arjas Steel Private Limited 293008 3.4125 3.3217
115 Mukand Ltd, Thane-Belapur Road, Dighe 289629 0.5622 0.5528
116 API Ispat & Powertec Pvt. Ltd., Siltara 288496 2.6186 2.5599
117 JSW Isp atSpecial Products Limited, Mandir 287544 2.7371 2.6766
118 SLR Metaliks Ltd. Sno. 632, Narayanadevarakere, Lokappanahola 283875 2.7944 2.6612
119 SPS Stee ls Rolling Mills Limited Dr. Zakir Hussain Avenue Indo American Mode, P.O. 279682 3.3957 3.163
120 Janki Corporation 278825 2.2337 2.1877
121 Vandana Global Limited, Siltara Industrial Growth Center Phase 2, Raipur 268181 3.3683 3.2766
122 Real Isp at & Power Ltd., Borjhara Urla 267905 3.5139 3.4142
123 Shyam Steel Industries Limited Raturia Industrial Area, Angadpur, Durgapur, West 262305 2.0433 1.9539
124 Ind Syne rgy Limited Village: Kotmar, Near Mahuapalli, Gharghora, Saraypali, Raigarh 260384 3.2187 3.1299
125 Shri Baj rang Power & Ispat Ltd, Village Borjhara, Urla – Guma Road, Urla, Raipur 244380 1.7952 1.7691
126 Shreeyam Power and steel Industries Ltd. Plot No 332, New GIDC Area Phase 236471 2.7063 2.5584
127 Crest Steel & Power Pvt Ltd., Village: Joratari, post: Mangatta, Dist: Rajnandgaon 233504 1.8878 1.8573
128 Minera Steel and Power Pvt. Ltd. Yarabana 219150 2.0539 2.0178
129 concast steel & Power Ltd village- 217930 2.3546 2.3168
130 Noble Tech Industries Pvt Ltd 14/2 A2 Melpakkam Village, Uthiramerur 214696 1.5745 1.5545
131 KIC Me taliks Limited Durgapur , Angadpur 212615 2.8778 2.7366
132 Shyam Sel And Power Limited (Mangalpur) G-6, Mangalpur Industrial Estate, Raniganj 210563 2.2401 2.1971
133 SMC Power Generation Ltd., Hirima 209548 2.9203 2.8514
134 Shri Ba jrang Power & Ispat Ltd (TMT Division), KH-2/3, Urla Industrial Complex 206001 0.8801 0.8569
135 Nova Ir on& Steel Ltd. Village, Dagori, Tehsil Belha, District Bilaspur, Chhattisgarh 205466 1.9686 1.9354
136 Pushpit Steels Pvt. Ltd. Merlapaka village 204116 2.1764 2.0808
137 A-One Steels & Alloys Pvt. Ltd., Ward No.2 , Plot No. 412, Sidiginamola 199924 2.0936 2.0582
138 Lloyds Metals and Energy Limited, A- 1 & 2, M.I.D.C. 199838 2.5742 2.5131
139 Rungta Mines Limited (Sponge 199462 2.0829 2.0429
140 Steel Exchange India Limited Sreeramouram, R.GPeta Post 198344 3.3436 3.2533
141 Welspun Corp Ltd., Village: Versamedi, Ta: 189798 2.2247 2.1823
142 Shree Nakoda Ispat Ltd Phase – II,Industrial Growth Centre Siltara 184416 1.8484 1.8208
143 Kamalje etSingh Ahluwalia Steel and Power 184159 2.8593 2.7893
144 NRVS Steels Ltd. Teraimal, Gharghoda 184152 3.784 3.4949
145 Prakash Sponge Iron & Power P. Ltd. Sy. No. 42 & 43, Heggere Challakare, Sanikere 183014 1.5247 1.5059
146 Neo Me taliks Limited Gopalpur, Durgapur 182362 2.777 2.6455
147 Sunvik Steels Private Limited, Survey No. 59-72, Jodideverahalli, Kallambella, Sira 175281 1.8848 1.8561
148 SAL St eel Limited Survey No-245 Vill- Bharapur Tal- Gandhidham, Asipur, Kutch 172075 2.087 1.9991
149 Topwort\hSteel and Power Pvt. Ltd., Borai Industrial Growth Centre, Village Rasmada 169668 2.5718 2.5152
150 Maithan Ispat Limited Dasmania, Jakhapura 169425 2.8927 2.821
151 Mono Steel India Limited Survey No.375/1,374,396/1,397,398,376, 378/2,377/1,377/2 PAIKI 2, VILL: 165723 1.8678 1.7931
152 Sree Me taliks Limited Loidapada, Barbil 165372 3.036 2.9571
153 Jai Ba laji Industries Limited G-1, Mangalpur Industrial Complex 165172 2.7406 2.6799
154 Shri Jaga nnath Steels & Power Ltd. Uli Buru 163940 3.3322 3.2425
155 Kamachi Industries Ltd Survey no. 86, 115- 119,123-125, Pathapalayam 163331 2.0288 1.9458
156 Niros Isp at Pvt. Ltd. 14-AHaevy Industrial Area, Hathkhoj, Bhilai, Durg, chhattisgarh 163218 1.9957 1.9616
157 Indian Metals & Ferro Alloys Ltd., Choudwar, Kapaleswar, Cuttack, Odisha 161879 4.7428 4.6529
158 HRG Alloys and Steels Pvt. Ltd Survey No. 12 & part of 14 159369 1.8152 1.7885
159 Chintpur niSteel Pvt. Ltd. 15 Mile, Jarwa 153865 2.406 2.282
160 Aarti Sp onge and Power Limited Bahesar Road Murethi, Siltara, Raipur 151837 2.3456 2.3012
161 Maruti Ispat and Energy Private Limited., Mantralayam, Kurnool, Andhra Pradesh- 147243 2.1015 2.0658
162 Sambhv Sponge Power Pvt Ltd Sarora 145084 2.9324 2.7588
163 Raipur Power and Steel Limited Industrial Growth Centre, Borai, Durg, Chhattisgarh 144544 2.4436 2.3925
164 VRKP Sponge & Power Limited Halkundi 144364 2.3075 2.2645
165 Padmavati Ferrous Ltd., Chikkantapur 142770 2.5956 2.5335
166 Shree Ganesh Metaliks Ltd Chardrihariharpur, Kuarmunda, Sundergarh 141678 2.8227 2.7544
167 Goa Spo nge and Power Ltd, Village Santona 138955 2.1595 2.1195
168 Drolia Electrosteels Pvt. Ltd. Village- 138354 2.0176 1.9847
169 Sanvijay Alloys & Power Ltd P.No. A-23- 24-29-30-31 & D14, NIDC Tadali, MIDC 136037 2.5931 2.4573
170 Maa Mahamaya Industries Limited R.G,Peta Village, L,Kota Mandalam 134983 3.1998 3.1172
171 Shri Shyam Ispat (India) Private Limited, Taraimal, Gerwani, Raigarh 133915 3.0033 2.9304
172 Anjani Steel Ltd., Ujjalpur, Gerwani 133133 2.8621 2.7919
173 Vanya Steel Pvt. Ltd. Survey No. 48, 49A, 52, 53, 54,55 & 58, Hirebagnal Village 131515 2.1709 2.1275
174 Viraj St eel and Energy Private Limited, Gurupali, Lapanga, Sambalpur, Odisha 131311 3.6624 3.5541
175 HI-Tech Power and Steel Limited, Parsada 130888 2.3418 2.2975
176 Saluja Steel and Power (P) Limited Mahatodi, Tundi road, Giridih 127288 2.2332 2.1325
177 Aryan Ispat and Power Pvt. Ltd., Bomaloi 123310 2.2894 2.1686
178 Sky all oys and power private limited Temtema, Robertson, Raigarh, Chhattisgarh 120040 3.8957 3.7731
179 MSP Sponge Iron Limited, Haldiguna 118106 2.8435 2.6803
180 Mangal Sponge & Steel Pvrivate Limited 115565 2.902 2.8299
181 Brahmap utra Mettalics Limited, Village 112917 2.5818 2.5247
182 Apple In dustries Ltd Sy.No.354, D.Hirehal Village & Mandal, Anantapur, Andhra 112778 4.0813 3.7245
183 Electrost eel Casting Limited Haldia, Shibramnagar, Purba Medinipur, West 107300 2.2379 2.1974
184 Haldia Steels Pvt. Ltd. (Unit-II) 105480 2.7366 2.6725
185 Rashmi Ispat Limited 104918 2.3117 2.2625
186 Reliable Sponge Private Limited 104603 3.314 3.2253
187 Gopani Iron & Power (I) Pvt Ltd., Chandrapur, Tadali, Chandrapur 104236 2.6513 2.5911
188 Bhaskar Steel & Ferro Alloy Pvt. Ltd. Badtumkela, Rajamunda, Lahunipada 104139 1.9796 1.8957
189 Jharkhan dIspat Private Limited Hesla 101490 2.391 2.3421
190 MGMMinerals ltd, Village- 101126 1.9515 1.9164
191 Patnaik Steels and Alloys Limited 100181 2.8419 2.7727
192 Adhunik Metaliks Limited 96110 2.5335 2.4743
193 Kirloska rFerrous Ind Ltd Bevinahalli 94007 2.9214 2.8632
194 Devi Iro nand Power Private Limited village Tanda, Mohandi Road, Block Dharsiwa 91192 2.4033 2.3539
195 Nava Bh arat Ventures Limited Paloncha 90713 8.2505 7.9783
196 Aloke Steels Industries Private 87925 2.1355 2.0935
197 Cauvery Iron & Steel (India) Ltd Sy No 650A to 656A, Khajapur Village 86449 3.7705 3.6557
198 Bhagwat iPower & Steel Ltd. Phase # 2, industrial Area, Siltara, Raipur 83808 2.3054 2.2625
199 Baba Akhila Sai Jyothi Industries Pvt. Ltd. 79960 1.9307 1.8964
200 Ferro Alloy Corporation Limited, Charge Chrome Plant Randia Haat, Bhadrak 79572 5.7969 5.6625
201 Times Steel and Power Pvt. Ltd. Plot Number 98, Industrial 78566 2.7324 2.6636
202 Topwort hUrja & Metals Ltd. Village Heti, Mouza Ukkarwahi, Post Udasa 76946 3.5774 3.474
203 Shiavaly Ispat and Power Private Limited Kara 76041 2.1829 2.139
204 Vaswani Industries Ltd Near Cycle Park 74004 3.706 3.5883
205 Jairaj Ispat Ltd Sy.67, 68 B 69381 2.1595 2.1165
206 JSW Projects Limited (earlier IST Steel and Power 64820 2.1625 2.1194
207 Dhruvdesh Metasteel Pvt. Ltd. Survey No. 150-156 63989 2.2576 2.2106
208 Ghankun Steels, Pvt Ltd 78, Phase II, Industrial 62259 2.1793 2.1355
209 Akshara Industries Ltd. SF No. 225/1C1, 225/1C2 56748 3.4276 3.3193
210 Gopal Sponge & Power Pvt. Ltd. Phase-2 Industrial Growth Center, Siltara, Raipur 56157 1.3442 1.3055
211 Satya Power & Ispat Ltd., Vill- Gatauri 55233 2.6165 2.4588
212 Sai Sponge (India) Private Limited, Nawagon 53245 2.6315 2.5676
213 Tunics Sponge Pvt. Ltd., Sy 138a/1, 138a/2 52236 2.254 2.2072
214 Surendra Mining Industries Private Limited 51922 2.4177 2.3676
215 Amiya Steel Pvt. Ltd., Village Tarapore 50997 2.9061 2.7115
216 Vishal Metallics Private Limited 49179 2.526 2.4672
217 Maa Kal iAlloy Udyog Pvt. Ltd. Vill- Pali 48774 4.0635 3.7099
218 Bhadrashree Steel & Power Limited Sy No. 114/115/116 48536 2.3452 2.2945
219 Sponge Udyog Private Limited 41580 2.9442 2.8643
220 GM Iron & Steel Company Limited, Village- Jamua, P.O.- Mejia, District- Bankura, West 41017 3.0198 2.8097
221 Shiv Mettalicks (P) Ltd., At- Gurundupali 40831 2.547 2.3976
222 B.R.Sponge & Power Limited Village- Badtumkela, Police 39851 3.121 3.0312
223 Ferro Alloy Plant, Bamnipal, Tata Steel 37638 4.3314 4.2564
224 Seven Star Steels Limited Kelendamal 37387 3.6314 3.349
225 Ambey Metallic Limited, Plot No. 69-75, 143-160 Pissurlem 30599 1.7225 1.6951
226 Maithan Alloys Limited A6, E.P.I.P, Rajabagan, Byrnihat,RI- 12382 4.5025 4.4215


5. How to read (and use) this list

  1. Benchmark your GEI – If you’re above peer median of 2.7 tCO₂/t, you’ll be a net buyer of credits.

  2. Collaborate on off-site mitigation – Anaxee’s rural network can unlock agroforestry, biochar, or cook-stove credits in districts where many mills sit (Raigarh, Sundargarh, Bellary).

  3. Watch the secondary steel curve – Mini-mills with GEI < 2.2 t are potential sellers; handshake deals now could secure credits at ₹600 vs >₹1 000 later.


6. Final thoughts-

Steel’s decarbonisation journey is a marathon with nasty sprints—energy audits, MRV paperwork, farmer outreach for offsetting, you name it. Anaxee’s 50 000 Digital Runners can be your on-ground extension arm, whether it’s sampling slag emissions or planting a million saplings along the Mahanadi belt. Ping us at sales@anaxee-wp-aug25-wordpress.dock.anaxee.com let’s chop some mega-tonnes together.

An Anaxee field worker photographs a ground-mounted solar panel array in a lush farm, documenting a solar-agriculture pilot in rural India.

Climate Training Made Simple: Anaxee’s All-in-One Learning Program on Climate Change, Carbon Credits & Projects

Climate Knowledge for Everyone: Anaxee’s Climate Partner Training on Climate Change, Carbon Credits & Projects
Anaxee's Climate Partner Training Course to learn about Climate Change, Carbon Credits and Carbon Projects

Climate change is no longer a distant threat. It’s here, and it’s affecting our crops, our water, our health, and our economy. Yet most people, especially in rural and semi-urban areas, struggle to understand what climate change is and how it impacts their everyday life.

At Anaxee, we believe that the first step to solving a problem is understanding it. That’s why we’ve launched a simple, comprehensive, and affordable Climate Partner Training Program that breaks down complex concepts into bite-sized, easy-to-learn modules. This program is designed not for scientists or policymakers, but for real people working on the ground- field staff, students, NGO professionals, CSR teams, and anyone who wants to contribute to the climate movement.

Why We Built This Program:

India has immense potential to lead in the global climate effort. We have the land, the people, and increasingly, the technology. What we often lack is climate literacy at the grassroots. When people know why they are doing something, they do it better.
That’s what this training solves.

We’ve trained over thousand Digital Runners across India who execute projects like tree plantations, clean cooking stove distribution, and data collection. Now, we’re giving them (and you) the knowledge to understand the science and the purpose behind it.

And the best part? It’s available in simple Hindi, accessible from any device, and costs just ₹499 per year.


What Does the Climate Partner Training Include?

The training is divided into four modules, each designed to take the learner on a step-by-step journey from awareness to action. Here’s what’s inside:

Module 1: Understanding Climate and Climate Change

Anaxee's Climate Partner Training Module One- Introduction to Climate and Climate Change

This foundational module sets the stage by answering basic but important questions:

– What exactly is “climate”?
– How is it different from weather?
– What are the key indicators of climate change?
– How is human activity responsible?

Format: Video lecture + PDF article + Multiple-choice assessment

The goal here is to help every participant, no matter their background, understand the scientific reality of global warming and its connection to their daily life. The content uses regional examples, animations, and analogies to keep it relatable.

Module 2: Carbon Emissions and the Greenhouse Effect
Anaxee's Climate Partner Training Module Two- Carbon Emission & Green House Effect

Now that learners understand the problem, this module dives into what causes it:

– How different sectors (transport, energy, industry, agriculture) emit carbon
– What is the greenhouse effect?
– How do carbon sinks like forests and soils help?
– What are the consequences of rising emissions?

Includes a Hindi explainer PDF that translates technical terms like CO2, CH4, GHG, etc., into easy language. Also includes emotional storytelling on climate disasters and their root causes.

Format: 3 videos + 1 document (in Hindi) + Quiz

Module 3: Emission Reduction and Sustainable Solutions
Anaxee's Climate Partner Training- Module Three- Introduction to Preventative Steps & Emission Reduction

This module is action-oriented. Learners explore:

– What emission reduction means in real-world terms
– Breakdown of emissions by sector (buildings, transport, waste, etc.)
– How individuals, companies, and communities can reduce emissions
– How it connects with the UN’s Sustainable Development Goals (SDGs)

We also introduce tools like carbon calculators, simple lifestyle changes, and community-based projects that lower carbon footprints. Learners see examples of:

– Electric scooters replacing diesel ones
– Solar panels on rooftops
– Waste segregation and biogas units

Format: Videos + SDG Article + Interactive Quiz

Module 4: Carbon Credits & Climate Projects
Anaxee's Climate Training- Module Four: Carbon Credit & Carbon Projects

This is the most applied module, where learners see how climate knowledge translates into real projects and finance.

It includes:

– What is carbon finance?
– What is a carbon credit?
– Who buys credits, and who earns them?
– How do field-level actions convert into carbon credits?

Gallery of Carbon Projects

We use Anaxee’s own experience to explain:

– Agroforestry Projects – How bund plantations help farmers and sequester carbon

– Improved Cookstove Projects – Reducing indoor air pollution and firewood use

– Bamboo Cultivation Projects – Fast-growing carbon sinks

– Clean Energy Projects – Solar, EVs, and energy efficiency

– Waste Management – Based on Indore’s smart city model

– Green Transportation – Partnering with MoEVing and others

Each project section includes:

– Short case study
– Visual explanation

Format: 8+ Video modules + PDF Articles + Assessment + Final Conclusion


What Makes Anaxee’s Training Unique?

There are many climate courses online, but few are:

– In Hindi and built for Indian learners
– Based on real field experience from 540+ districts
– Designed for non-technical audiences
– Used by an actual implementation company working on verified carbon projects

This is not theory-only. This is practice-based climate learning.

We use this exact same training to upskill our internal teams and partners. Our Digital Runners, field managers, outreach teams, and even new corporate partners take this course before project execution.

That means you’re learning what real practitioners learn.


How It Helps You (or Your Organization)

– If you run a plantation or agroforestry program, you’ll understand how to make it carbon-credit eligible
– If you promote clean cooking, you’ll understand the science behind emission savings
– If you work with e-vehicles or solar, you’ll learn how those contribute to net-zero goals
– If you’re in CSR or ESG, this training equips your field teams with the context behind your goals
– If you’re a student or educator, this is a complete primer on carbon and climate topics in local language


Pricing & Access


Payment option for Anaxee's Climate Partner Training Course


– Cost: ₹499 (One-time)

– Access: 1 Year (Unlimited viewing)

– Device: Mobile-friendly, works on phones, tablets, desktops

– Includes: Video Lectures, Articles, Quizzes, Certificate

We’ve intentionally priced this affordably to ensure climate education is not limited to elite classrooms or urban audiences.


How to Enroll?

Visit- https://o.anaxee.com/climatepartnertraining

Click on Enroll Now, make payment, and start learning. It’s that simple.


Final Thoughts: Learning Climate by Doing

India will play a decisive role in the global climate battle. But change doesn’t just come from policy or top-down pressure. It comes from millions of people understanding, caring, and acting.

This training is a step in that direction.

It enables you to:

– Think critically about climate issues
– Communicate effectively on climate topics
– Understand carbon projects and green finance
– Join a growing ecosystem of action-driven climate workers

So whether you’re in a village, a university, an NGO office, or a corporate boardroom, this course is for you.


Call to Action

🎓 Enroll Today – For just ₹499, get access to India’s most practical, people-first climate training program.

🌱 Upskill Your Field Team – Equip them with knowledge, not just instructions.

🔗 Click Here to Start-  https://o.anaxee.com/climatepartnertraining

Field Worker Sapling nursery agroforestry carbon project in India


How Anaxee Is Leading Climate Action in Developing Nations via Nature-Based Carbon Credits

Anaxee Emerges as a Climate-Change Frontrunner in the Developing World with High-Integrity Nature-Based Carbon Credits

1. Climate Finance’s Brutal Math

Developing economies need USD 359 billion per year just for climate adaptation- yet public flows reached only USD 28 billion in 2022, leaving a yawning gap. The mismatch is even starker for mitigation: analysts project demand for voluntary carbon credits could grow 15-fold by 2030, pushing the market well past USD 50 billion.

Shortfall + soaring demand = a unique moment for credible, nature-based carbon projects—if they can prove impact, fend off “green-washing,” and reach dispersed rural stakeholders.


2. Why Nature-Based Credits Still Matter—Integrity or Bust

– High Abatement Potential: NbS could deliver 30-40 % of the CO₂e reductions required for a Paris-aligned pathway.

– Cost Curve Advantage: Median delivery costs hover between USD 10-40 / tCO₂e- competitive even after recent market corrections.

– Co-Benefits: Restored soils, diversified farmer income, biodiversity gains- outcomes investors increasingly price in.

But integrity is non-negotiable. ICVCM’s new Core Carbon Principles and updated SBTi guidance tilt capital toward projects with transparent baselines, rigorous MRV, and community buy-in.


3. Meet Anaxee: India’s Climate Execution Infrastructure
Field Workers for Agroforestry Project in India

India’s Reach Engine- 50,000 Digital Runners deployed across 26 states, 540+ districts, 11,000+ PIN codes.

Founded in Indore, Anaxee Digital Runners Pvt Ltd turns the hardest part of any carbon project—ground truth—into a repeatable service layer:

Core Asset What It Does Why It Matters
Digital Runners Community-embedded field agents with geo-tagged mobile app Verifiable data, fluent local languages, instant scale-up
Tech for Climate™ Platform Remote-sensing + drone imagery + AI tree-count + blockchain audit trail End-to-end traceability that satisfies Verra, Gold Standard, CCTS, etc.
Last-Mile Ops Logistics, training, distribution (e.g., 125,000 improved cookstoves delivered) Converts registry paperwork into real-world impact

Result: Anaxee delivers nature-based carbon projects that international buyers can audit, de-risk, and scale.


4. The Execution Gap- and How Anaxee Closes It
4.1 Farmer On-Ramp at National Scale

– Polygon-based land mapping within the mobile app
– Instant KYC + consent workflow in 11 regional languages
– In-app agronomy prompts nudging farmers toward regenerative practices

4.2 Transparent MRV

1. Baseline Survey → Digital Runners collect soil, biomass, and socio-economic data.

2. Remote-Sensing Layer → Sentinel-2/PlanetScope imagery feeds biomass & canopy models.

3. Continuous Monitoring → Periodic drone fly-overs; sensor data synced to immutable ledger.

4. Third-Party Audits → Data packets served via API to accredited auditors, reducing field costs by up to 40 %.

Drone Tree Counting for Agroforestry Project in India


4.3 Benefit-Sharing Engine

Revenue split is codified in smart contracts- farmers see a direct wallet transfer when credits are issued, minimizing leakage risk and boosting adoption rates.


5. Portfolio Snapshot (2023-2025)

6. Tech for Climate™- Under the Hood
Nature-Based (NbS) and Community projects. (Agroforestry, Regen Agriculture, Solar devices, Improved Cookstoves, Water filters, LED lamps, etc.) worldwide.
 

The platform is registry-agnostic: Anaxee pipes verified data directly into Verra’s project ID structure or GS Impact Registry, slashing lead times by 20–30 %.


7. Validation & Integrity Guardrails

– Standards: Verra, Gold Standard, CCB, CDM & emerging CCTS-India pathways

– Validation/Verification Bodies (VVBs): TÜV Rheinland, Climate Impact Partners, EPIC Sustainability

– Core Carbon Principles (ICVCM): Full alignment on baseline additionality, permanence buffers, and robust stakeholder consultation

Investors gain credits that clear the growing “quality filter” of institutional buyers—no stranded inventory risk.


8. Why Now? Three Macro Signals You Shouldn’t Ignore
  1. Policy Tailwinds – India’s Carbon Credit Trading Scheme formally opens domestic demand in 2025, with exporters already prepping for a compliance top-up.

  2. Market Integrity Reset – ICVCM’s Core Carbon Principles became live in March 2025; early movers securing “CCP-labelled” credits enjoy a price premium.

  3. Supply-Demand Squeeze – McKinsey forecasts durable removal demand alone at 100 MtCO₂e by 2030; NbS demand could be higher even after conservatism discounts.

The upshot: high-quality nature-based credits from trusted platforms will not sit unsold.


9. Call to Action
Invest where impact meets execution.

Whether you’re a corporate chasing SBTi-aligned targets, an impact fund hunting credible returns, or a philanthropist scaling climate justice, Anaxee offers a pipeline that is execution-ready, traceable, and community-positive.


Ready to co-create climate impact at scale?
Reach us at sales@anaxee-wp-aug25-wordpress.dock.anaxee.com

Tech for Climate for Nature based Carbon Project